Scholastic sports have nearly doubled from an estimated 4.0 million participants in 1971-1972 1 to 7.98 million participants in 2017-2018.2 These high school athletes experienced an estimated 1.4 million injuries in 2017-2018.3 Data from the National High School Sports-Related Injury Surveillance System using RIO (Reporting Information Online) as a surveillance system, was used to examine injury rates and trends. This data provides quality epidemiologic information entered by athletic trainers associated with participating high schools and provides nationwide estimates for injury incidence rates in common high school sports.
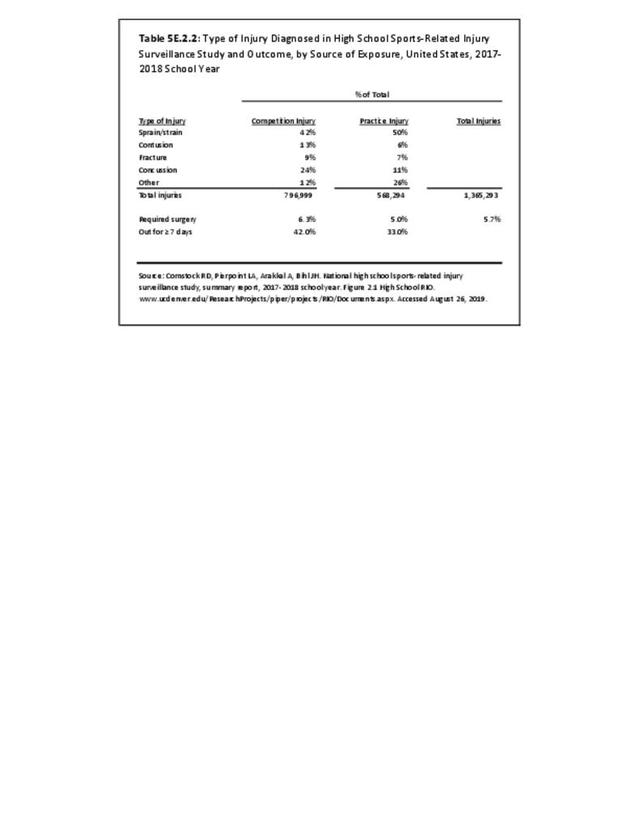
Using the National High School Sports-Related Injury Surveillance Study, it was estimated that more than 17 million injuries resulted from participation in team sports at the high school level during the 13 years studied between the 2005-2006 and 2017-2018 school years. On average, of the total injuries documented during the surveillance period, strains/sprains accounted for 44%, concussions represented 18%, contusions comprised 11%, and fractures were documented in 9% of cases. Injuries categorized as “other” comprised 18% of all injuries. Overall, the majority of injuries from participating in high school athletics impacted the musculoskeletal system.4

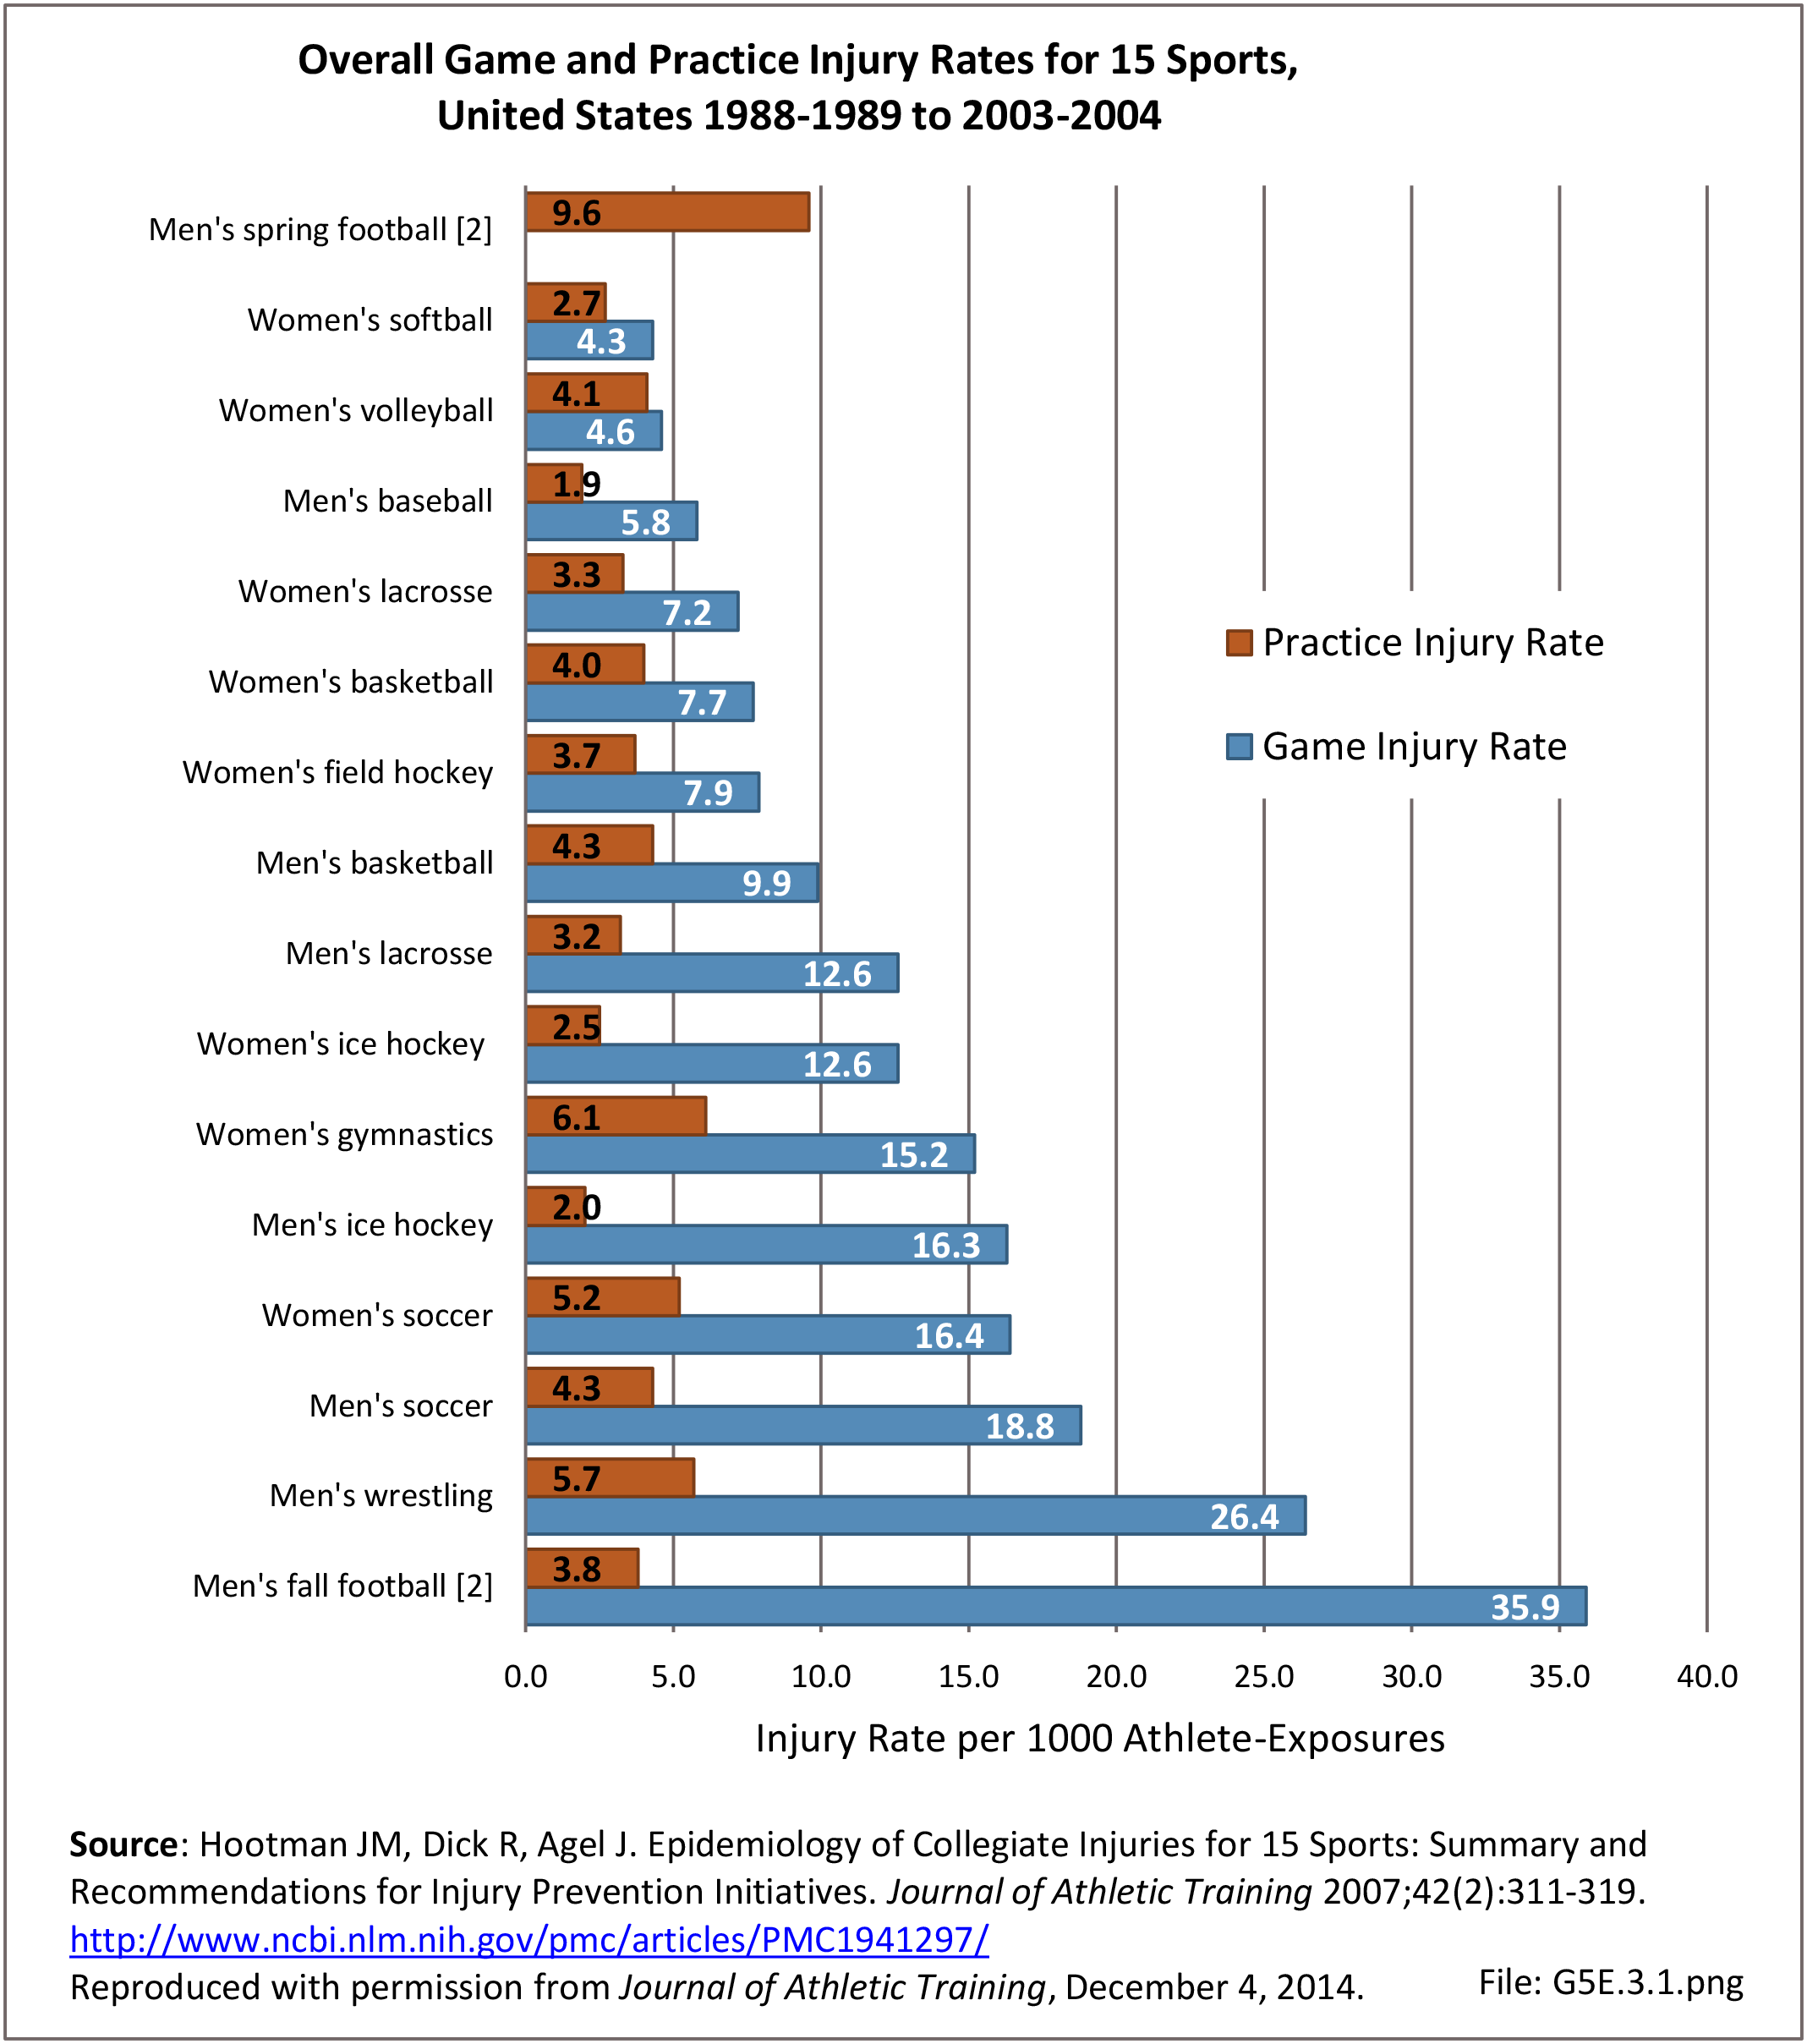
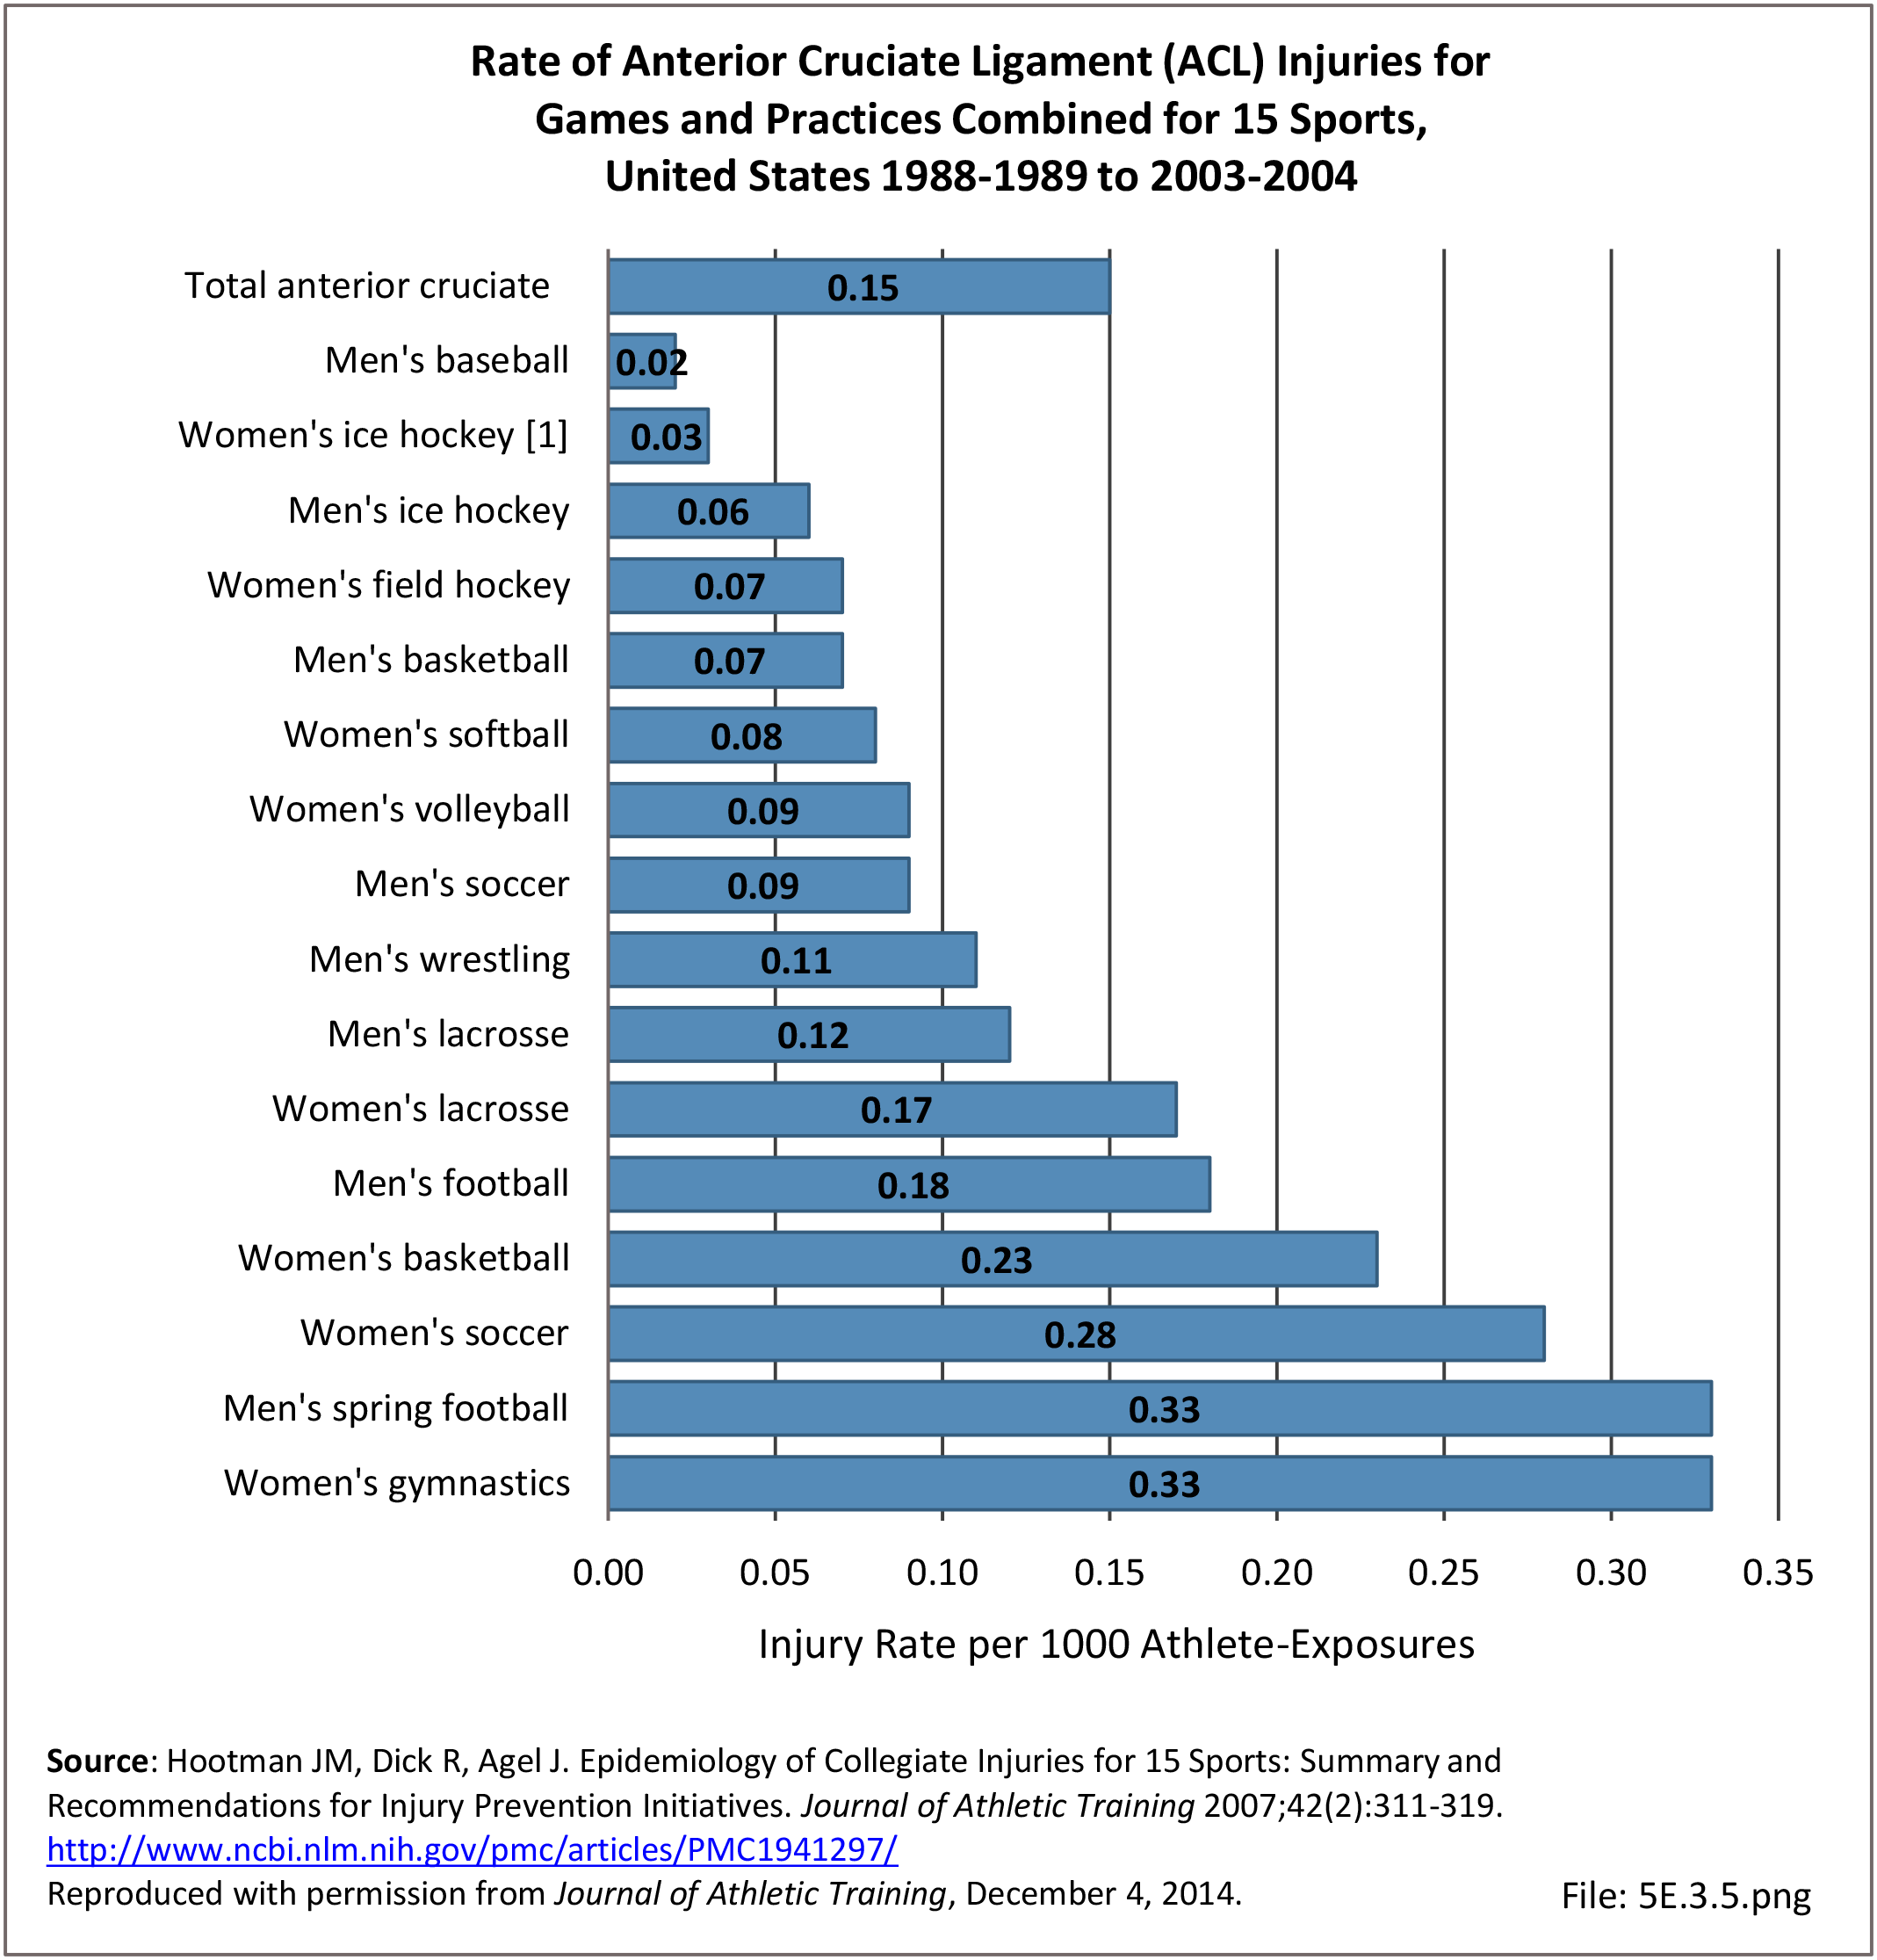
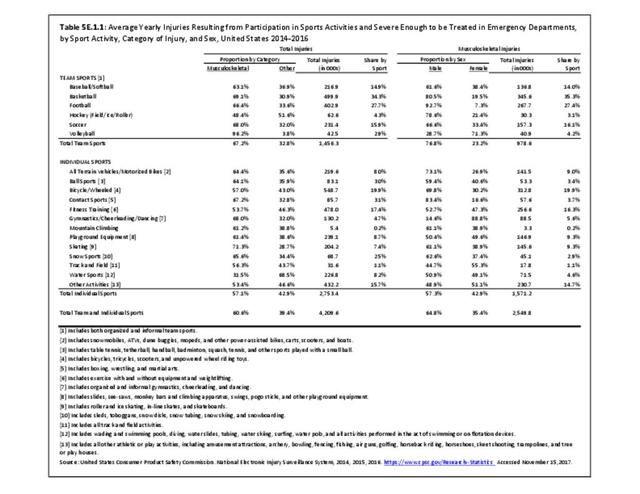
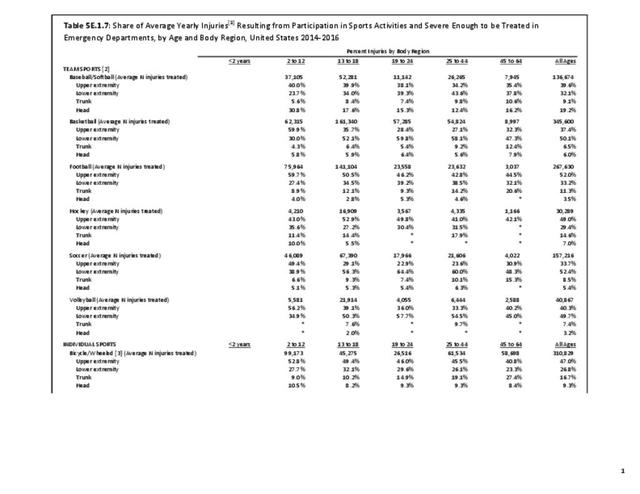
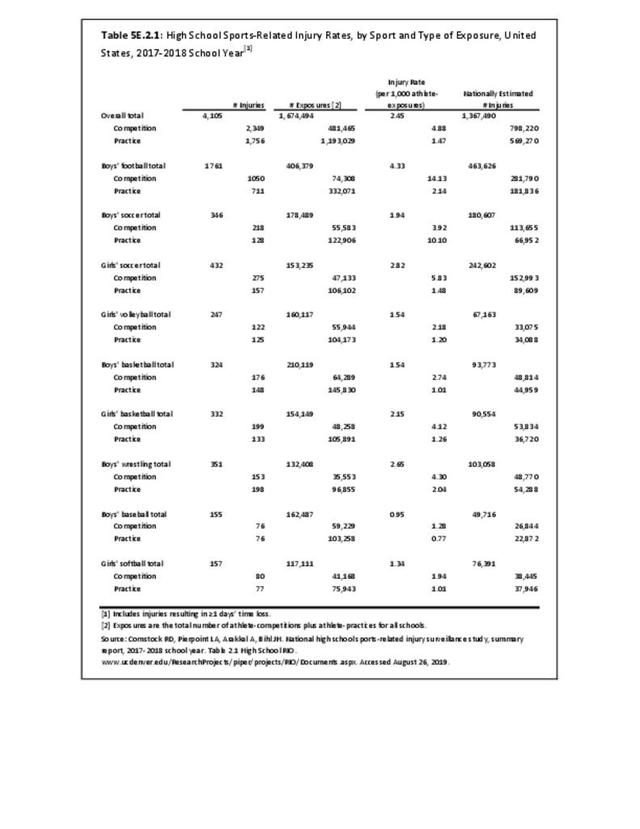
Football had the highest injury incidence rate for musculoskeletal injuries among all team sports at the high school level, followed by girls’ soccer and boys’ wrestling. In 2017-2018, football also had the greatest number of total injuries as well. In every sport besides girls’ volleyball and boys’ wrestling, more injuries occurred during competition when compared to practice.
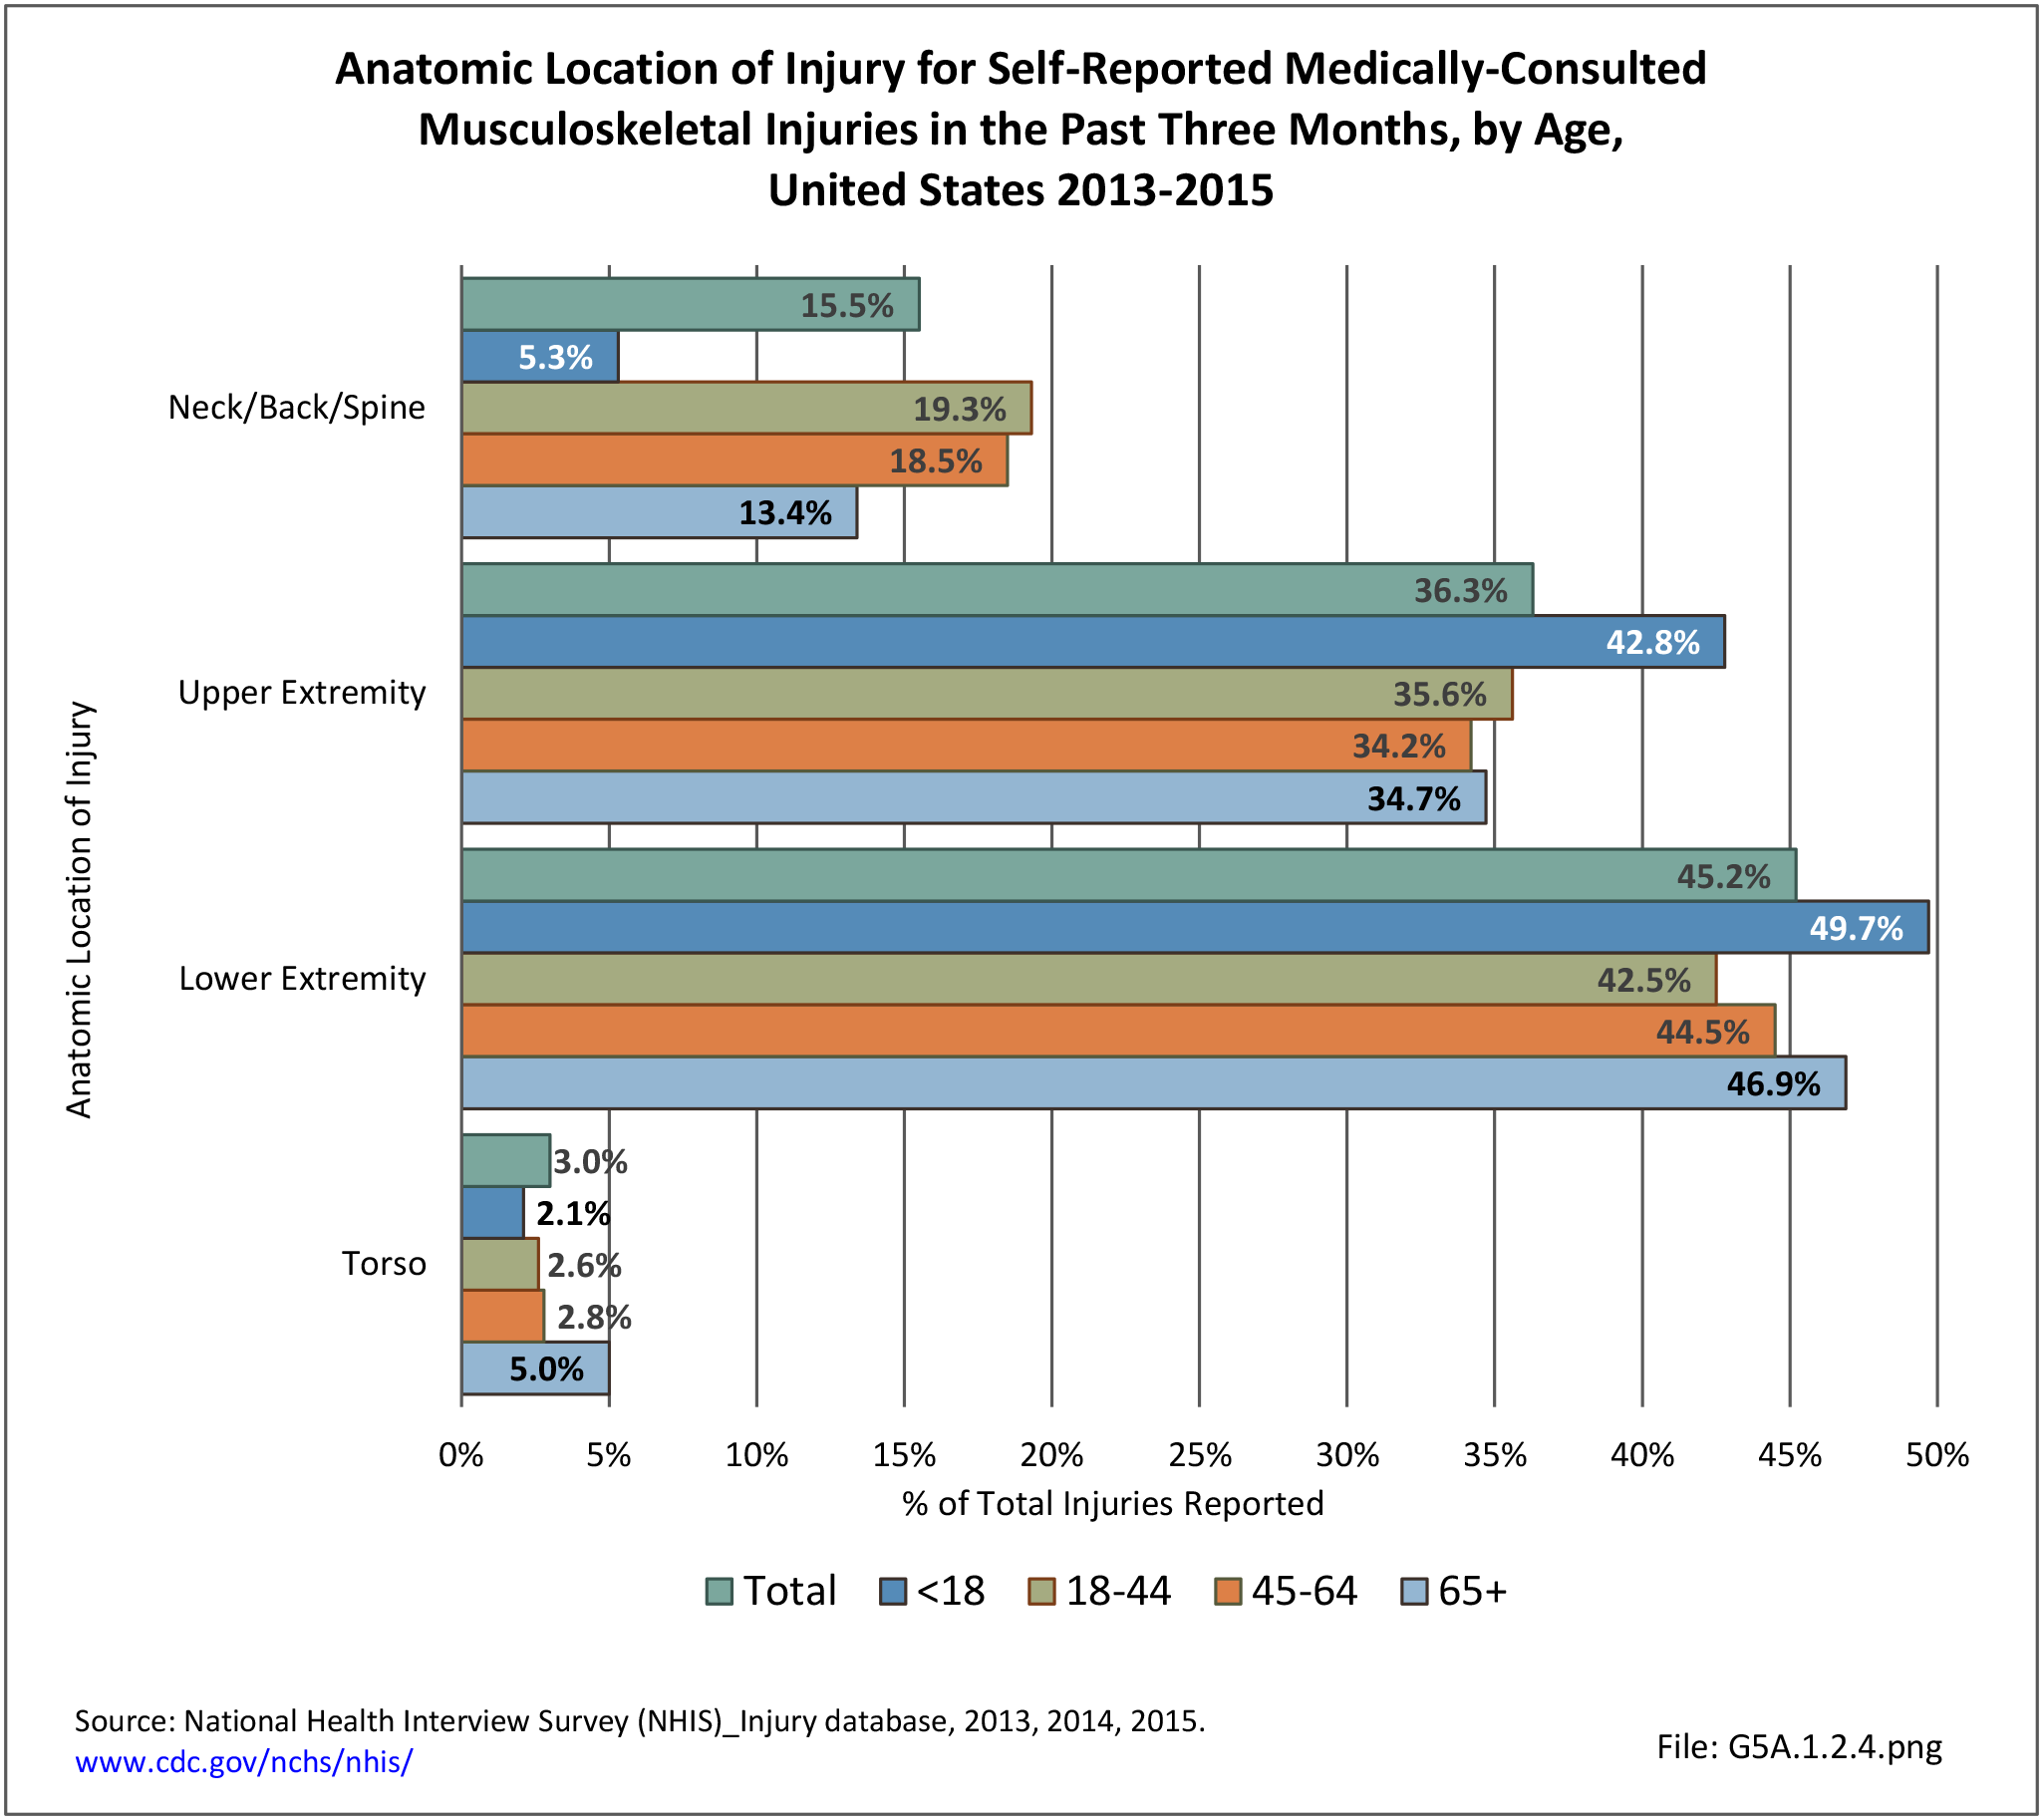
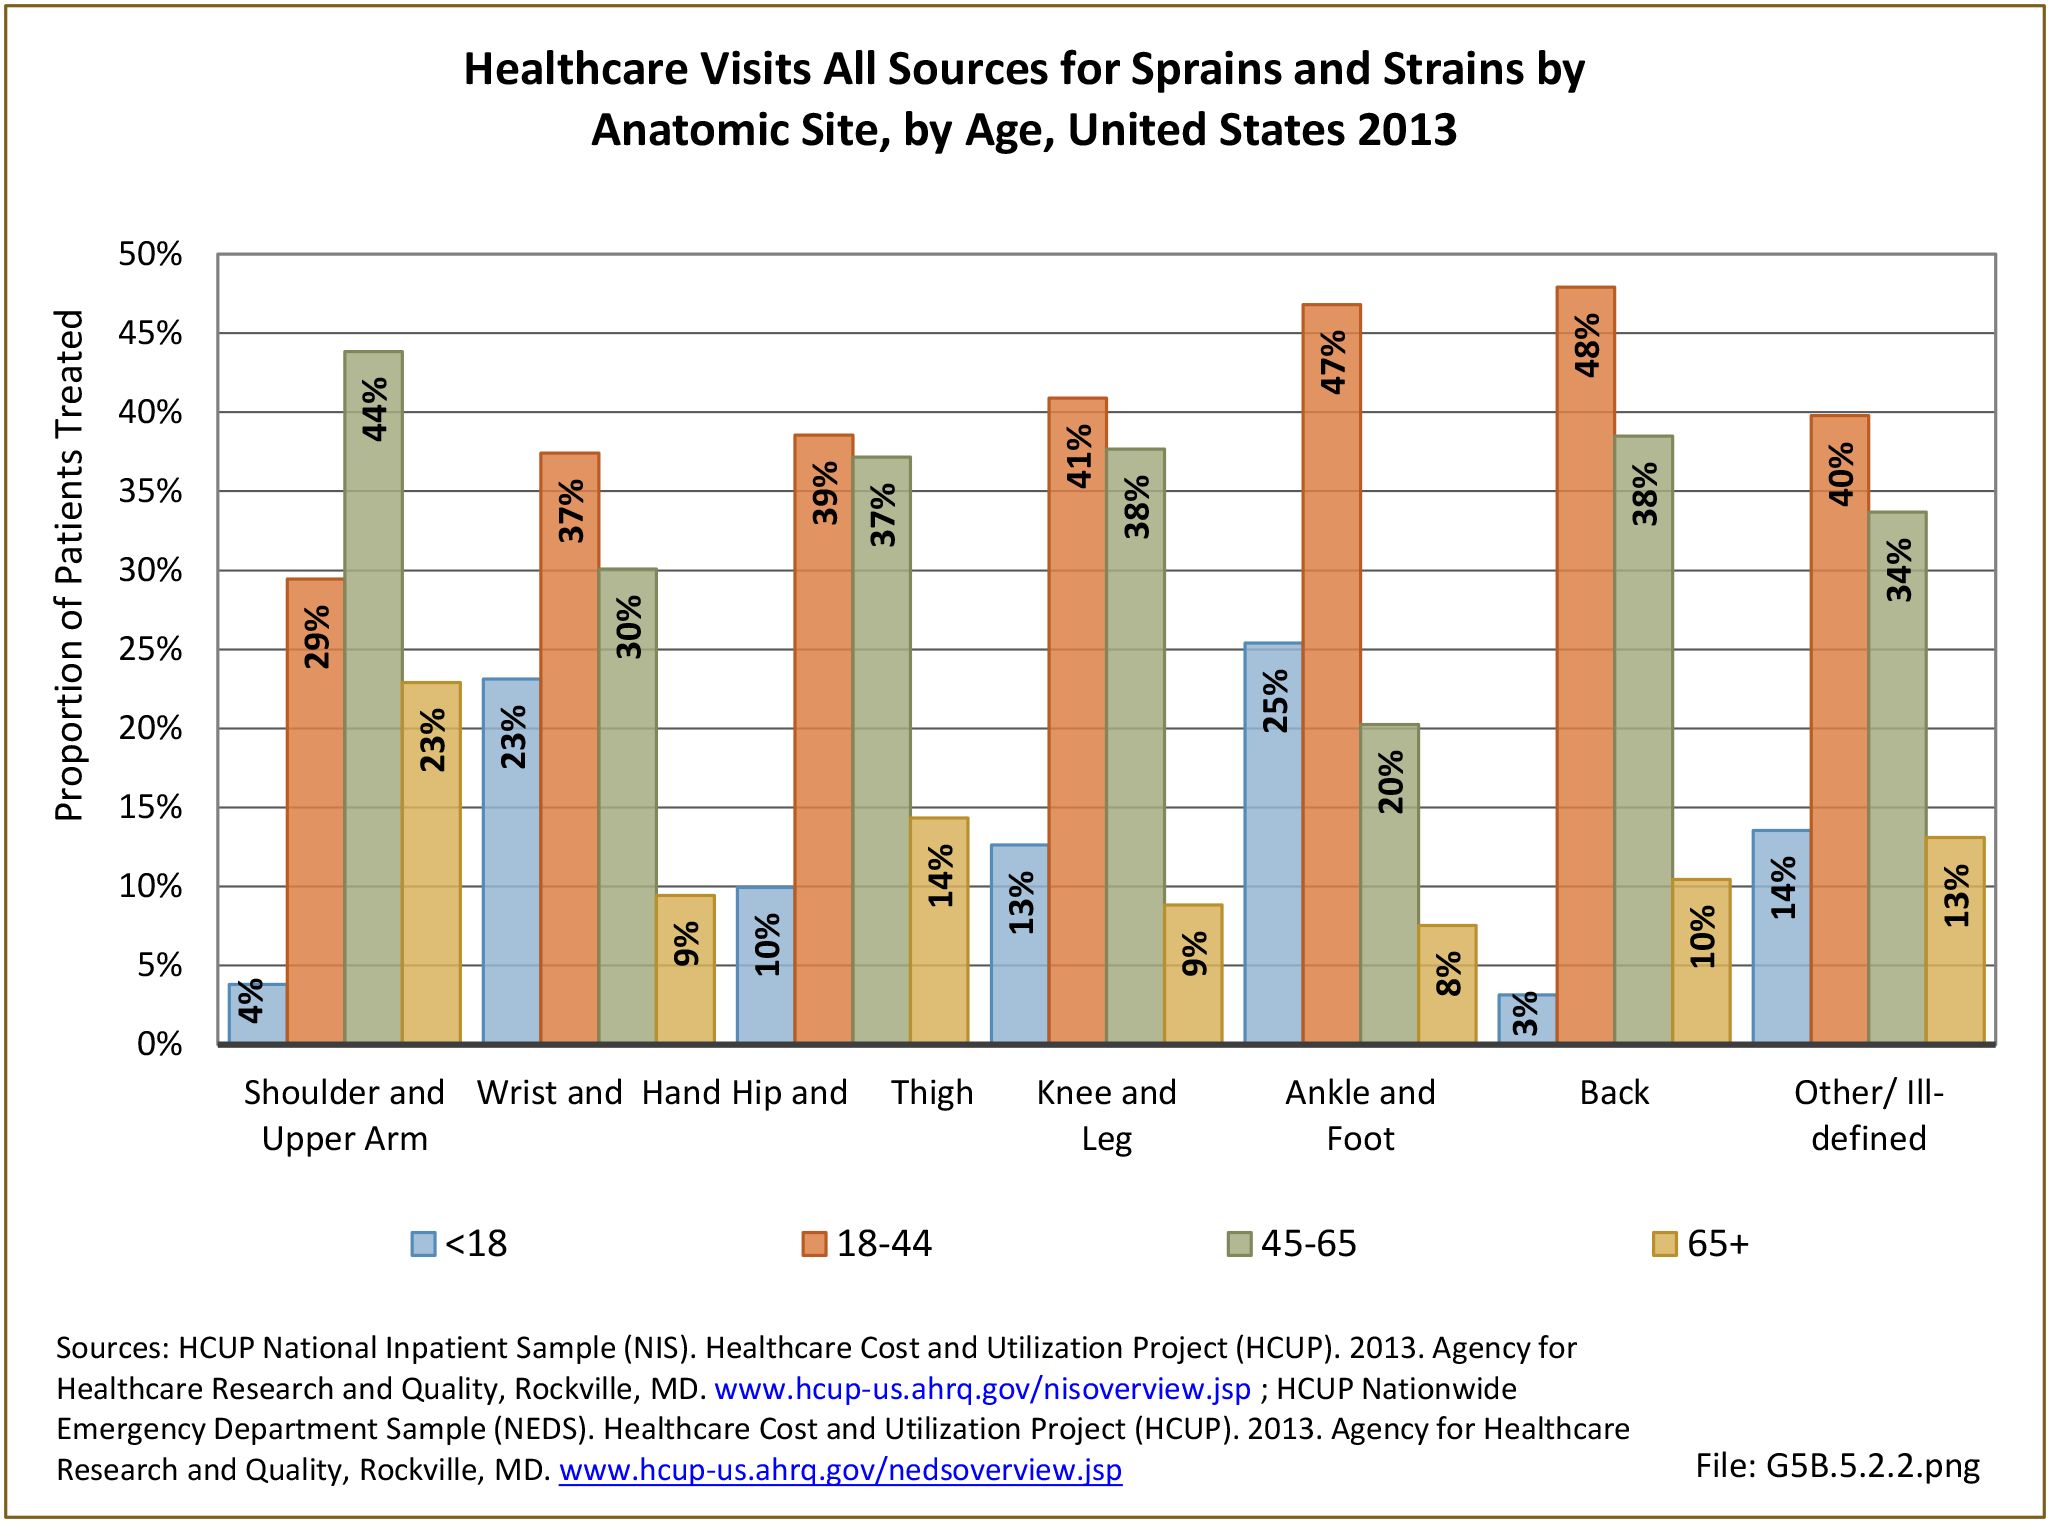
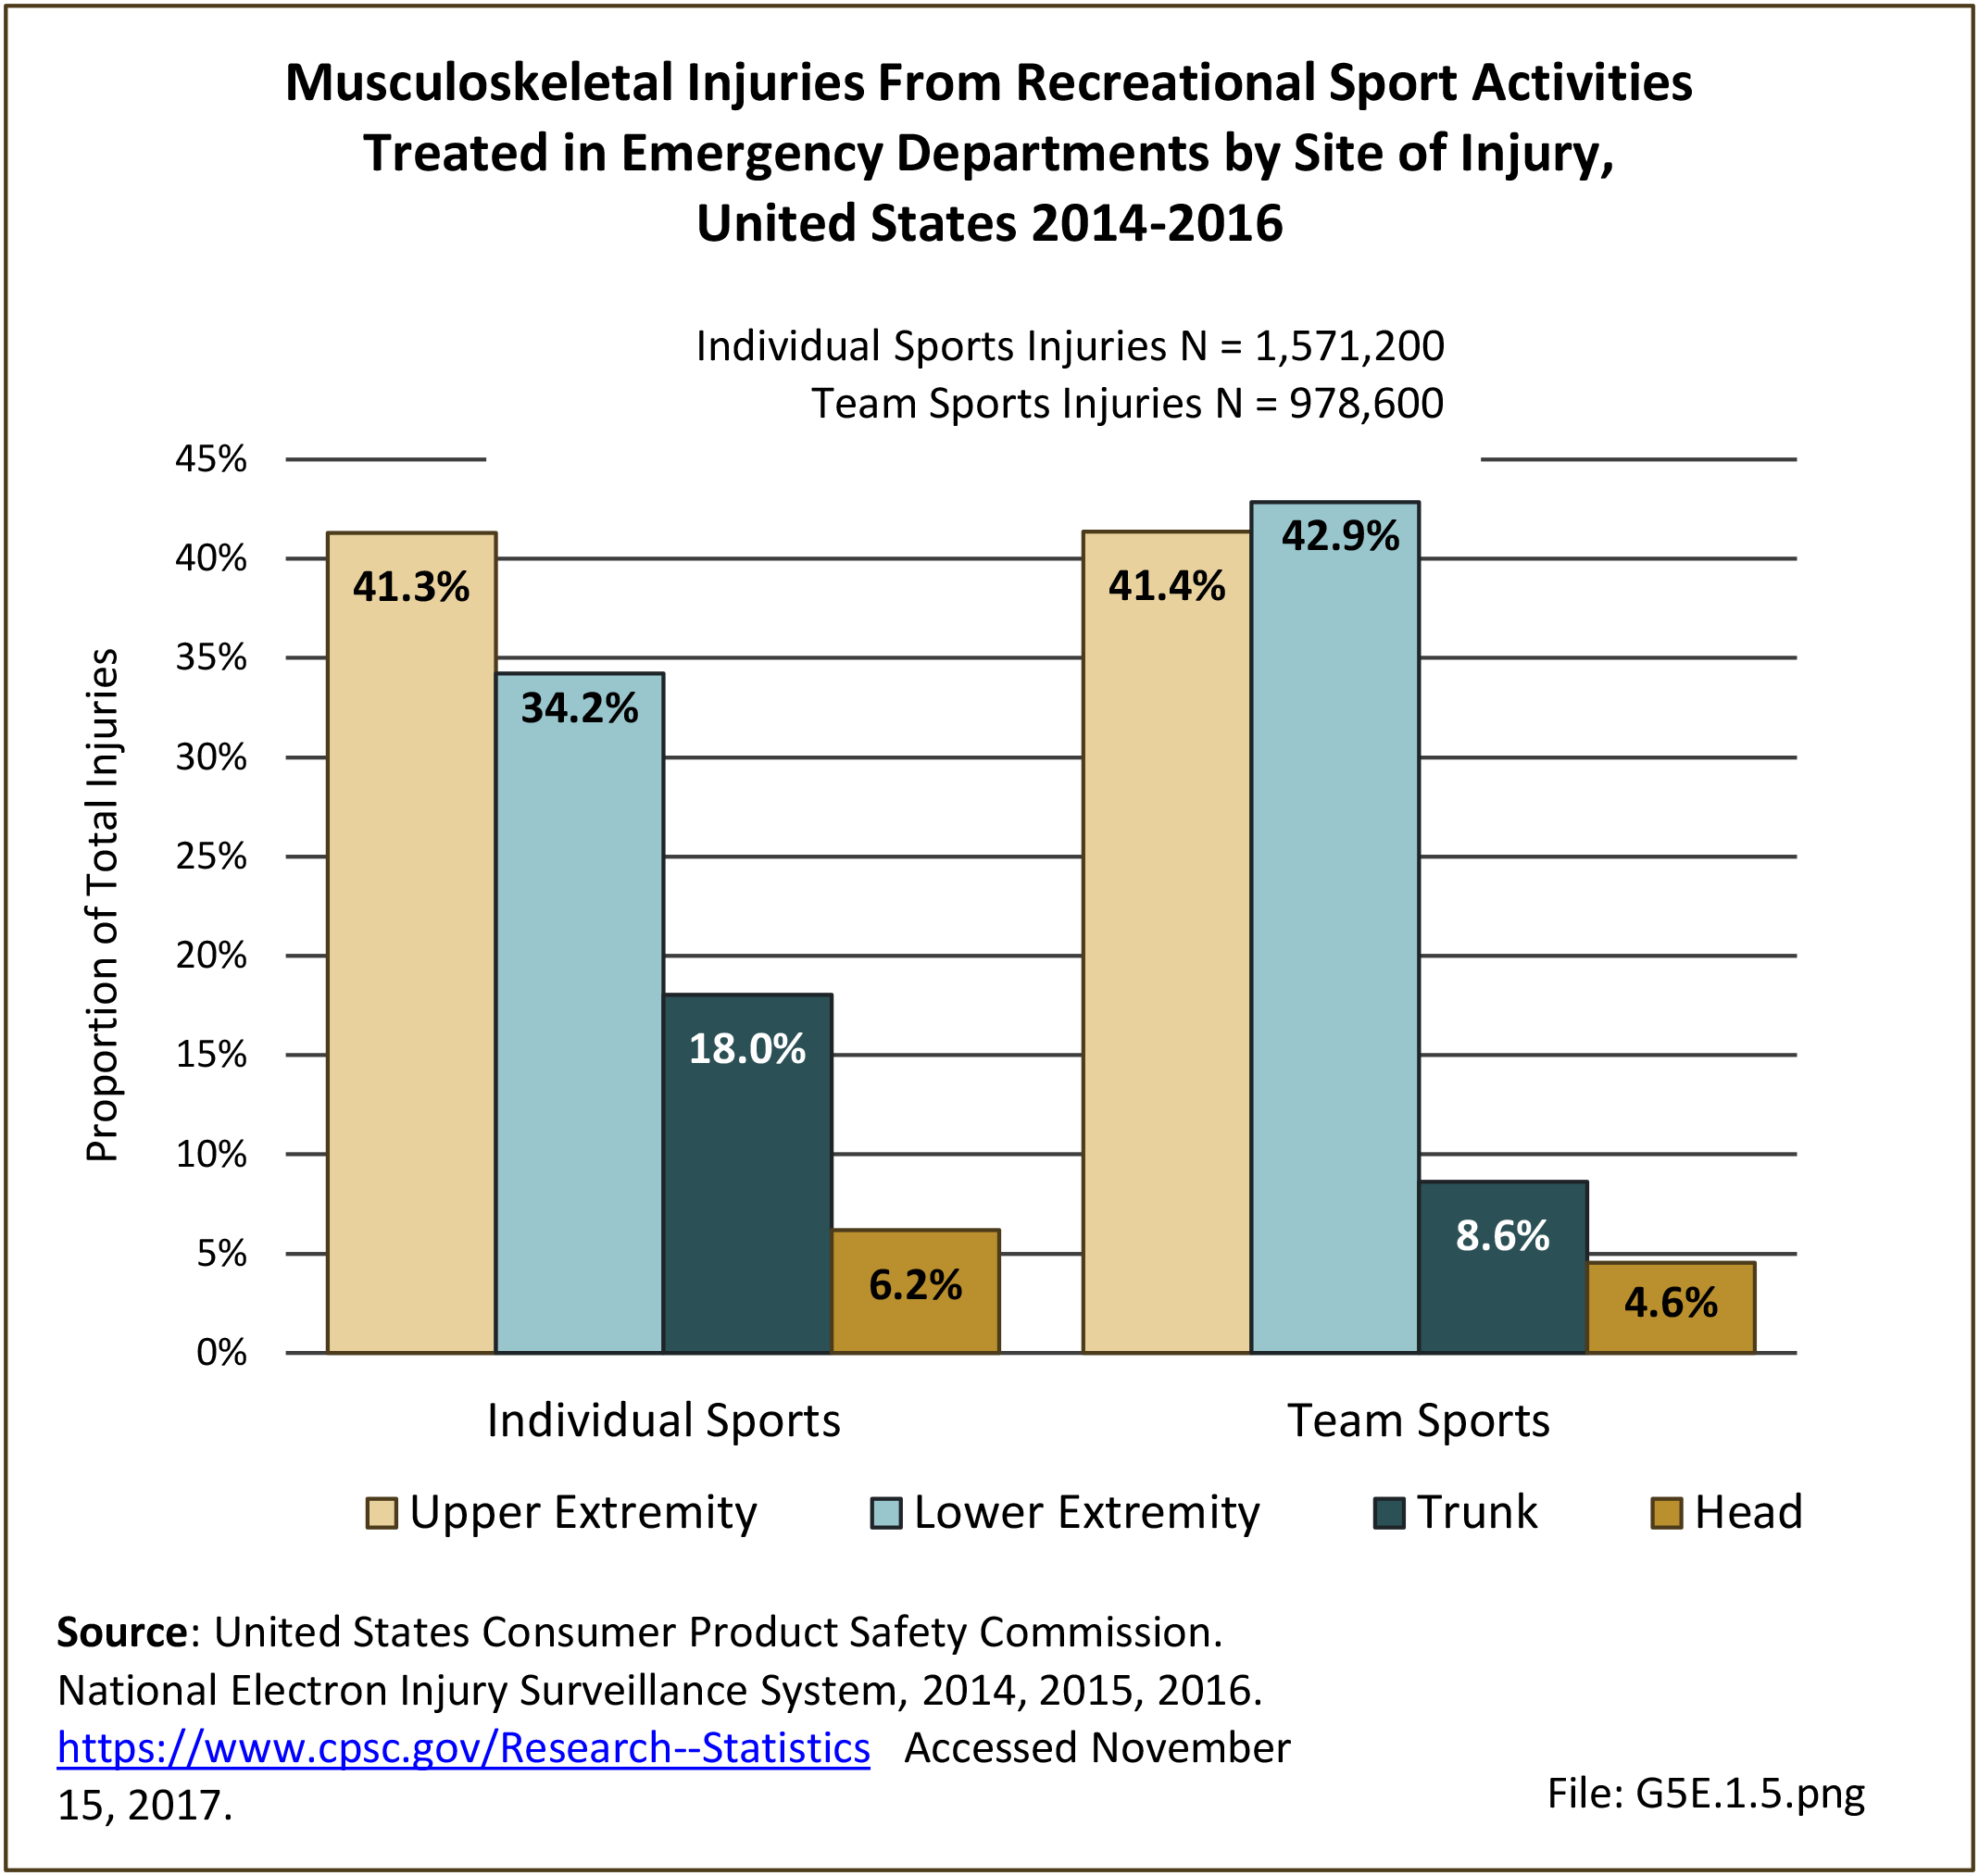
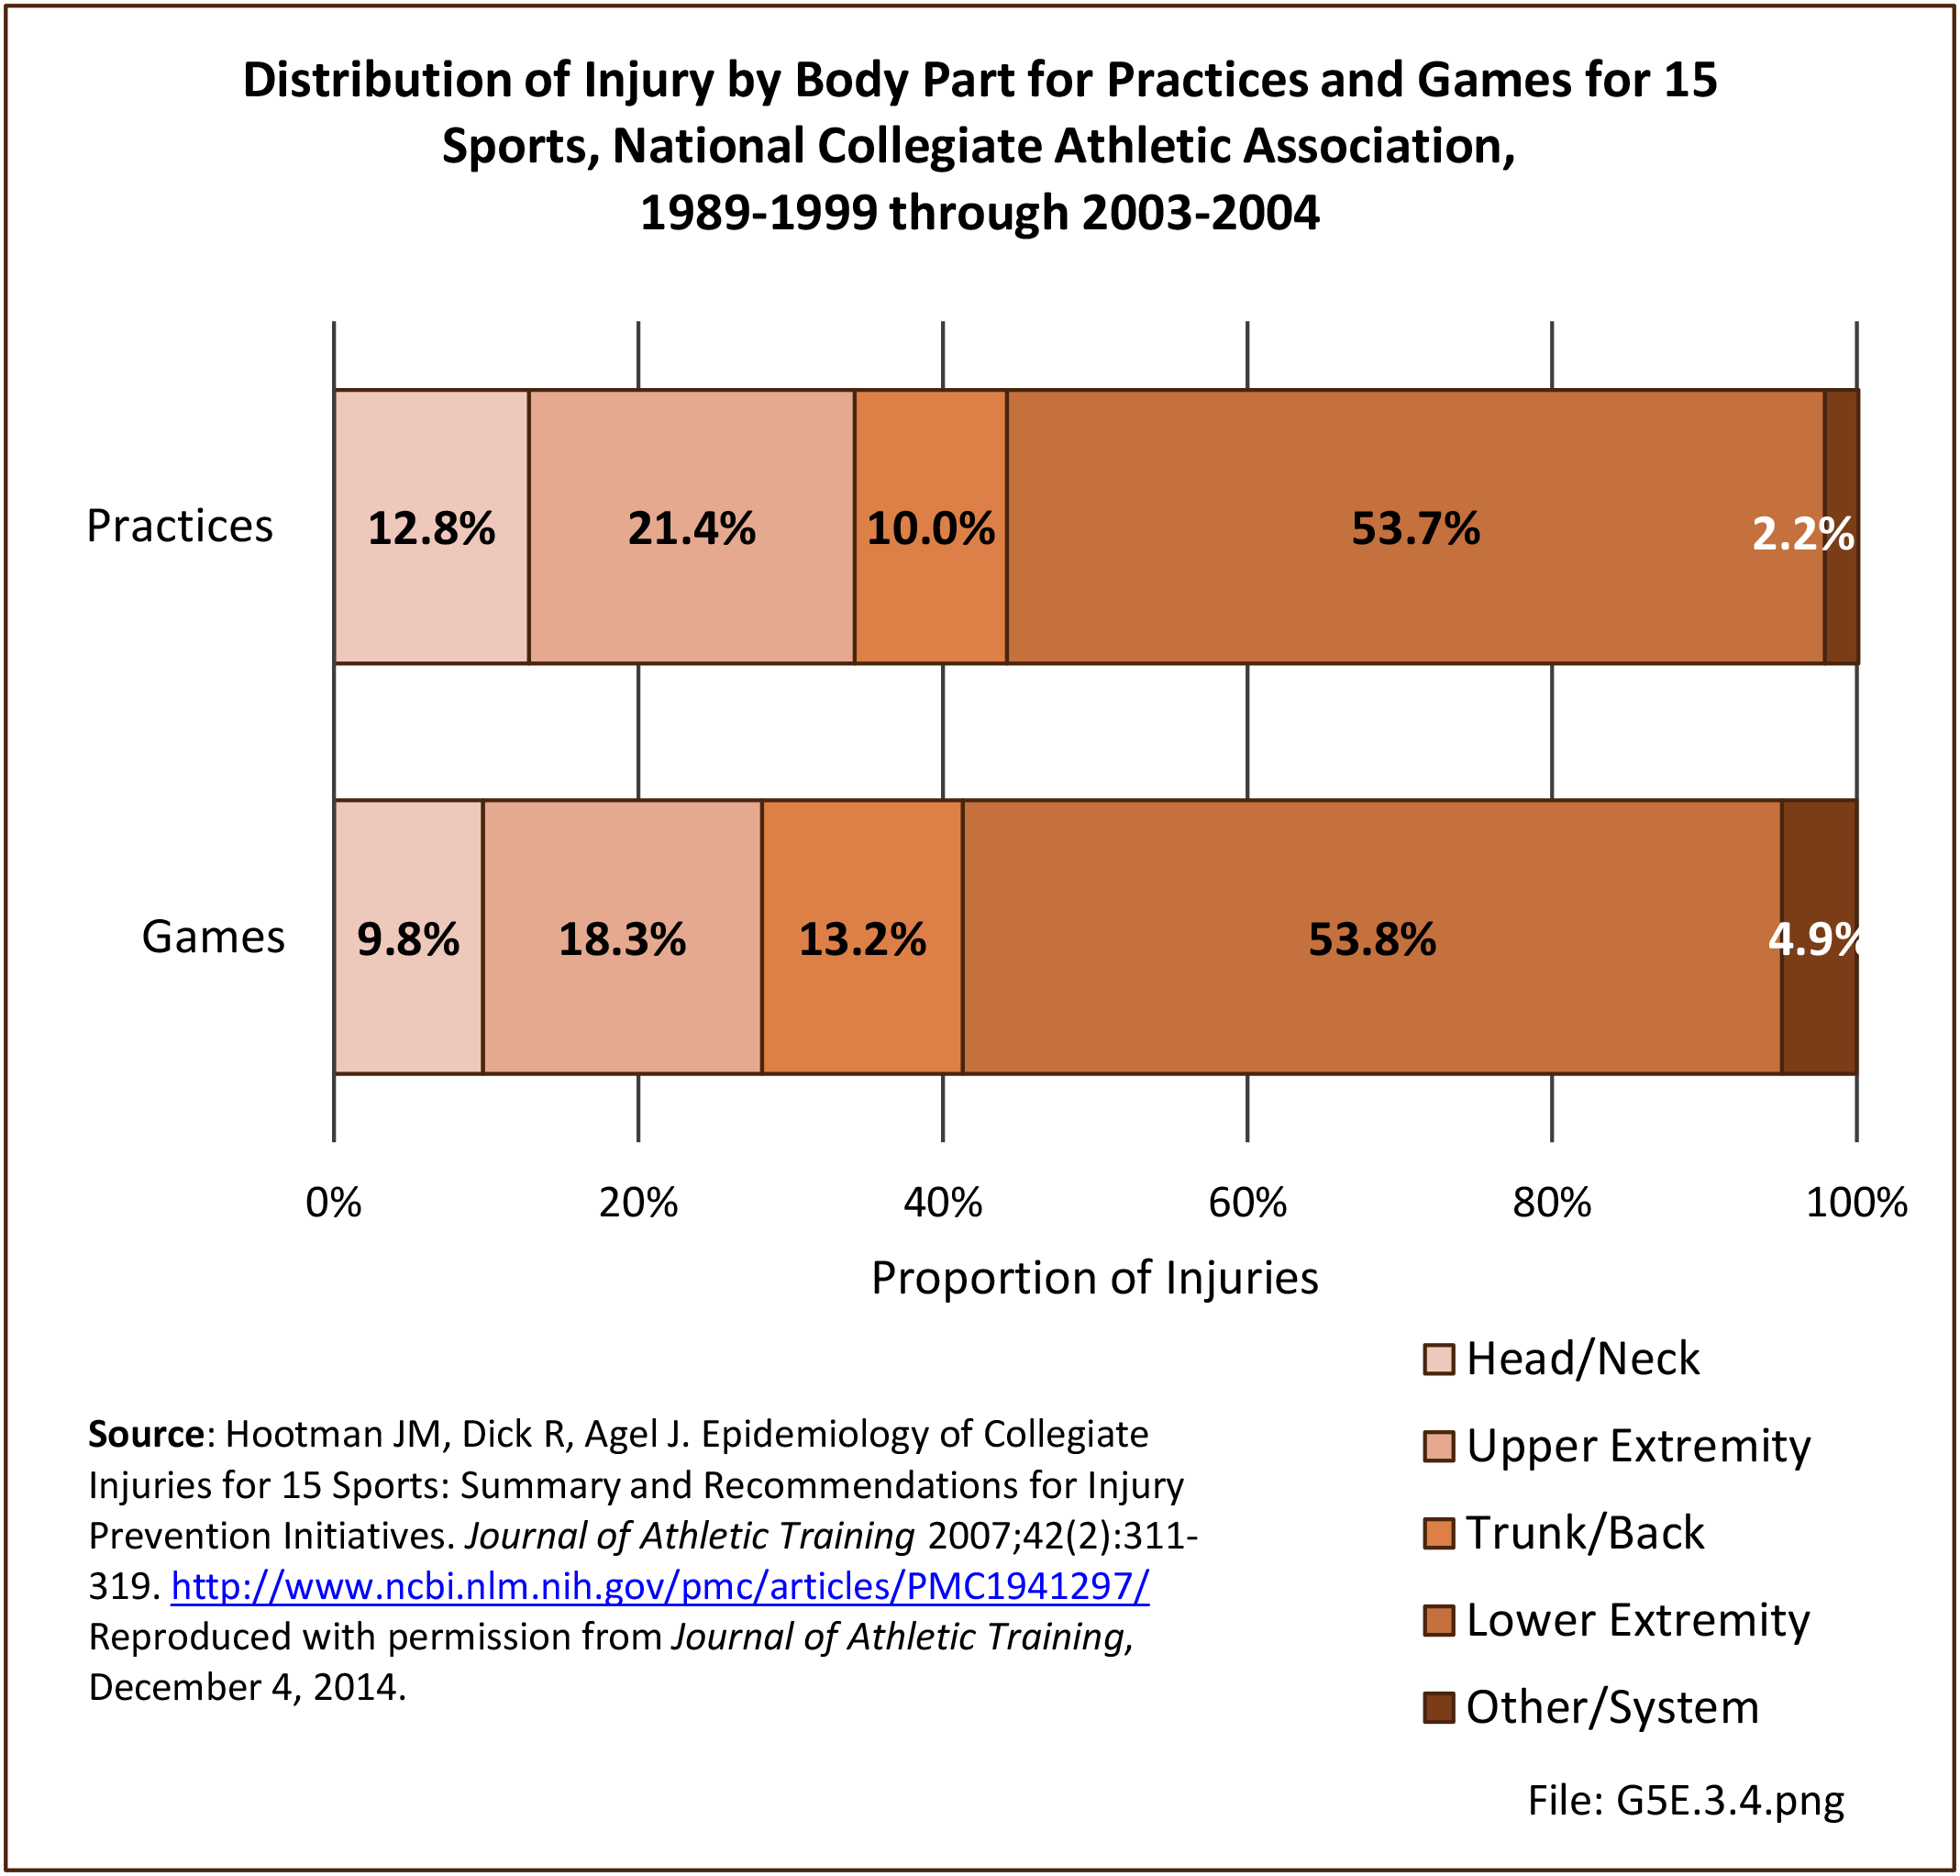
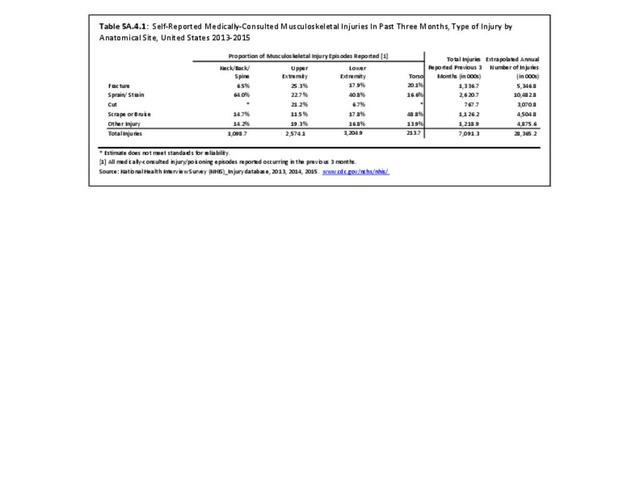
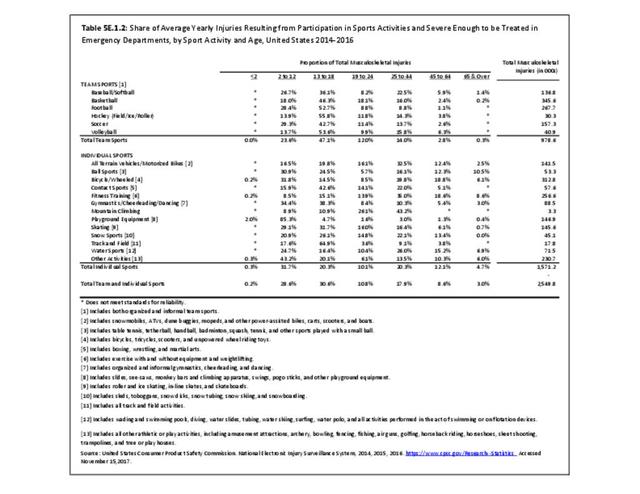
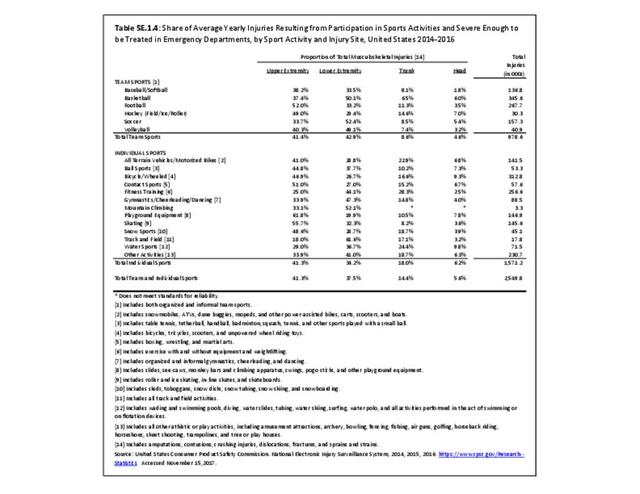
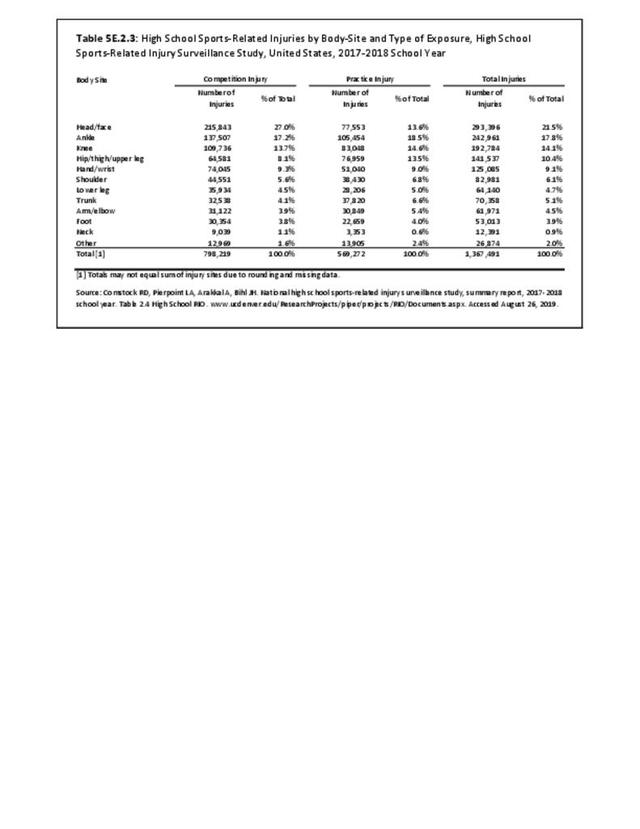
Musculoskeletal injuries occur at numerous different sites throughout the body. On average, between 2012 and 2018, 21% of all injuries were to the head/face, 17.5% impacted the ankle, 14.5% occurred in the knee, 9.5% affected the hip/thigh/upper leg, 7.5% affected the shoulder, 8% were to the hand/wrist, 5% to the trunk, 5% to the lower leg, 4% to the arm/elbow, 4% affected the foot, and 2% of all injuries were to the neck. Injuries categorized as “other” comprised 2% of all injures. The ankle and knee, two of the most injured joints accounted for a combined total of 32% of all musculoskeletal injuries among high school athletes.5 This is consistent with the most recent data available for the 2017-18 academic year.6

Musculoskeletal injuries also account for substantial time loss from playing a sport. On average, between 2012 and 2018, 17% of all injuries resulted in 1-2 days of time loss; 24% resulted in 3-6 days of time loss; 16% resulted in 7-9 days of time loss; 19% resulted in 10-21 days of time loss; and 23% resulted in greater than 21 days of time loss or medical disqualification for the season, medical disqualification for the career, or an injury that did not resolve prior to the end of the season permitting return to play. One in four (24%) resulted in 3-6 days of time loss, which can equate to missing an entire week of practice and games, but nearly as many (23%) injuries resulted in missing 22 or more days or not returning to sport during the same season.7 During the same time period, between 5.3% and 8.2% of injuries annually required surgical intervention to repair.8
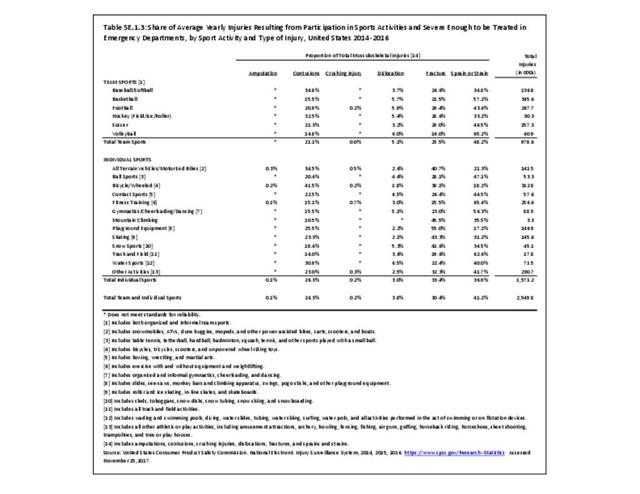
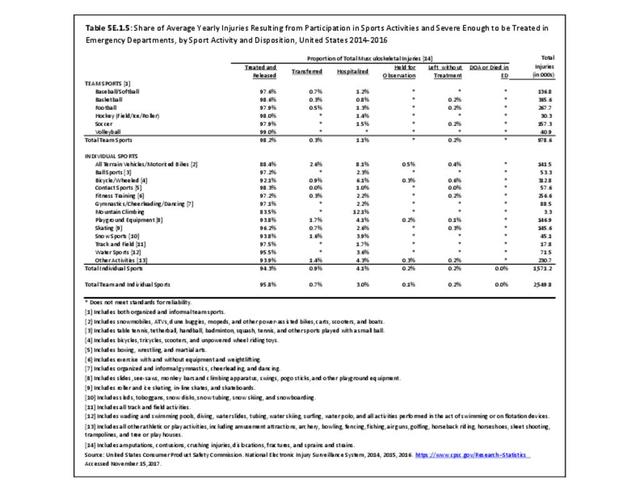
Though nearly 95% of all sports-related injuries seen in emergency departments are treated and released, as noted in the discussion of recreational athletics above, emergency medical system (EMS) transport among high school athletes is relatively uncommon. The overall rate of EMS transport among high school athletes participating in organized sports is 0.29 transports per 10,000 athlete exposures, according to a recent report.9 Nearly 60% of the injuries requiring EMS transport impacted the musculoskeletal system, with the most common injuries including fractures (24%), strains (12%), dislocations (11%), and sprains (10.3%).
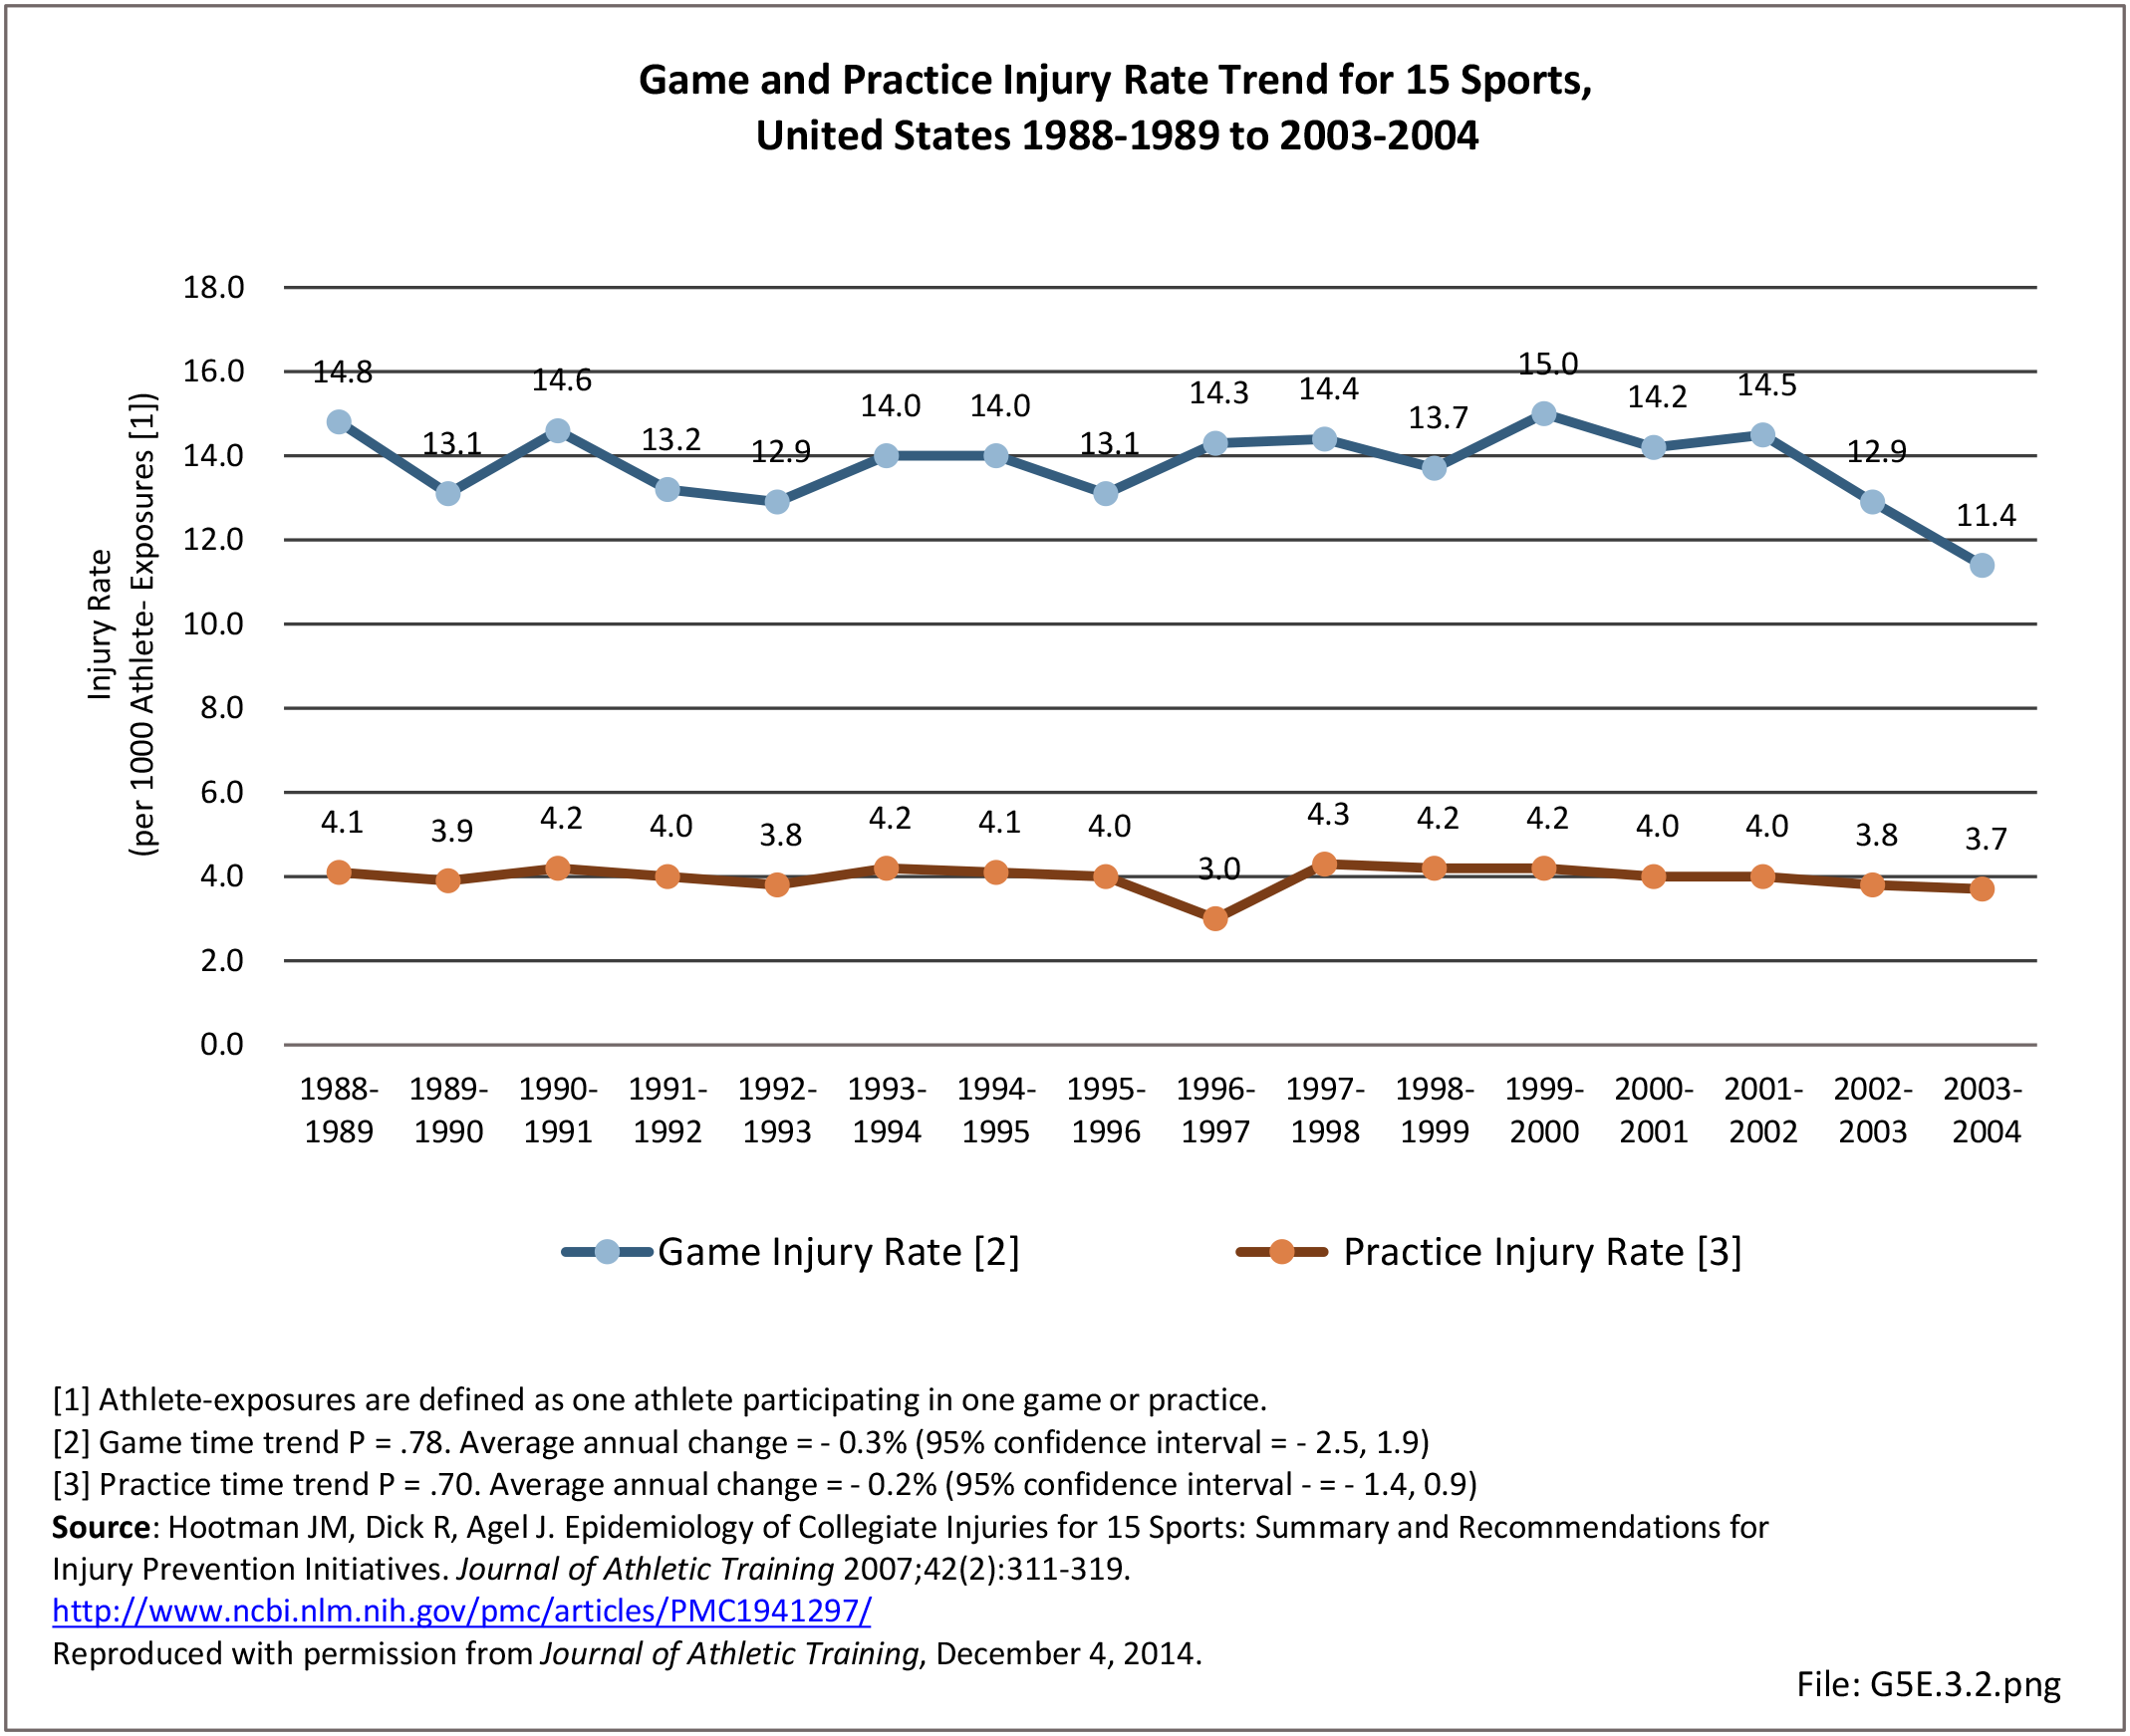
Trends in annual injury incidence rates for high school athletes over time are presented in Graphs 5E.2.3a thru 5E.2.3h and the total annual number of injuries among high school athletes over time based on the RIO data are presented in Graph 5E.2.4. Overall, these data have remained relatively stable between 2005-2006 and 2017-2018. Annual incidence rates over time for specific high school sports during this time period are also presented. Some significant trends have been reported.10 Specifically, there have been statistically significant decreases in the annual injury incidence rate for boys’ high school soccer and basketball during practice sessions; however, there has also been a significant increase in the annual incidence rate for girls’ high school soccer in competitions.


While less data is available on long term health impacts of musculoskeletal injuries in scholastic athletes, one such study by McLeod and colleagues offers insight into the significant impact of athletic injury in this large population.11 The research team studied a convenience sample of 160 uninjured and 45 injured scholastic athletes with health-related quality of life measures. They found significantly lower scores among the injured athletes for the following subscores of the Quality of Life Short Form Questionnaire (SF-36):12 physical functioning, limitations due to health problems, bodily pain, social functioning, and the physical composite score. These findings suggest that physical injuries in our young athletes affect not only their physical function and risk for future musculoskeletal injury and disability, but also extend beyond the physical aspects of overall health. Limited data is available on the long-term health related impact of musculoskeletal injuries experienced by high school athletes.
- 1. Yard EE, Collins CL, Comstock RD. A Comparison of high school sports injury surveillance data reporting by certified athletic trainers and coaches. J Athl Train 2009;44(6):645-652.
- 2. High school sports participation increases for 29th consecutive year. NFHS news; September 11, 2018. https://www.nfhs.org/articles/high-school-sports-participation-increases... Accessed August 26, 2019.
- 3. Comstock RD, Pierpoint LA, Arakkal A, Bihl JH. National high school sports-related injury surveillance study, summary report. High School RIO. www.ucdenver.edu › ResearchProjects › piper › projects › RIO › Documents Accessed August 26, 2019.
- 4. Comstock RD, Pierpoint LA, Arakkal A, Bihl JH. National high school sports-related injury surveillance study, summary report, Table 13.4. High School RIO. www.ucdenver.edu › ResearchProjects › piper › projects › RIO › Documents Accessed August 26, 2019.
- 5. Comstock RD, Pierpoint LA, Arakkal A, Bihl JH. National high school sports-related injury surveillance study, summary report, Table 13.3. High School RIO. www.ucdenver.edu › ResearchProjects › piper › projects › RIO › Documents Accessed August 26, 2019.
- 6. Comstock RD, Pierpoint LA, Arakkal A, Bihl JH. National high school sports-related injury surveillance study, summary report, Table 2.4. High School RIO. www.ucdenver.edu › ResearchProjects › piper › projects › RIO › Documents Accessed August 26, 2019.
- 7. Comstock RD, Pierpoint LA, Arakkal A, Bihl JH. National high school sports-related injury surveillance study, summary report, Table 13.6. High School RIO. www.ucdenver.edu › ResearchProjects › piper › projects › RIO › Documents Accessed August 26, 2019.
- 8. Comstock RD, Pierpoint LA, Arakkal A, Bihl JH. National high school sports-related injury surveillance study, summary report, Table 13.7. High School RIO. www.ucdenver.edu › ResearchProjects › piper › projects › RIO › Documents Accessed August 26, 2019.
- 9. Hirschhorn RM, Kerr ZY, Wasserman EB, et al, Epidemiology of injuries requiring emergency transport among collegiate and high school student-athletes. J Athl Train, 2018;53(9):906-914
- 10. Comstock RD, Pierpoint LA, Arakkal A, Bihl JH. Summary Report National High School Sports-related injury surveillance study 2017-18 school year. http://www.ucdenver.edu/academics/colleges/PublicHealth/research/Researc... Accessed August 2, 2019.
- 11. McLeod TCV, Bay RC, Parsons JT, et al. Recent injury and health-related quality of life in adolescent athletes. J Athl Train. Nov-Dec 2009;44(6):603-610.
- 12. The SF-36 is a widely used measurement in health to determine quality of life based on eight scales; physical functioning, role-physical, bodily pain, general health, vitality, social functioning, role-emotional, and mental health. Two summary measurements, physical health and mental health, are also calculated.
Edition:
- Fourth Edition