The site is best viewed using Google Chrome, Firefox or Safari. Internet Explorer does not provide full functionality.
Topics are listed on the left-hand side of the screen. Each contains sub-sections, including a listing of the ICD and/or CPT codes used to select and analyze pertinent data.
Topic Content pages contain text, Graphs, and links to Tables. There are various options available for saving and printing sections. Print results depend on the browser you are using.
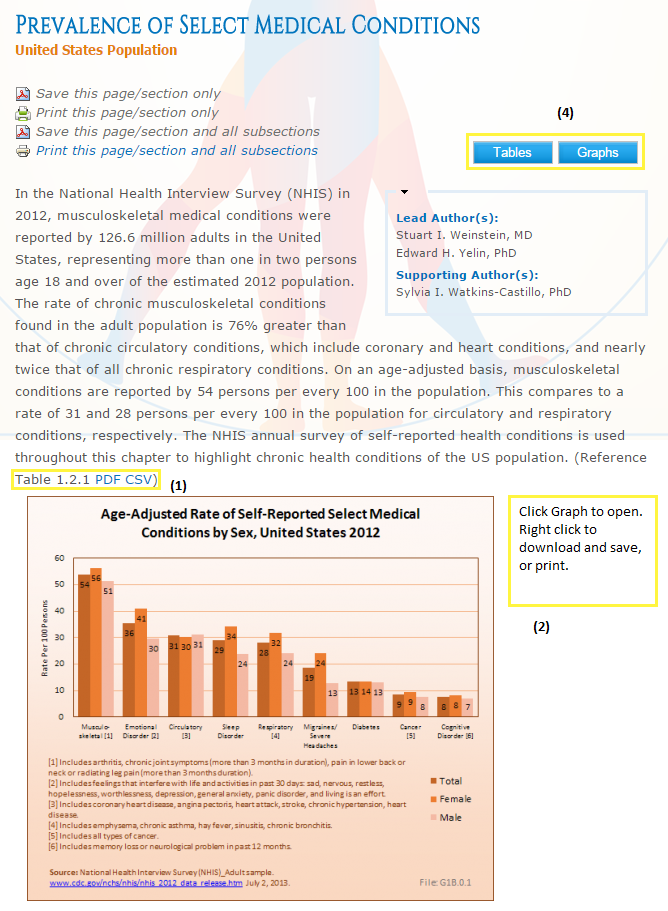
(1) As Tables are referenced in the text, links are provided to enable you to download them as a PDF file, or as a CSV/Excel file, and these will open in new windows. How the CSV/Excel file opens will depend on the browser you are using. For example, look to the bottom left of your screen if opening using Google Chrome.
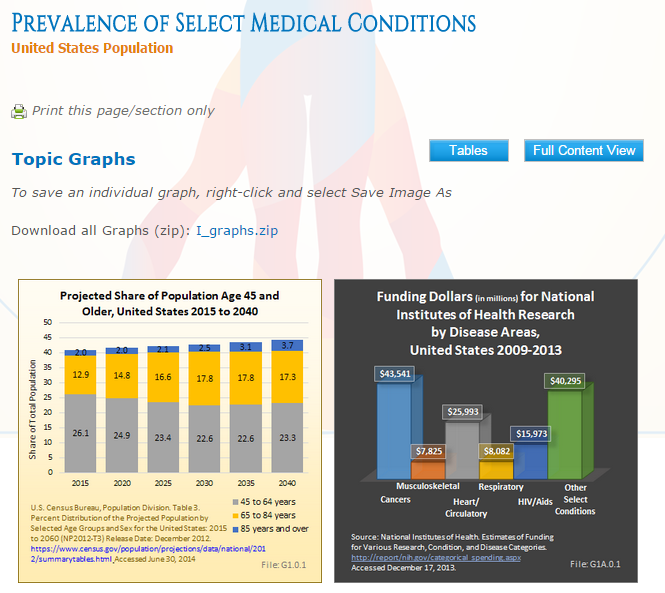
(2) Graphs are displayed throughout the Content view. Every Graph contains a reference number in its bottom right-hand corner.
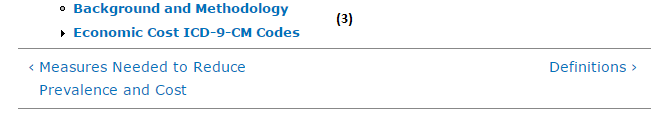
(3) At the bottom of each topic are links to further sub-topics. A circle/dot next to the left of the section name indicates there are no further sub-sections to that section. A solid black arrow to the left of the section name indicates that section contains further sub-sections. Below these section headers are left and right arrow indicators that will take you to the previous or next section of the one you are viewing.
(4) All the Tables in a section can be viewed by clicking on the blue button named “Tables” (top right above text).
In the Tables-only view, arrived at by clicking on the blue button noted above, Tables are displayed in a string, and each can be opened by clicking on it. Above each Table are links to allow you to open, download, or print them. A Zip file is provided to permit you to download all Tables in a section. Click on the “Full Content View” to return to the Topic.
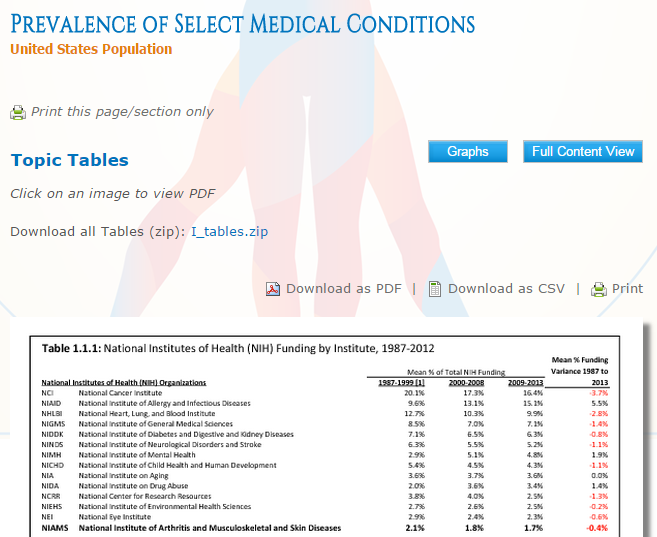
From the Full Content View, all the Graphs in a section can be viewed by clicking on the blue button named “Graphs” ④ (top right above text in Content view). Graphs are displayed in two columns, and each can be opened by clicking on it, or by right-clicking it to create a hyperlink to it, to save it as a .png image for use elsewhere such as in presentations, or to print it. A Zip file is provided to permit you to download all Graphs in a section. Click on the “Full Content View” to return to the Topic.
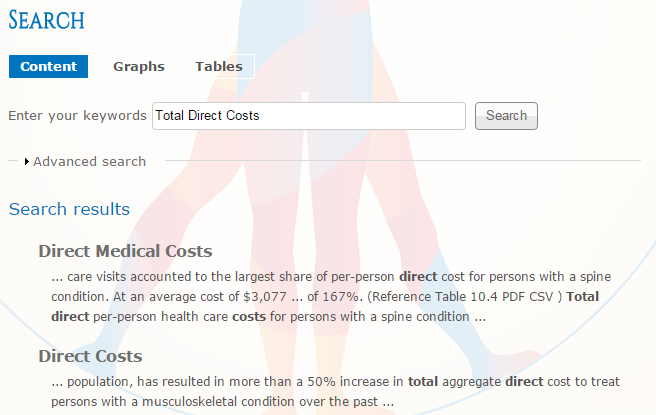
The Search field is located in the top-left corner of the screen. After typing in key words you will be provided with all mentions of those words in the Full Content, in Graphs, and in Tables. A blue button above the results will indicate which of these is currently displaying. Click on either of the other two to select that option. For example if “Content” is displaying, click on Graphs, or Tables if you wish to view those results. Under the words “Search results” in blue, click on the header for each result to open that mention of the key words you have chosen.
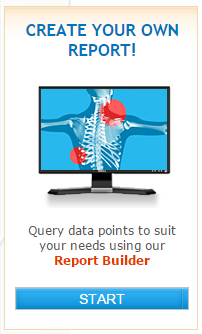
The interactive Report Builder allows you to run your own tailored query on ICD and CPT codes from some of the databases used to produce BMUS. The ICD and CPT codes are those used by BMUS and are displayed at the top of each report. After selecting an option, you are able to apply a number of filters. Access to the Report Builder is provided on the right-hand side of the screen. Click on Start to access the Report Builder. A 6-step Quick Tool in the top right-hand corner of the screen enables you to see how to use the Report Builder. The latest data from each of the data sources uploaded will be updated as new data becomes available.
Please do not forget to cite BMUS if you are reproducing the content from the website. The recommended Citation is provided in the About Us section, or from a link at the bottom of the screen.


