Diagnoses
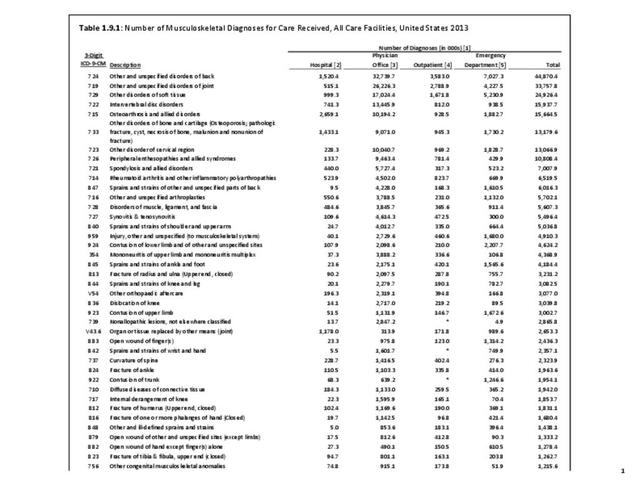
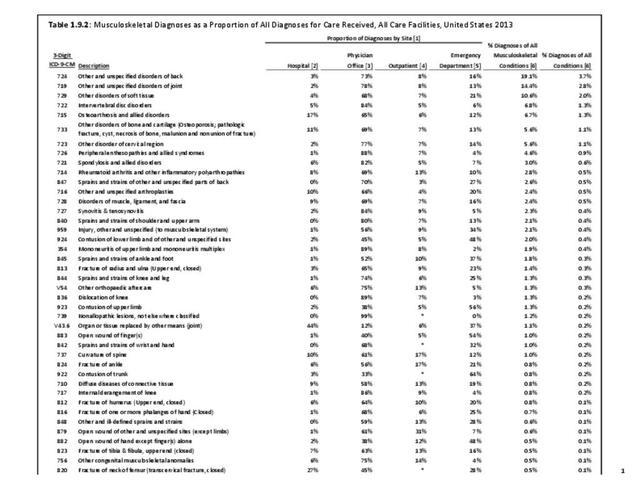
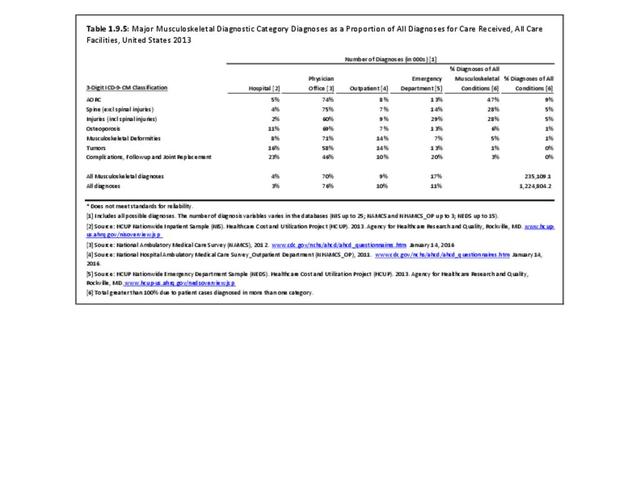
Musculoskeletal diagnoses accounted for 19.2%, or 235.1 million, of the 1.225 billion medical diagnoses included in hospital discharge records, emergency department and outpatient clinic visits, and physician office visits in the United States in 2013. Seven in ten of the discharges/visits were to a physician’s office, but musculoskeletal visits as a share of total healthcare visits were highest for hospital discharges (29.6%) and emergency department visits (28.9%). (Reference Table 1.9.1 PDF CSV and Table 1.9.2 PDF CSV)

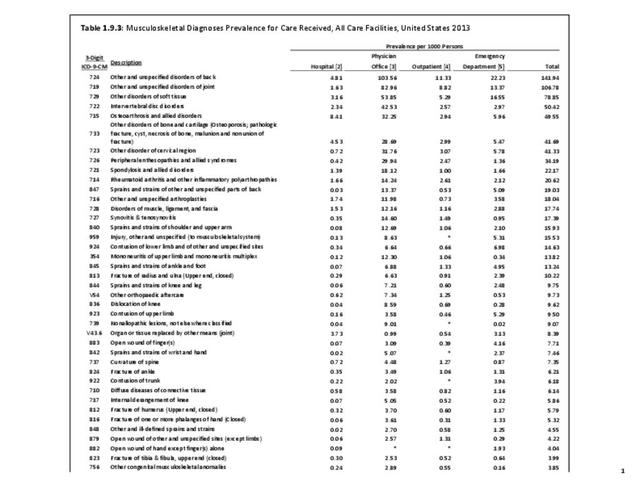
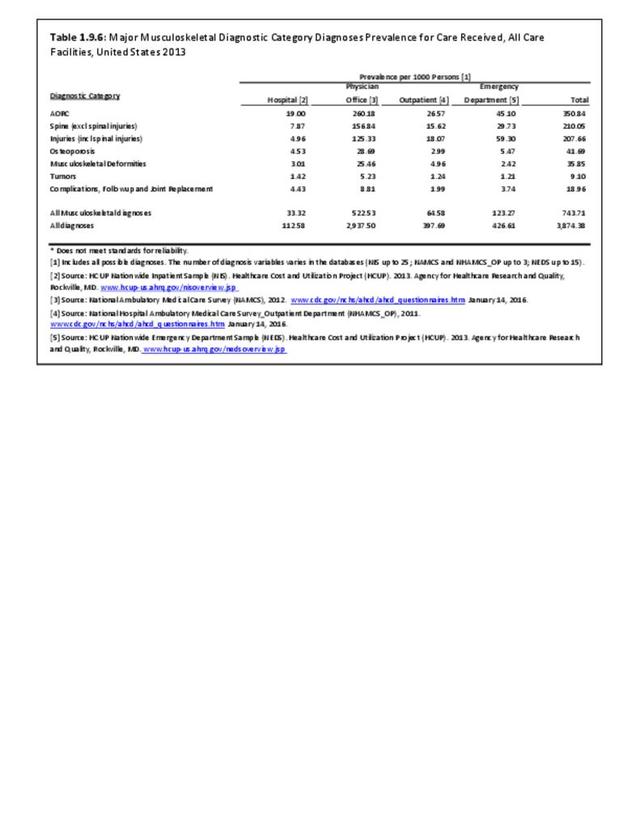
On average, each person in the United States received medical care for four diagnoses during 2013, or 3,874 diagnoses per a population of 1,000. Of these, 747 diagnoses were for musculoskeletal conditions, indicating that seven in ten persons had a healthcare discharge or visit related to a musculoskeletal disease. The most common musculoskeletal diagnoses are "other and unspecified disorders of the back" and "other and unspecified disorders of joints," with 141.9 and 106.8 diagnoses per 1,000 persons, respectively. Of the more specific diagnoses, disc disorders (50.4/1000), osteoarthrosis and allied disorders (49.6/1000) spondylosis and allied disorders (22.2/1000) were the most common. (Reference Table 1.9.3 PDF CSV)
The majority of all diagnoses and musculoskeletal diagnoses are made in a physician office. However, hospital discharges and emergency department visits are seen more frequently for musculoskeletal conditions than for health care visits for all conditions overall. (Reference Table 1.9.2 PDF CSV)

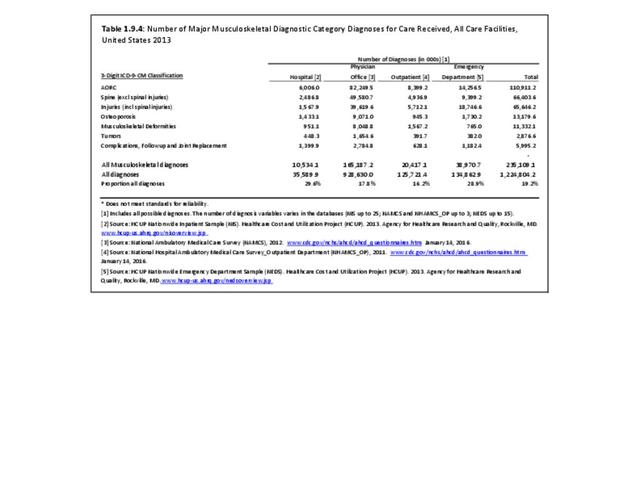
Among the major diagnostic categories of musculoskeletal diagnoses, Arthritis and Other Rheumatic Conditions (AORC) accounted for nearly half the musculoskeletal related visits at a rate of 350.8/1000. Spine and injuries each accounted for just over one in five visits (210.1/1000 and 207.7/1000, respectively). Although the remaining musculoskeletal disease diagnostic categories represent much smaller shares of visits and impact fewer persons, they remain a major cause for pain and disability. (Reference Table 1.9.6 PDF CSV)

Procedures
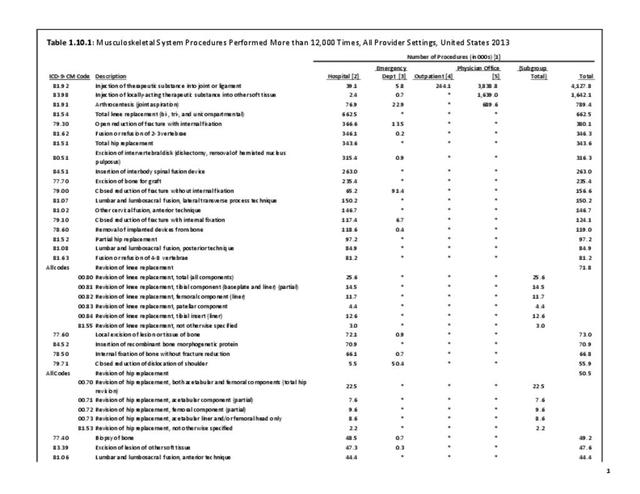
Musculoskeletal procedures comprised only slightly more than 1% of all medical procedures performed in hospitals, outpatient clinics, emergency departments, and physician offices in 2013. However, 62 musculoskeletal procedures were performed more than 12,000 times each. The top two procedures, together performed nearly 5.8 million times, are the injection of a therapeutic substance into a joint or ligament and into soft tissue. The third most frequently performed musculoskeletal procedure, performed nearly 800,000 times in 2013, was arthrocentesis, the removal of fluid from a joint. All three are routinely performed in a physician’s office. Joint replacement procedures ranked 4th (total knee), 7th (total hip), 16th (partial hip), and 19th (revision knee replacement), all of which are projected to increase dramatically by 2030, particularly by persons under the age of 65.1 Reduction of fractures and spinal fusion procedures rounded out the remaining top 20 procedures. These procedures are primarily performed in a hospital. (Reference Table 1.10.1 PDF CSV)
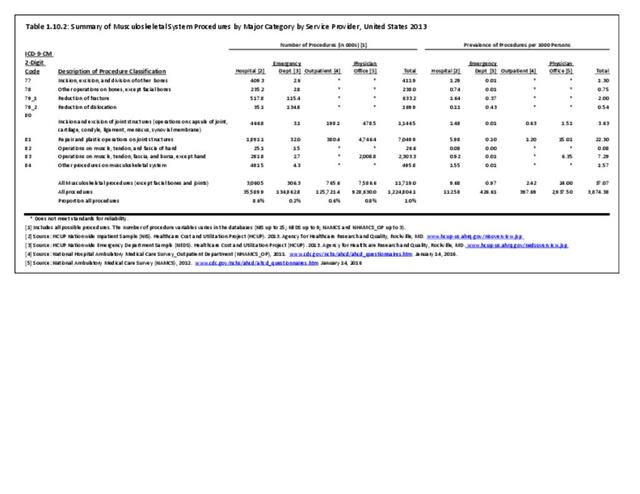
Looking at musculoskeletal procedures by major groups (2-digit ICD-9-CM codes), 60% of procedures belong to the repair and plastic operations on joint structures (81). This group includes joint replacement and spinal fusion procedures, both among the most frequent procedures performed, as well as injections of therapeutic substance into joint or ligament, the most frequent musculoskeletal procedure performed. Operations on muscle, tendon, fascia, and bursa comprise 10% of all musculoskeletal procedures performed. This category (83) includes the second most frequent procedure, injection of locally-acting therapeutic substance into other soft tissue. (Reference Table 1.10.2 PDF CSV)

- 1. Kurtz SM, Lau E, Ong K, et. al. Future young patient demand for primary and revision joint replacement: national projections from 2010 to 2030. Clin Orthop Relat Res 2009;467(10):2606-2612.
Edition:
- Fourth Edition