Athletic participation by children and adolescents increased dramatically between 1997 and 2008,1 with participation declining slightly since the 2008 peak.2 Over the past several years, participation in some sporting activity has slowly increased with 69% of children playing a sport at least one day during the year in 2017. However, team sports participation regularly continues to slowly decline with only 37% of children consistently participating in a team sport.3
Since the late 1990s, athletic specialization has increased, resulting in earlier focus on single sports. As a result, there has been a commensurate increase in pediatric sports-related injuries, both acute and related to chronic overuse.4 Pediatric and adolescent athletes are anatomically and physiologically different from adult athletes, and therefore are at risk to sustain different injuries. Coordination and mechanics are less developed in pediatric athletes, placing them at greater risk for injuries related to falls and collisions. Growing athletes are at risk for most of the same injuries as adult athletes but are uniquely susceptible to injuries about the physeal (growth plates in bones that undergo endochondral ossification) and growth cartilage. Not only do these physeal and apophyseal injuries5 require unique treatments, but they may also result in growth derangement that can lead to deformity and have long-term consequences. Adolescent female athletes also have been shown to have a two- to nine-fold greater risk of knee injuries, which may be related to age and gender-specific differences in anatomy, neuromuscular control, and hormone levels.6 Common pediatric sports-related injuries include anterior cruciate ligament (ACL) and meniscal tears, tibial eminence fractures, osteochondritis desiccans lesions, patellofemoral instability, Osgood Schlatter syndrome, little league shoulder and elbow, pelvic avulsion fractures, and distal radius epiphysitis.
Prevalence
On average across the years from 2014 to 2016, 1.6 million injuries per year related to team or individual sport activities occurred to children and adolescents age 20 years and younger. Data reported is from consumer product-related injuries occurring in the United States from a statistically valid sample of emergency departments collected by the United States Consumer Product Safety Commission, National Electronic Injury Surveillance System. Data shown for sports injuries are not included in the overall total for musculoskeletal conditions among children and adolescents, on the assumption it duplicates numbers found in the emergency department database based on ICD-9-CM codes and used in the trauma injuries section.

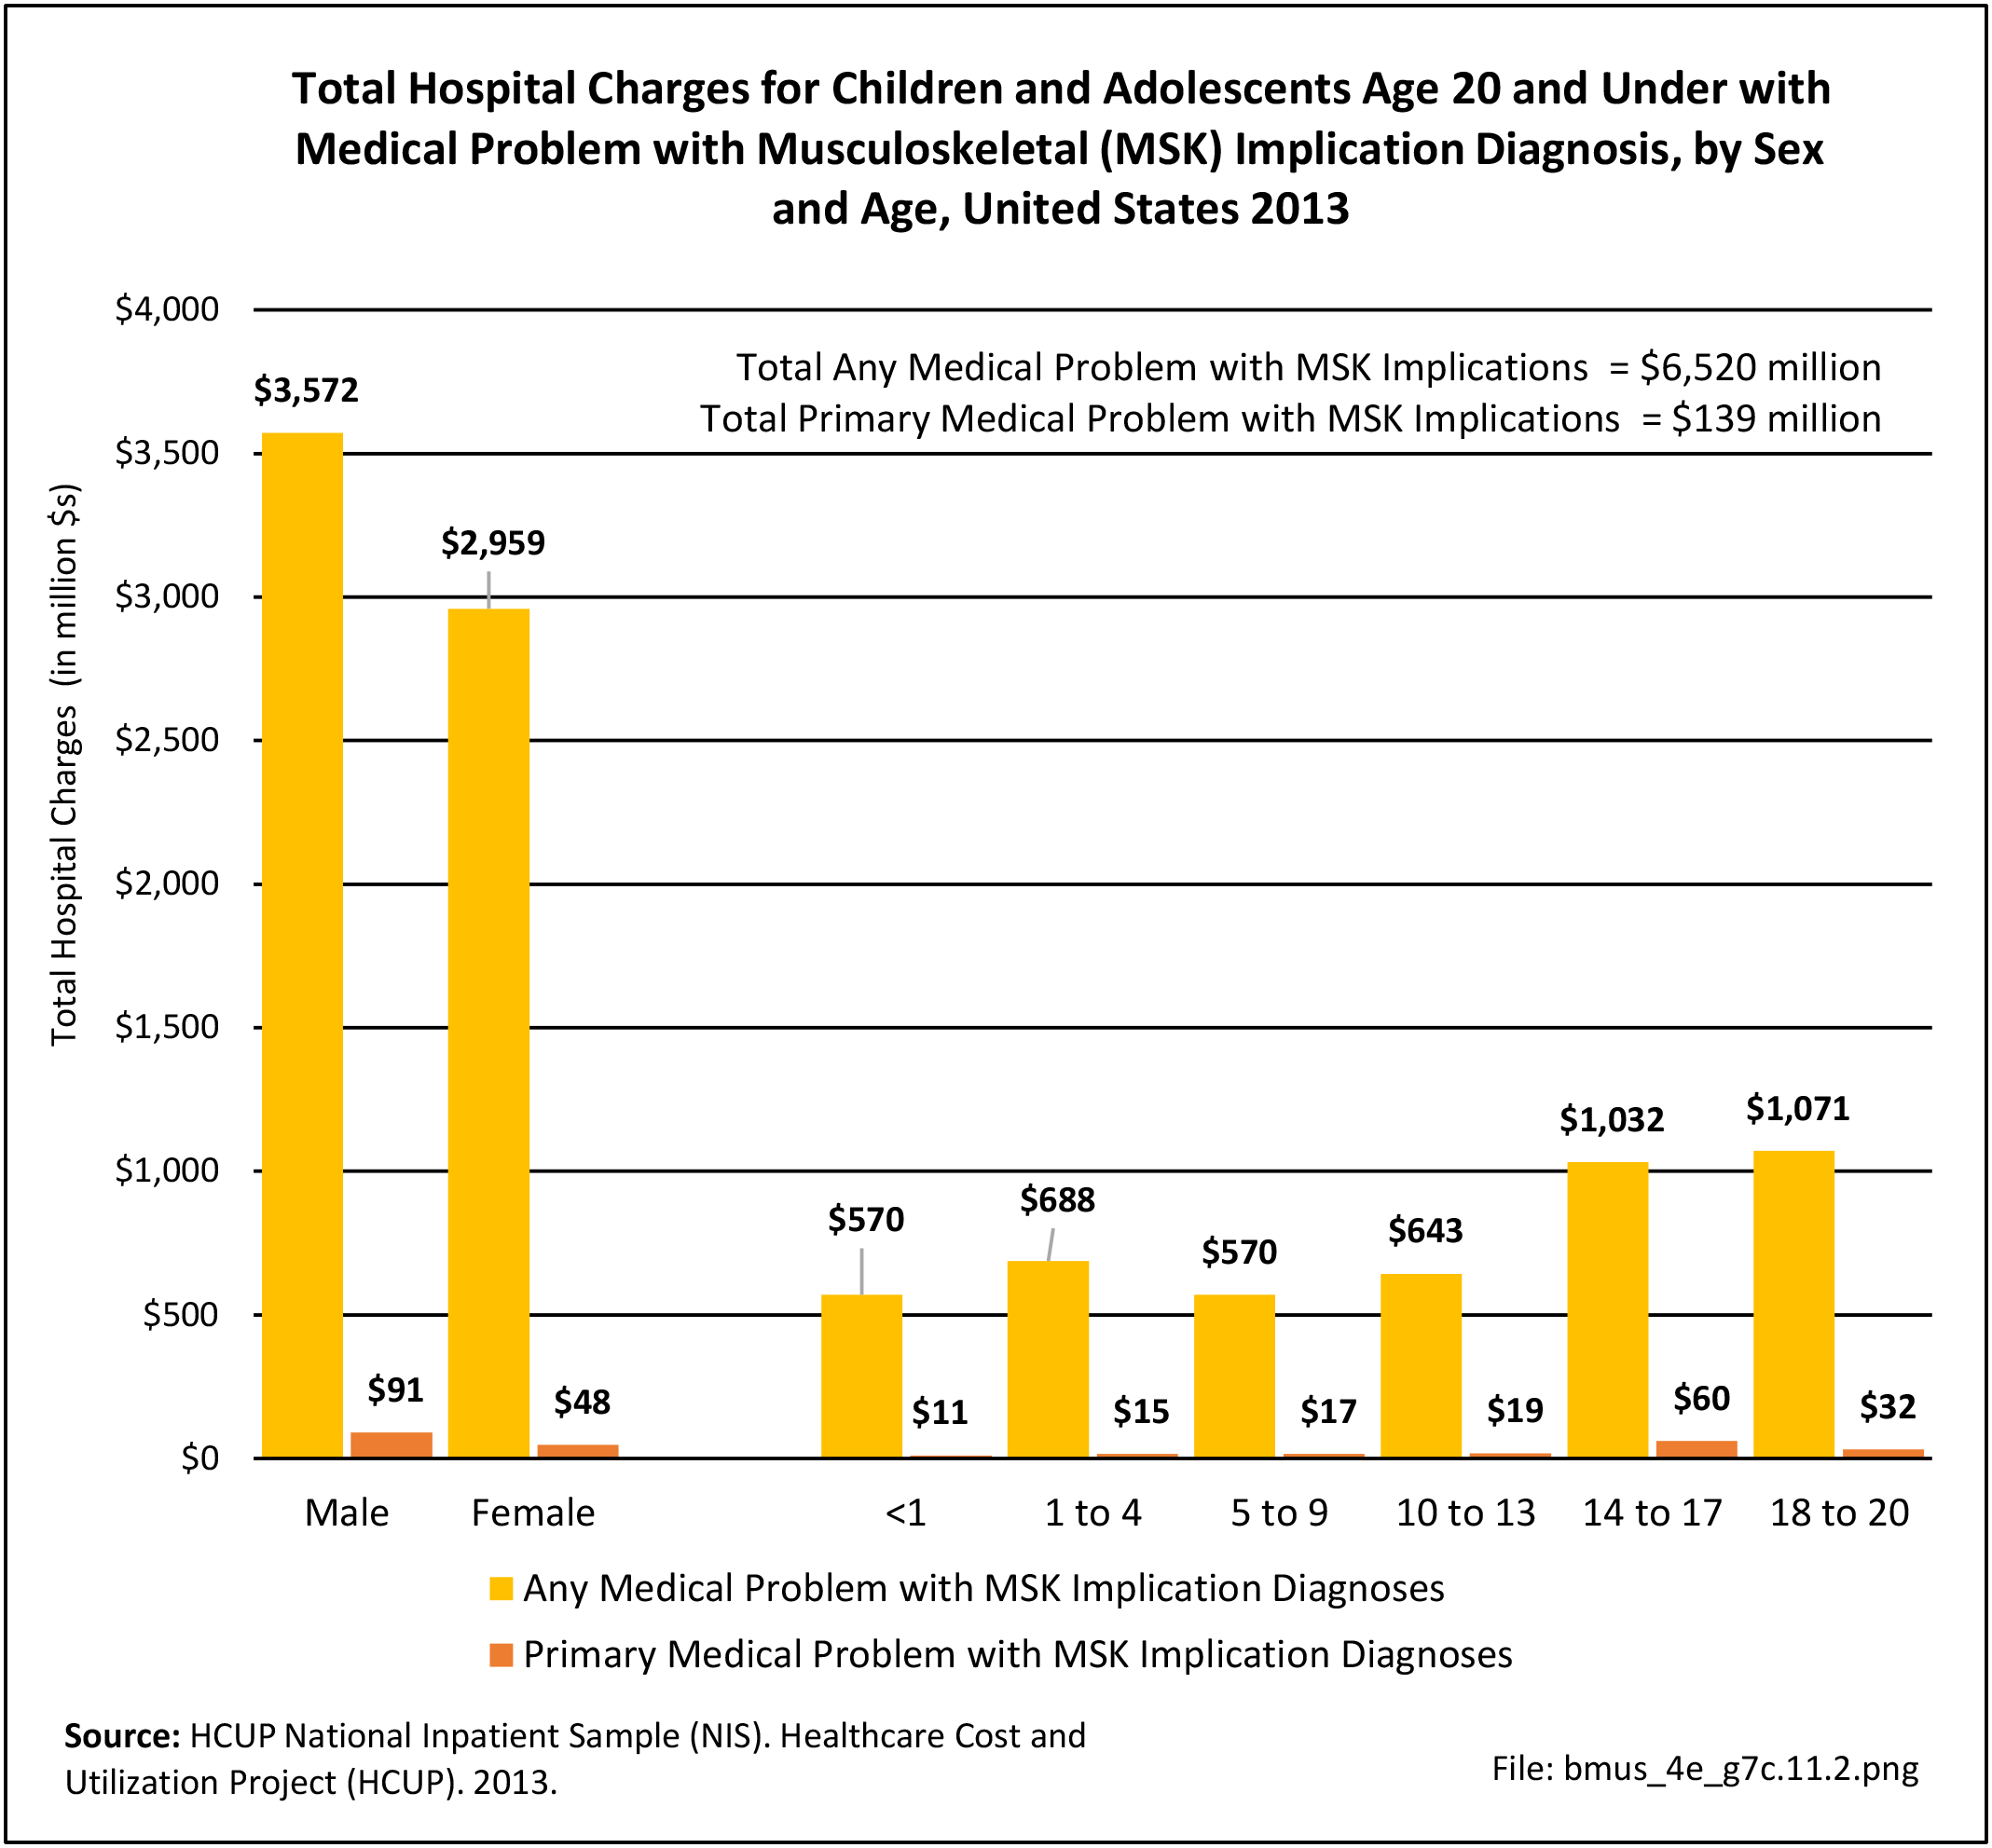
Males report injuries at twice the rate as females (64% of injuries), with the highest number of injuries occurring in the junior high (10 to 13 years) and high school (14 to 17 years) ages. (Reference Table 7C.7.1 PDF CSV)
Team Sports Injuries
Team sports, both organized and informal, accounted for just under one-half (46%, or 740,200 injuries) of all sports-related injuries reported. Basketball had the highest number of team sport related injuries at 33% and was closely followed by football at 31%.

Team sport injuries to males were three times the number reported for females (75%). The only sport in which female injuries outnumber male injuries is volleyball. Nearly half (45%) of team sport injuries to children and adolescents occurred during the high school years (age 14 to 17 years), with another 34% in the junior-high age range of 10 to 13 years. (Reference table 7C.7.1 PDF CSV)
The most common musculoskeletal injury incurred was a sprain or strain, accounting for 47% of team sport injuries. Volleyball had the highest proportion of sprains and strains, followed by basketball. Baseball led in contusion injuries, while fractures occurred most frequently in football, followed by soccer and hockey (including field, ice, and roller hockey). Only 1% of team sport injuries were serious enough to result in hospitalization. (Reference table 7C.7.2 PDF CSV)

Individual Sports Injuries
Individual sports injuries accounted for 54% of total injuries reported (872,900). Almost one in five injuries (18%) occurred while riding bicycles or other nonmotorized wheeled equipment such as tricycles and scooters. These injuries occurred most frequently to children ages 10 to 13 years. Injuries on playground equipment were the second highest type of individual sport injuries, accounting for 15% of all injuries. Playground equipment injuries occurred almost exclusively to children younger than 14 years old and most commonly in children aged 5 to 9 years old. Skating injuries (which includes roller and ice skates, inline skates, and skateboards) were the cause of 11% of individual sport injuries.

Females accounted for a larger share of individual sport injuries (45%) than in team sports. Still, the only activities in which females had a significantly higher number of injuries than males were in gymnastics/cheerleading/dancing as well as track and field. (Reference Table 7C.7.1 PDF CSV)
Fractures and sprains/strains each accounted for one-third of all individual sport activity injuries (36% and 36% respectively). However, the type of musculoskeletal injury varied substantially with the type of activity. Fractures resulted from playground equipment injuries more than one-half the time (57%), with a high share of fractures in snow sports (44%) and skating injuries (42%) as well. Sprains/strains occurred in almost two-thirds of track and field injuries (62%), and there were a higher share of sprains/strains occurring in fitness training (59%) and gymnastics/cheerleading/dancing (57%) as well. The most common type of injury reported from bicycle/wheeled equipment was contusions (44%). Nearly 3% of individual sport injuries resulted in hospitalization. (Reference table 7C.7.2 PDF CSV)

- 1. National Council on Youth Sports (NCYS) Report on Trends and Participation in Organized Youth Sports Available at: http://www.ncys.org/publications/2008-sports-participation-study.php. Accessed February 21, 2015.
- 2. Physical Activity Council. 2014 Activity Report: The Physical Activity Council’s annual study tracking sports, fitness, and recreation participation in the USA. Available at: http://www.physicalactivitycouncil.com/pdfs/current.pdf. Accessed February 21, 2015.
- 3. State of Play 2018 Trends and Developments. Available at: https://assets.aspeninstitute.org/content/uploads/2018/10/StateofPlay2018_v4WEB_2-FINAL.pdf Accessed August 20, 2019.
- 4. Caine D, Caine C, Maffulli N. Incidence and distribution of pediatric sport-related injuries. Clin J Sport Med 2006;16(6):500-513.
- 5. Apophyseal injuries, unique in the adolescent athlete, cause inflammation at the site of a major tendinous insertion onto a growing bony prominence.
- 6. Ireland ML. The female ACL: Why is it more prone to injury? Ortho Clin NA 2002;33(4):637-651.
Edition:
- Fourth Edition