In the United States, the national prevalence of osteoporosis based on BMD data comes from the National Health and Nutrition Examination Survey (NHANES). NHANES is conducted by the National Center for Health Statistics, Centers for Disease Control and Prevention (CDC), to assess the health and nutrition status of a representative sample of the noninstitutionalized US population. Participant interviews are conducted in their homes to assess a variety of health states. They receive standardized physical measurements, including BMD measurements via DXA, in mobile examination centers that are moved around the nation. In 2017, the most recent national estimates of the prevalence of osteoporosis based on femoral neck and lumbar spine BMD data were released using NHANES data from the 2005–2006 through the 2013-2014 cycles (NHANES data is collected in 2-year cycles).1 In addition to reporting the prevalence estimates overall and by sex, this report expanded by race and ethnicity results to include non-Hispanic Asians.
Current Prevalence by Demographics
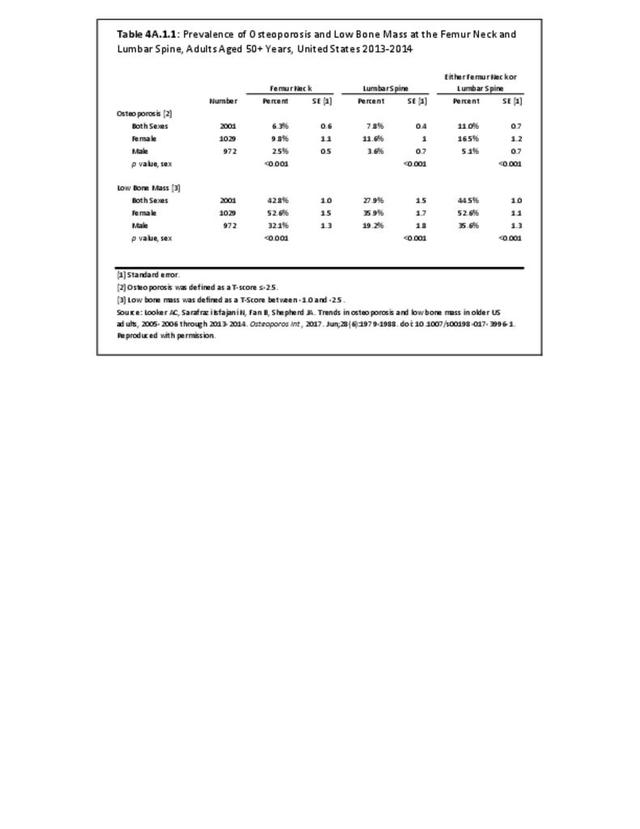
Using the 2005-2006 thru 2013-2014 data, the average overall prevalence of osteoporosis in US adults aged 50 and over was 11.0%, or roughly 12 million adults, when using either the femoral neck or lumbar spine T-score. The prevalence was significantly higher in women (16.5%) than men (5.1%). The overall prevalence of low bone mass was 44.5%, representing ~45 million adults. The prevalence of low bone mass was higher in women (52.6%) than in men (35.6%).1 (Reference Table 4A.1.1 PDF CSV)

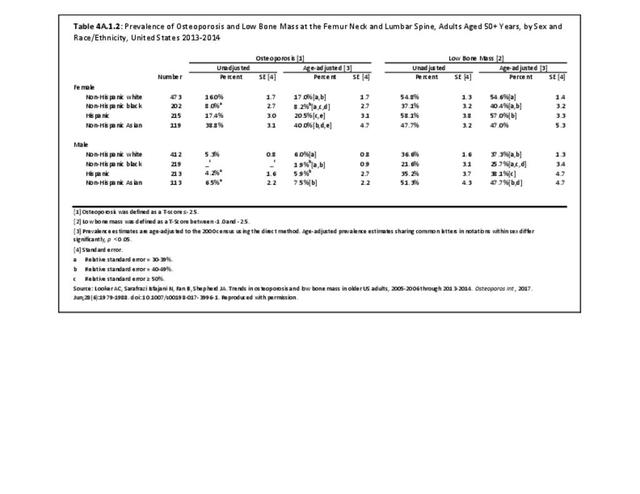
Among women, non-Hispanic Asians over the age of 50 years had the highest prevalence of osteoporosis (40.0%), followed by Hispanic women (20.5%), non-Hispanic white women (17.0%), and non-Hispanic black women (8.2%). Among men, non-Hispanic Asian men had the highest age-adjusted prevalence of osteoporosis (7.5%), followed by non-Hispanic whites (6.0%), Hispanics (5.9%), and non-Hispanic black men (1.9%). Hispanic (57.0%) and non-Hispanic white (54.6%) women had the highest age-adjusted prevalence of low bone mass, followed by non-Hispanic Asian (47.0%) and non-Hispanic black (40.4%) women. Asian (47.7%) and Hispanic (38.1%) men had the highest age-adjusted prevalence of low bone mass, followed by non-Hispanic white (37.3%) and non-Hispanic black (25.7%) men.1 (Reference Table 4A.1.2 PDF CSV)

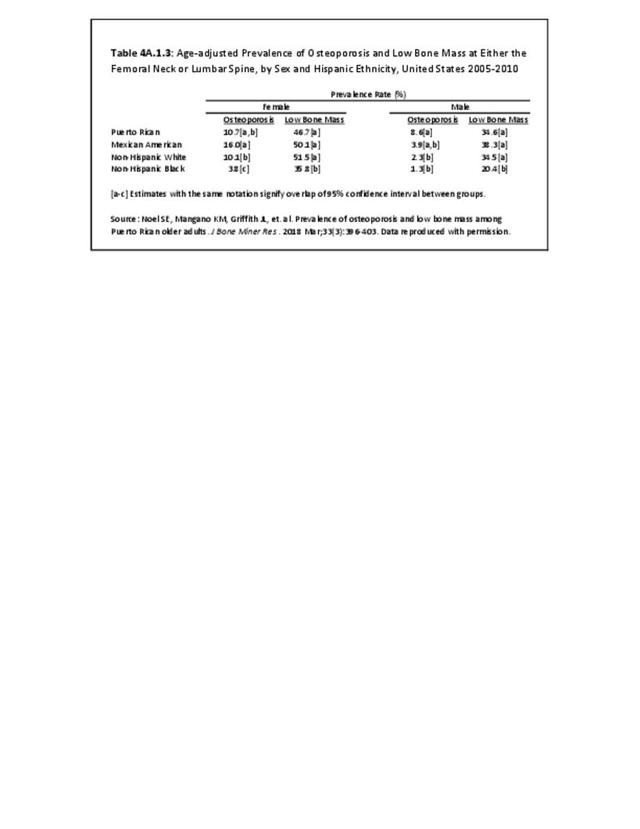
The Hispanic population includes populations based on country of origin, including persons of Cuban, Mexican, Puerto Rican, South or Central American, or other Spanish culture or origin regardless of race. Previous studies have shown different fracture rates between Mexican, Cuban, and Puerto Rican American men and women,2 and it is likely that the prevalence of osteoporosis and low bone mass are different between Hispanic ethnic subgroups. A recent analysis utilizing data from the Boston Puerto Rican Osteoporosis Study (BPROS) compared the prevalence of osteoporosis and low bone mass by race/ethnic distribution in the US population as reported in the 2005-2010 NHANES to that of the prevalence estimates in their age and sex cohorts.3 They found that Mexican American women had the highest prevalence of osteoporosis at the femoral neck or spine (16%), followed by Puerto Rican women (10.7%), non-Hispanic white women (10.1%), and then non-Hispanic black women (3.8%). However, among men, Puerto Rican men had the highest prevalence of osteoporosis (8.6%), followed by Mexican American men (3.9%), non-Hispanic white men (2.3%), and non-Hispanic black men (1.3%), highlighting the burden of bone health in multiple Hispanic communities. The heterogeneity in osteoporosis prevalence observed by Hispanic origin likely applies to Asian groups as well, as indicated by age-standardized hip fracture incidence rates by country of origin. These data showed that women from Taiwan had higher hip fracture incidence rates than women from China.4 (Reference Table 4A.1.3 PDF CSV)


- 1. a. b. c. Looker AC, Sarafrazi Isfajani N, Fan B, Shepherd JA. Trends in osteoporosis and low bone mass in older US adults, 2005-2006 through 2013-2014. Osteoporos Int. 2017;28(6):1979-1988. doi: 10.1007/s00198-017-3996-1.
- 2. Lauderdale DS, Jacobsen SJ, Furner SE, et al. Hip fracture incidence among elderly Hispanics. Am J Public Health. 1998;88(8):1245-1247.
- 3. Noel SE, Mangano KM, Griffith JL, et. al. Prevalence of osteoporosis and low bone mass among Puerto Rican older adults. J Bone Miner Res. 2018;33(3):396-403.
- 4. Cauley JA, Chalhoub D, Kassem AM, Fuleihan GE. Nat Rev Endocrinol. 2014;10:338–351. Published online 22 April 2014; doi:10.1038/nrendo.2014.51.
Edition:
- Fourth Edition