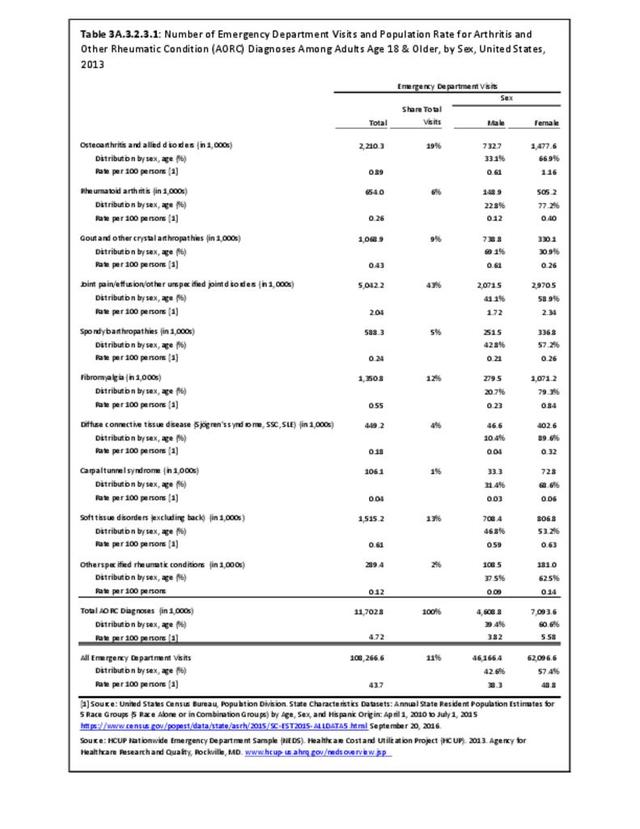
Joint pain is a major symptom of arthritis and non-arthritis conditions and a primary reason for seeing a medical care provider. Self-report surveys ask about joint pain but do not distinguish the cause of joint pain, which may be from arthritis, injuries, or degeneration of bone surfaces.
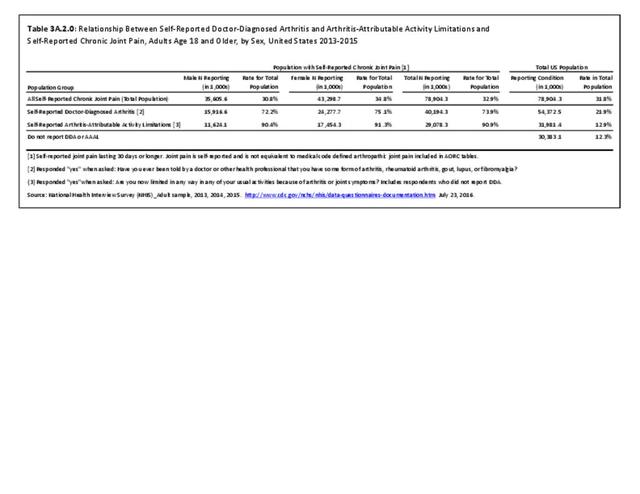
In 2013-2015, chronic joint pain was self-reported in the National Health Interview Survey (NHIS) by 78.9 million adults, among which 40.2 million also reported doctor-diagnosed arthritis (DDA) and 29.1 million reported activity limitations due to arthritis (AAAL). Because the latter two groups are not mutually exclusive, 30.4 million, or about 13% of the total population, have chronic joint pain but no DDA or AAAL. (Reference Table 3A.2.0 PDF CSV)
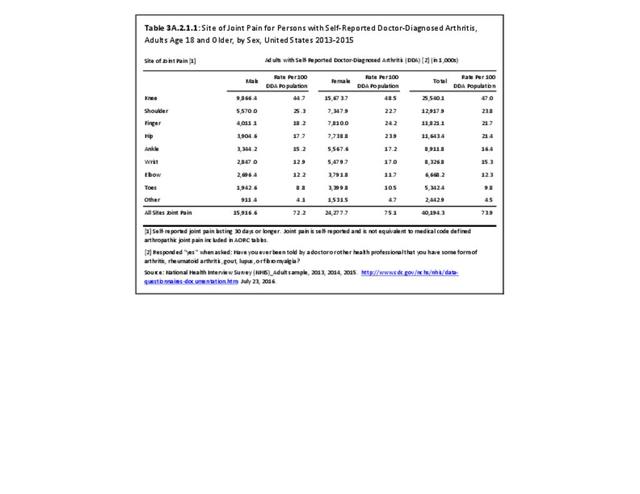
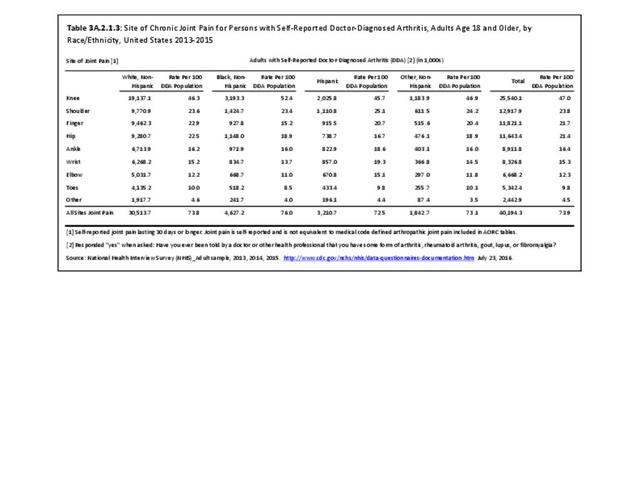
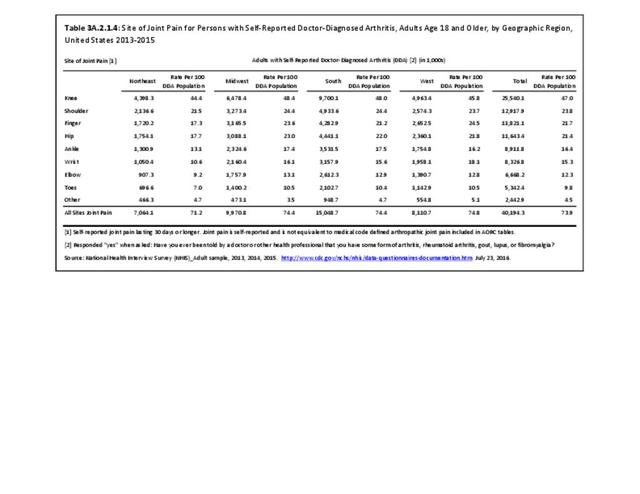
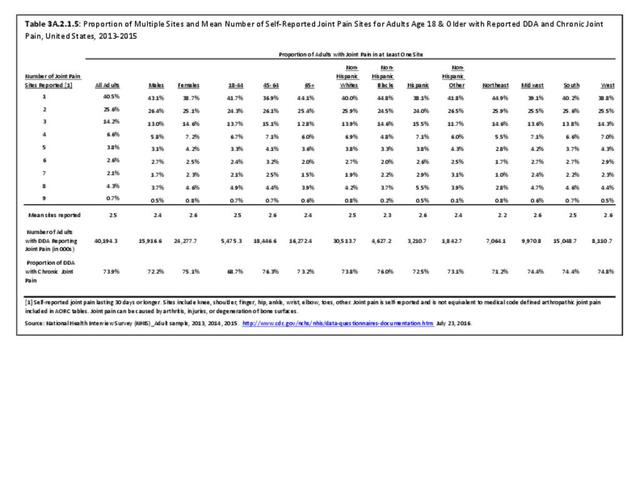
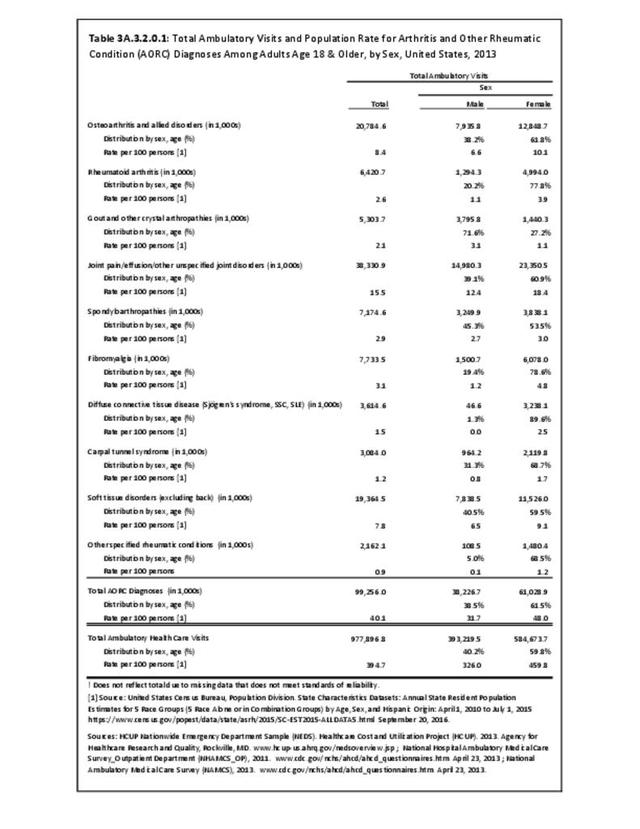
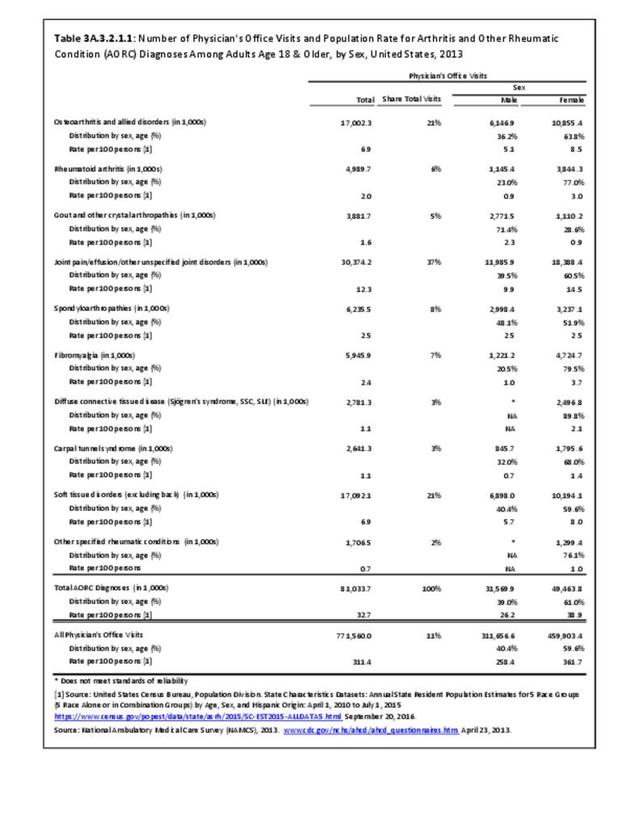
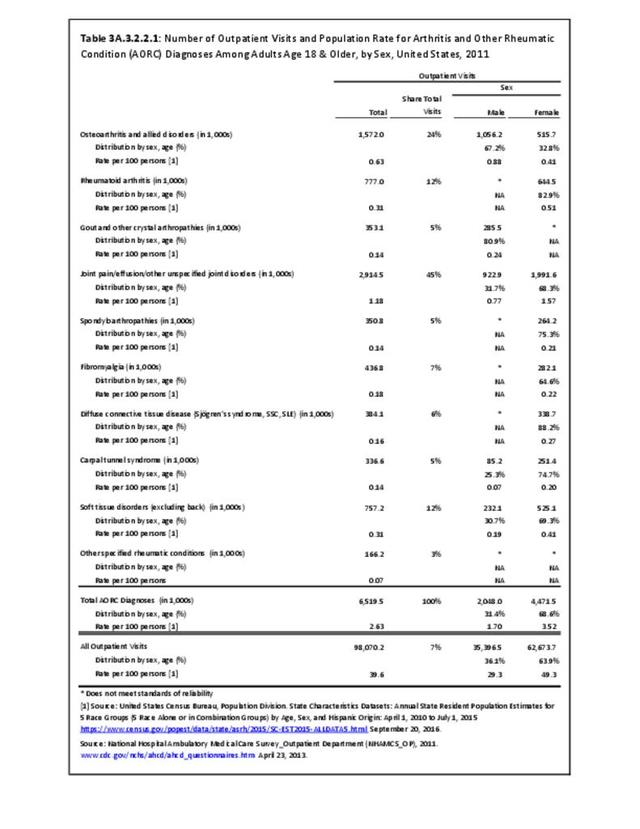
The most common site of chronic joint pain reported by adults with DDA is the knee, reported by nearly 1 in 2 adults. Pain in the shoulder, finger, and/or hip is reported at each site by more than 1 in 4 adults with DDA. While 40% of people with DDA report joint pain in only one site, more than 20% report pain in four or more sites. (Reference Table 3A.2.1.1 PDF CSV and Table 3A.2.1.5 PDF CSV)
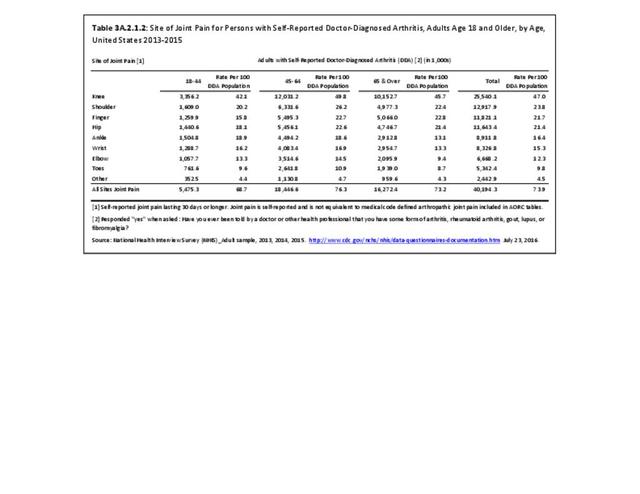
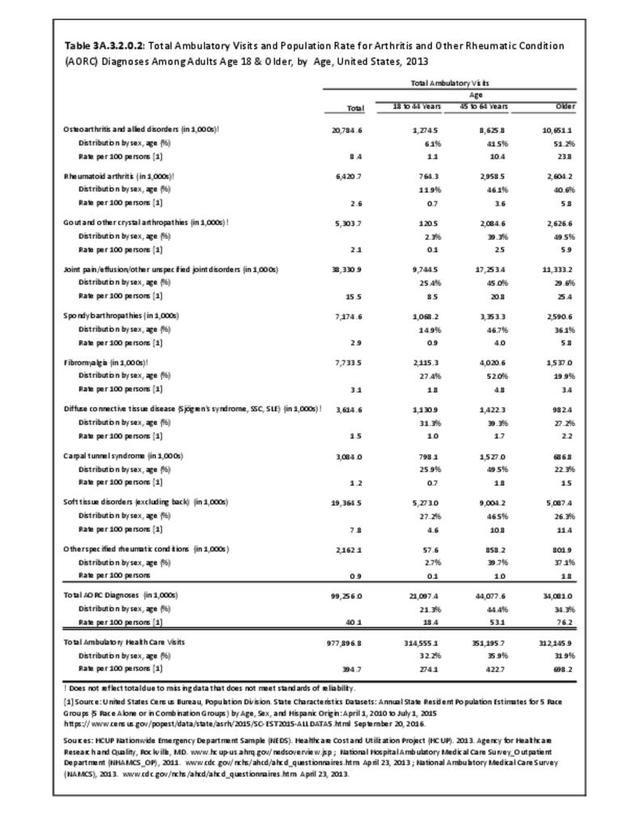
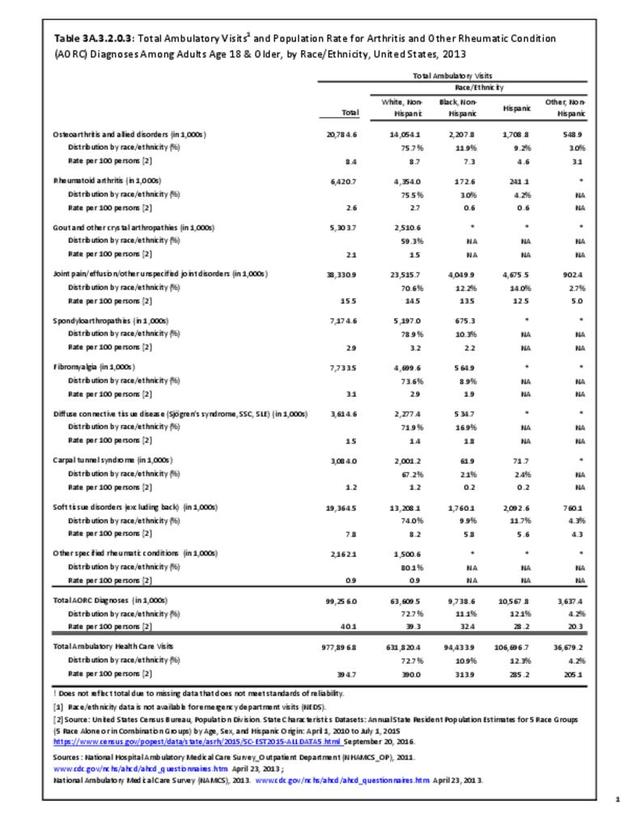
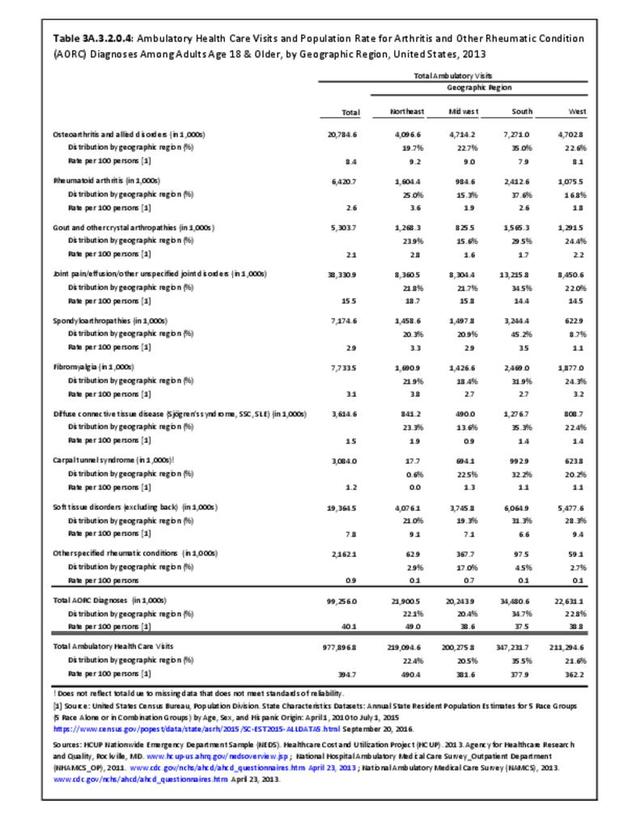
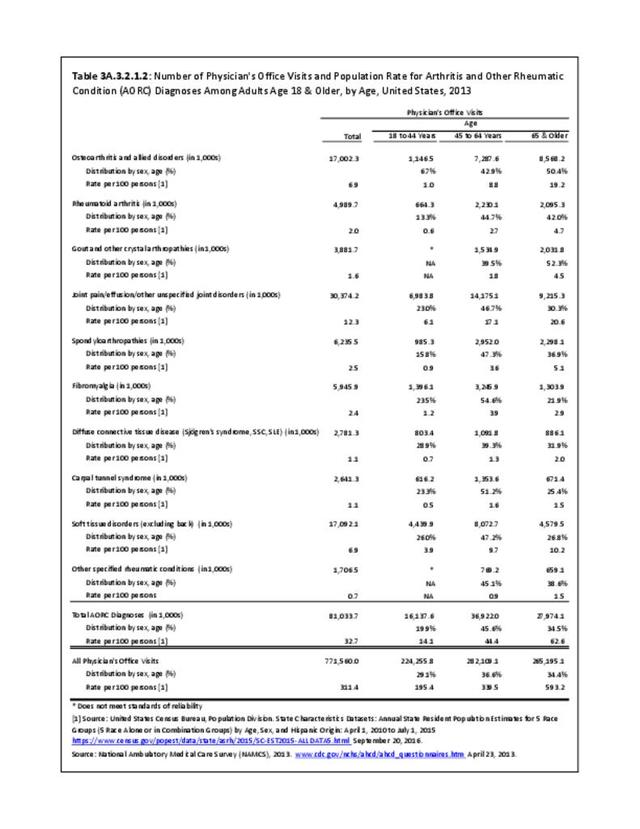
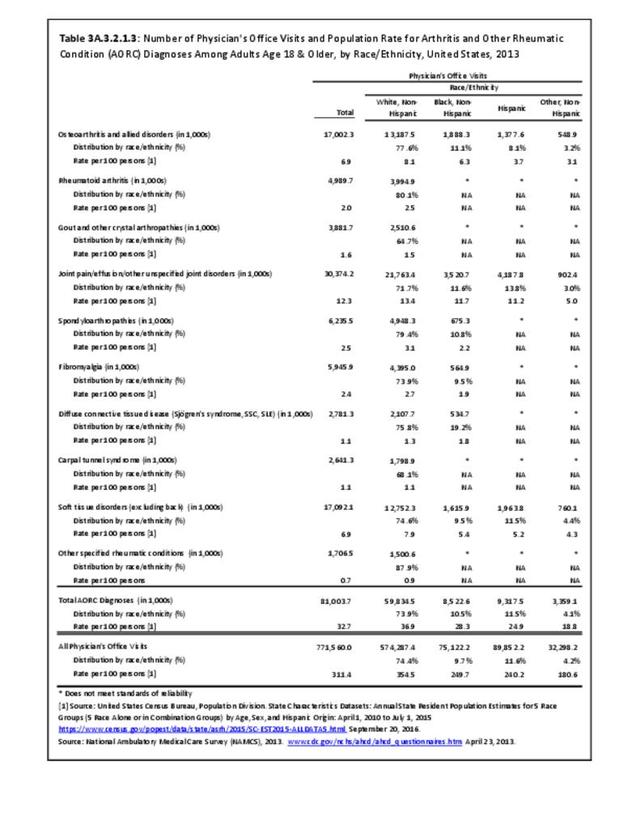
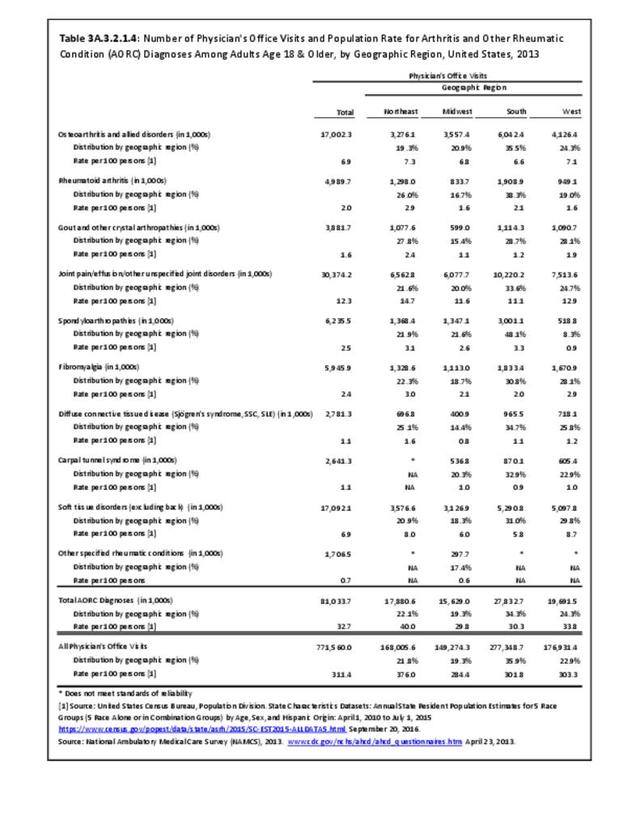
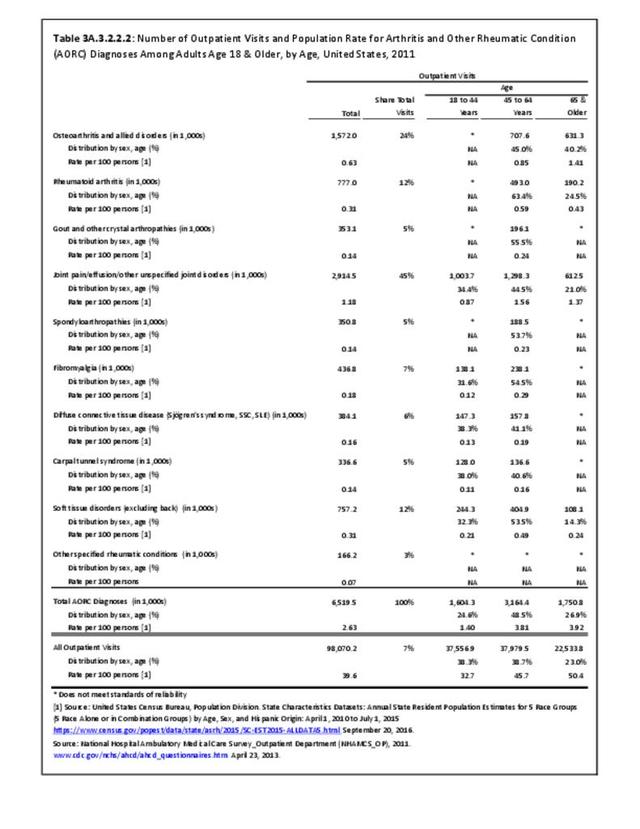
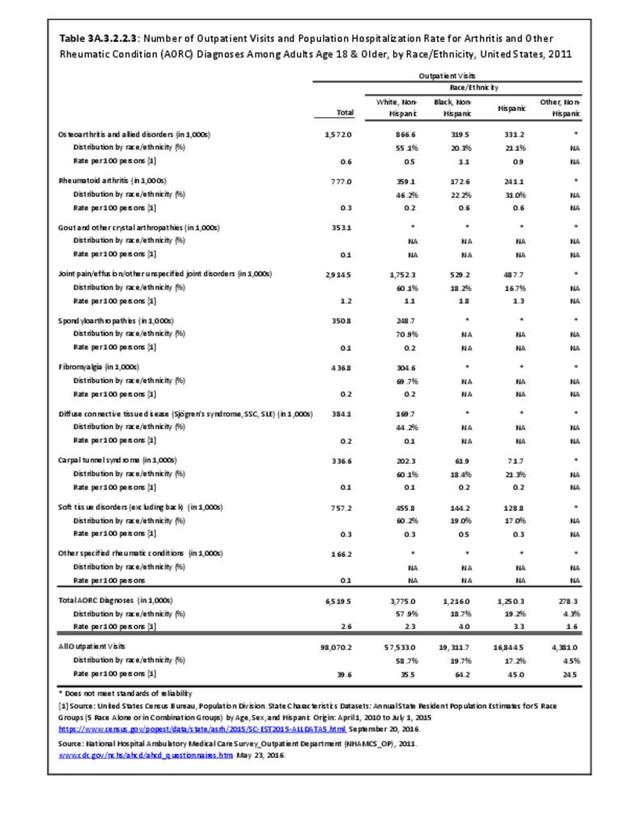
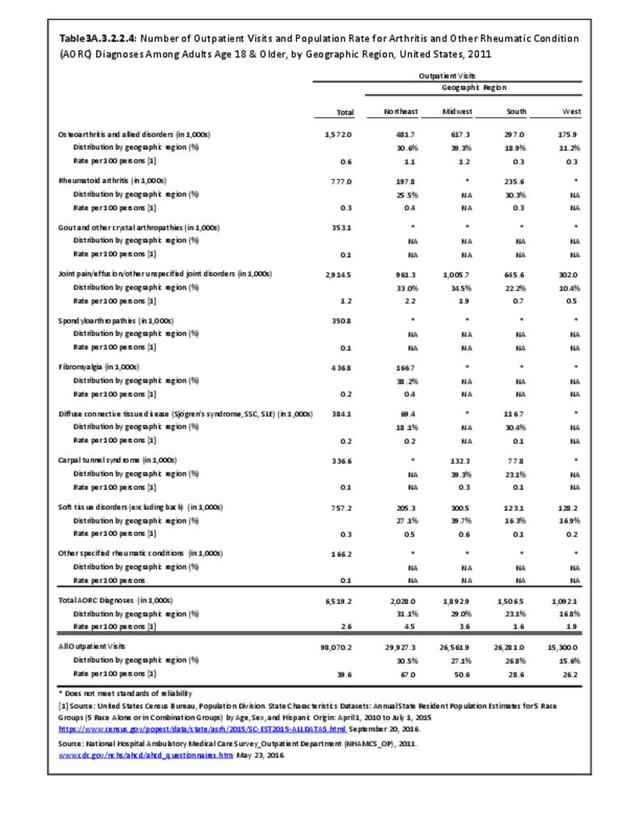
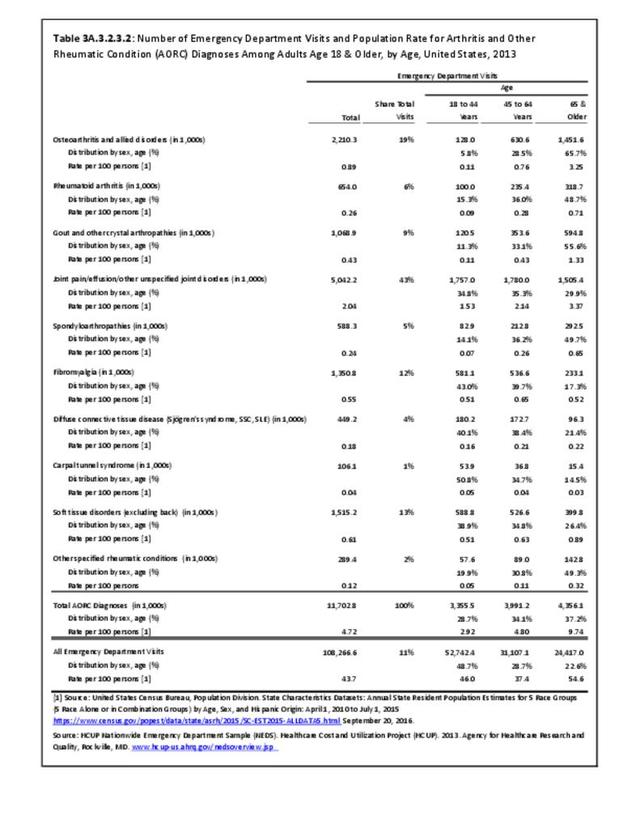
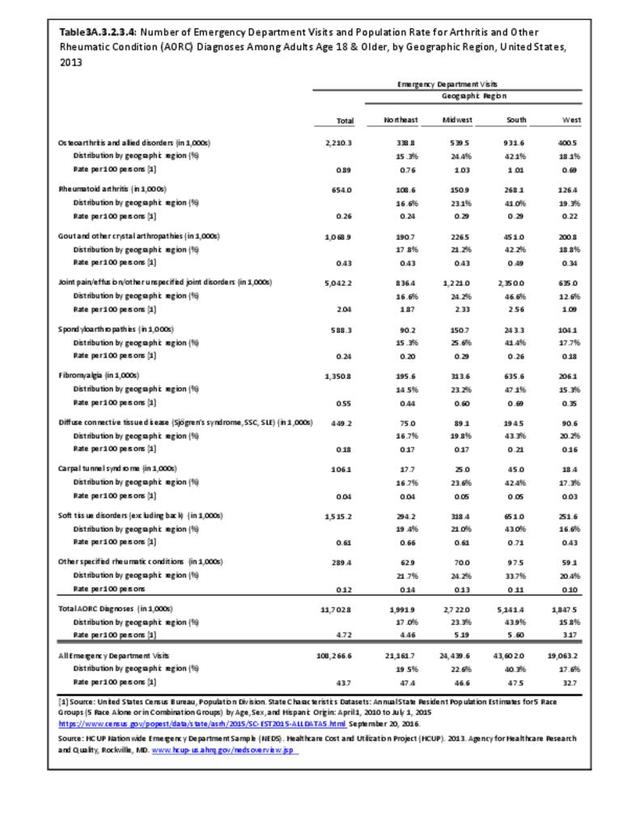
Among adults with DDA, joint pain occurs in females more frequently than males, and in middle age more frequently than younger or older ages. Joint pain was similar by race/ethnicity and region. (Reference Table 3A.2.1.1 PDF CSV; Table 3A.2.1.2 PDF CSV; Table 3A2.1.3; PDF CSV; and Table 3A.2.1.4 PDF CSV)

Joint Replacement
While in some sense, the need for a joint replacement represents failure of measures to prevent the occurrence or progression of joint problems, for those with the severe pain or poor function of end-stage joint problems, it can offer a life-altering “cure.” Joint replacements represent one of the fastest growing procedures in the US. Joint replacement procedures for hips and knees are most common, but replacements have been expanding to other joint sites in recent years.
Estimates presented come from the Healthcare Cost and Utility Project (HCUP) Nationwide Inpatient Sample (NIS). In previous editions of BMUS, estimates from the National Hospital Discharge Survey (NHDS) were also presented and are found in two tables showing trends on mean age of joint replacement patients and average length of hospital stay. The NHDS is no longer produced and not otherwise used here.
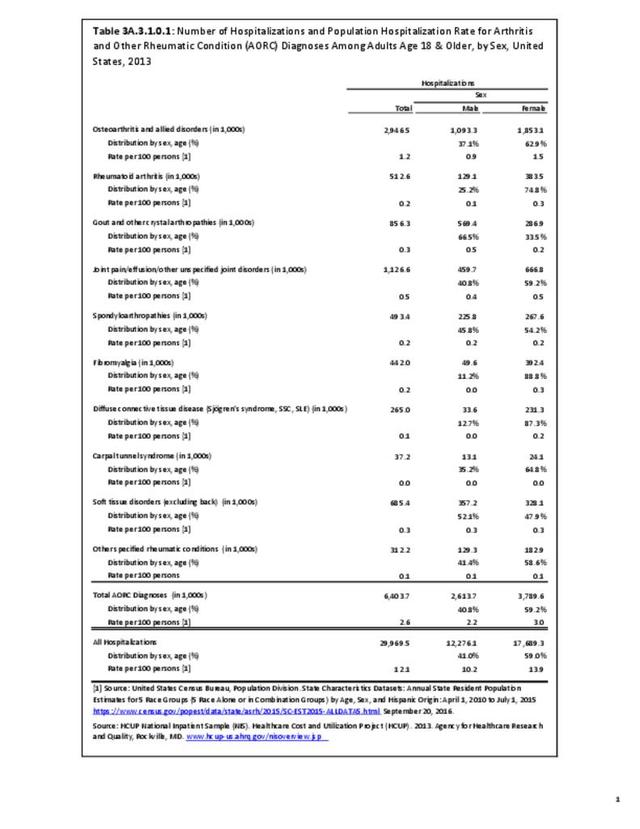
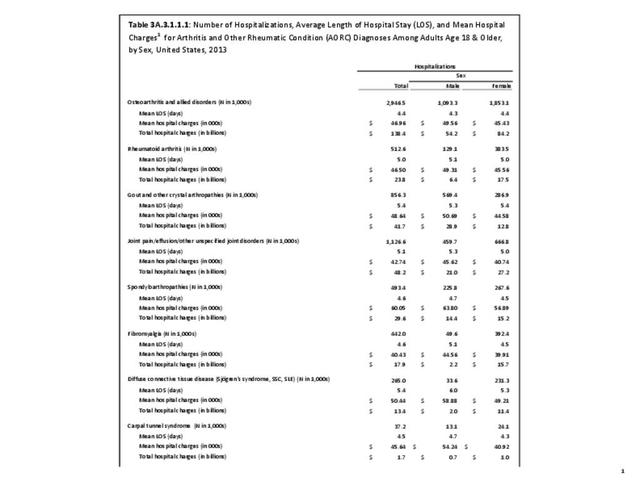
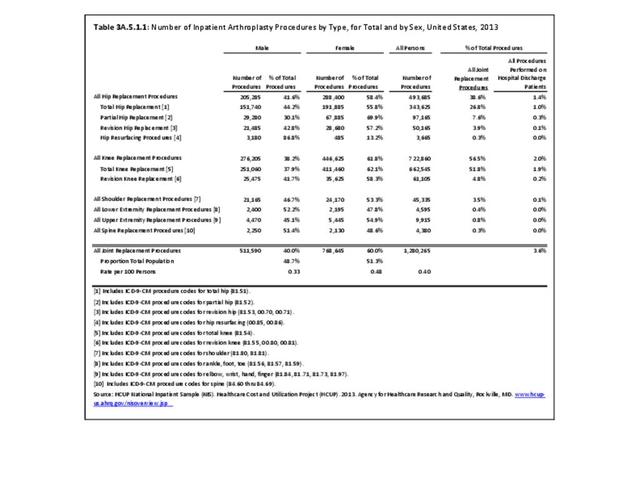
In 2013, an estimated 1.3 million inpatient joint replacement procedures were performed. Joint replacement procedures comprised about 3.6% of all inpatient procedures. More joint replacements were performed on women than men (60% vs 40%), and 95% of the procedures were performed on knees or hips. (Reference Table 3A.5.1.1 PDF CSV)

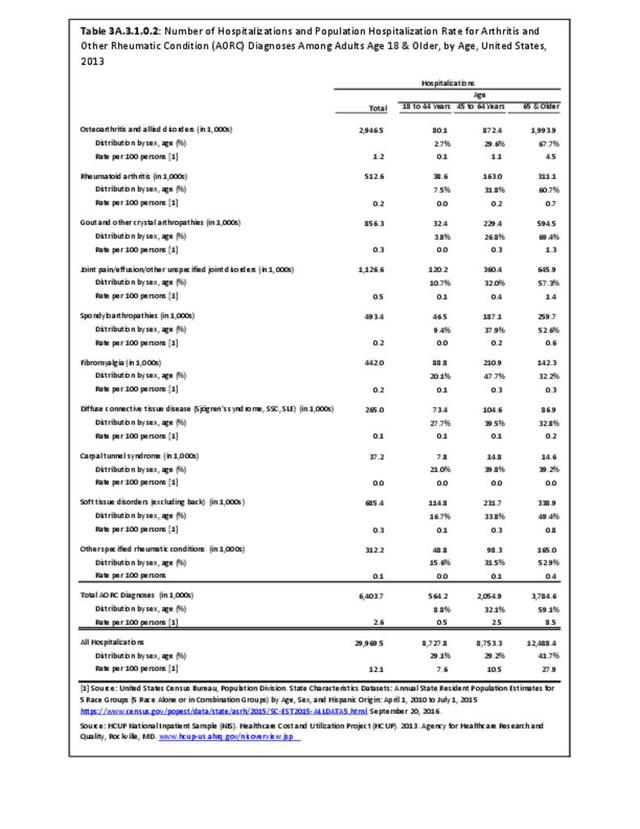
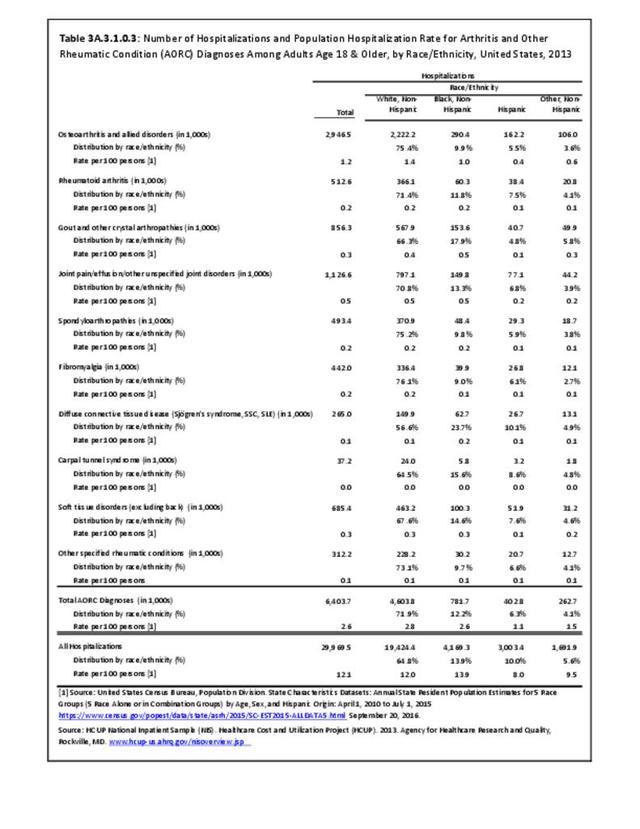
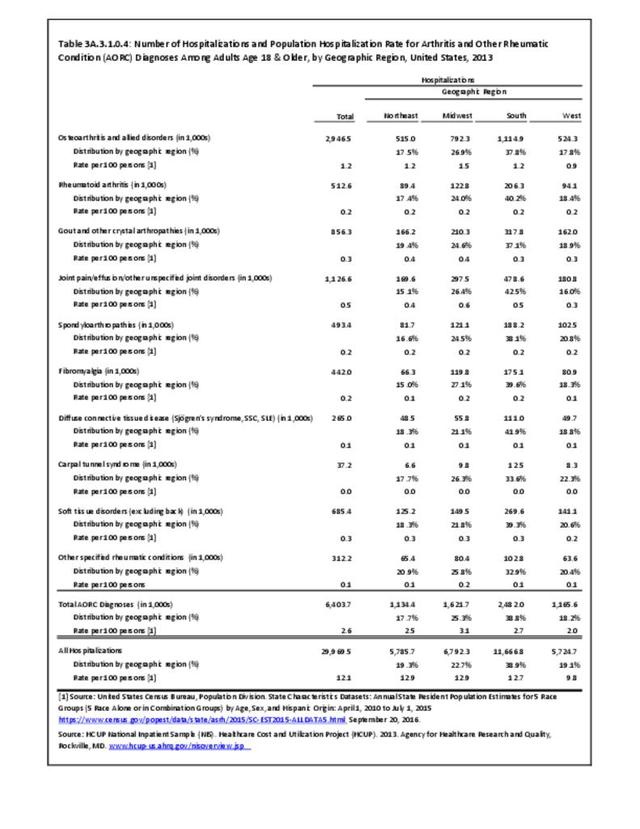
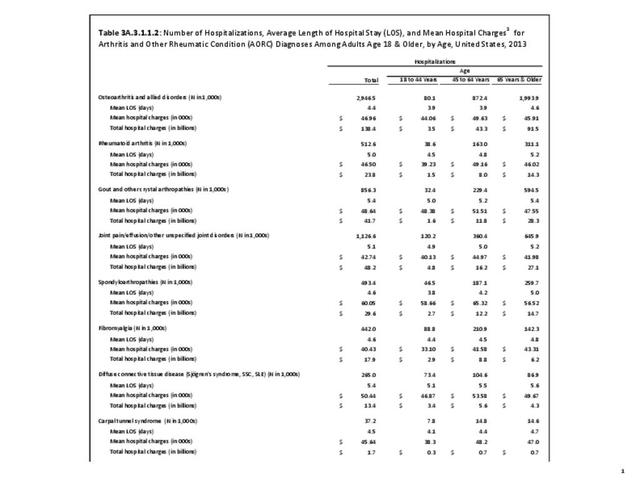
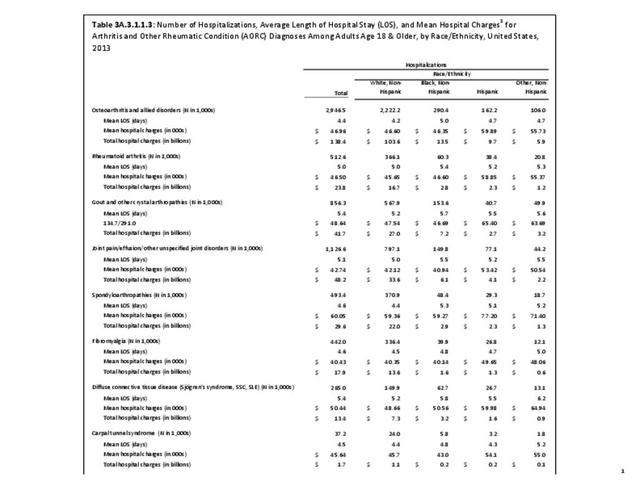
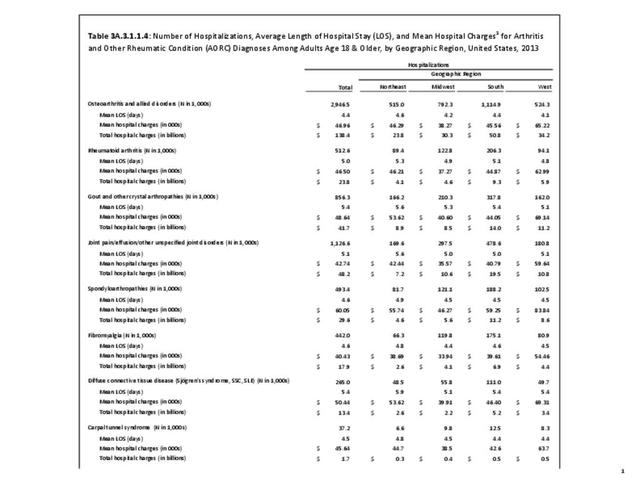
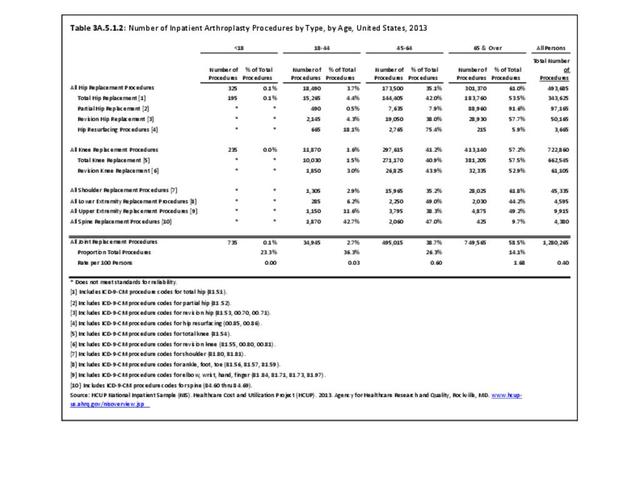
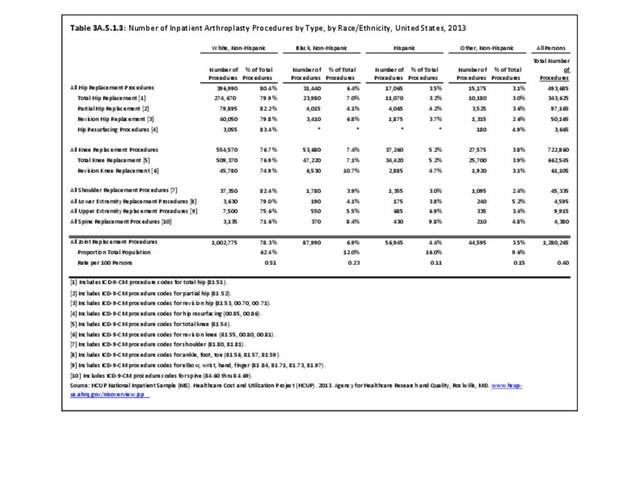
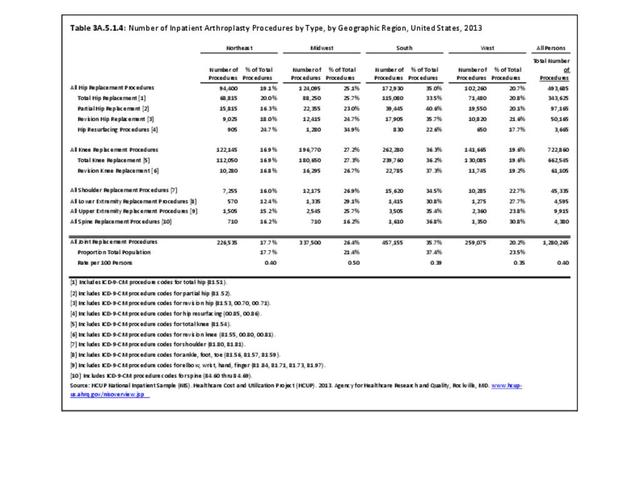
While joint replacement procedures are being performed on younger patients than in the past, it is still primarily a procedure for older patients. Persons age 65 years and older comprised 14% of the population in 2013 but accounted for 59% of the joint replacement procedures performed; most of the rest were performed among those aged 45 to 64 years. Nearly one in every 60 persons in the 65 years and older population had a joint replacement procedure performed in 2013, although a small number may have had more than one procedure. (Reference Table 3A.5.1.2 PDF CSV) Non-Hispanic whites are more than twice as likely to undergo a joint replacement as those of other racial/ethnic groups. A greater proportion of residents of the Midwest have joint replacements (0.5/100 persons) than residents in other regions of the US. (Reference Table 3A.5.1.3 PDF CSV; and Table 3A.5.1.4 PDF CSV)
Knee Replacement Procedures
In 2013, nearly 723,000 knee replacement procedures were performed in the U.S., comprising 56% of all joint replacement procedures. Over 90% were total knee replacements, but 8% were revision knee replacements, which occur when the original replacement fails or becomes infected. Three in five knee replacements (62%) occurred in females. More than one-half (57%) of knee replacement procedures were performed on those aged 65 years and older, but a substantial proportion (41%) were performed on persons aged 45 to 64 years. The majority (77%) of knee replacements were performed on non-Hispanic whites, with a proportion more than twice that of other racial/ethnic groups. The ratio of knee replacements to total population is higher in the Midwest region (27.2% of replacements vs. 21.4% of population) than other regions, with the Northeast having the lowest ratio of procedures (16.9% vs. 17.7%). (Reference Table 3A.5.1.1 PDF CSV; Table 3A.5.1.2 PDF CSV; Table 3A.5.1.3 PDF CSV; and Table 3A.5.1.4 PDF CSV)
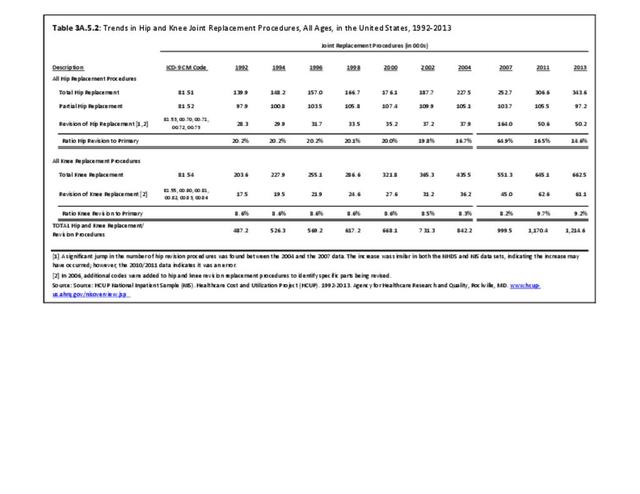
Trends in knee replacement procedures from 1992 to 2013 show steady increases in both total and revision knee replacements. Over the 22-year period, knee replacement procedures more than tripled, with the ratio of revisions to total remaining constant at 8% to 10%. (Reference Table 3A.5.2 PDF CSV).

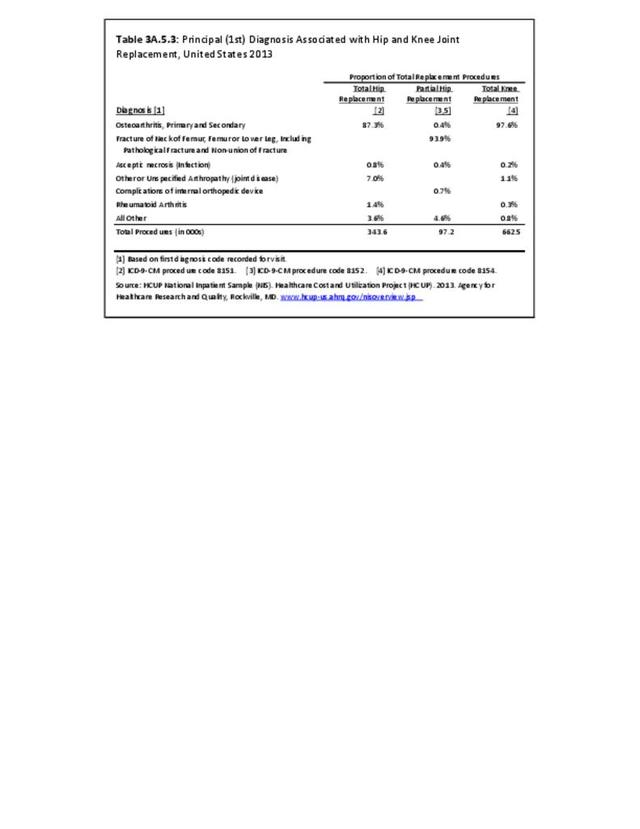
The principal or first diagnosis associated with total knee replacement is osteoarthritis, accounting for 98% of all replacements in 2013. (Reference Table 3A.5.3 PDF CSV).
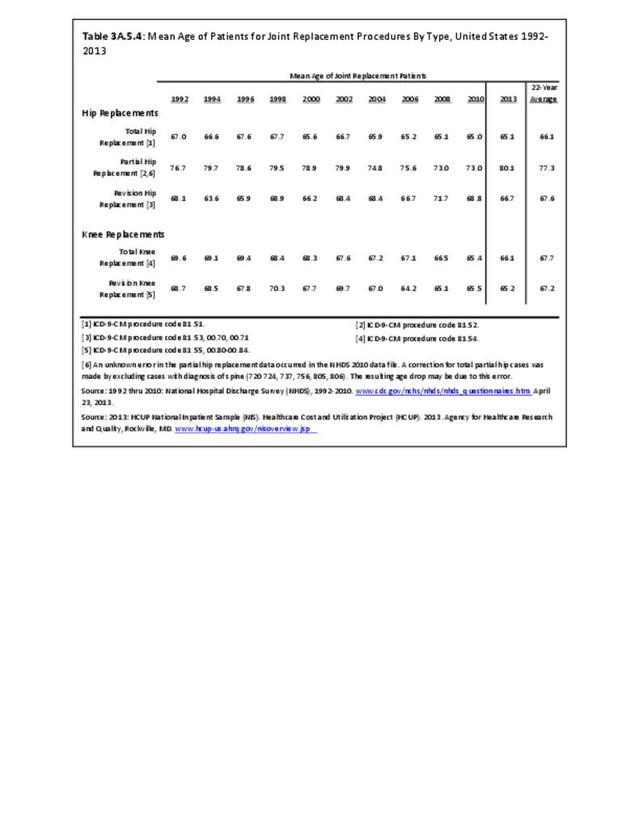
The 22-year mean age from 1992 to 2013 was nearly 68 years for total knee replacements, and about half a year younger for revision knee replacements. The mean age for both procedures shows a slow decline over time. (Reference Table 3A.5.4 PDF CSV)
The average inpatient length of stay for total knee replacements has shown a remarkable decline of about 67% from a mean of nearly 8.9 days in 1992 to a mean of 3.4 days in 2013. (Reference Table 3A.5.5 PDF CSV).

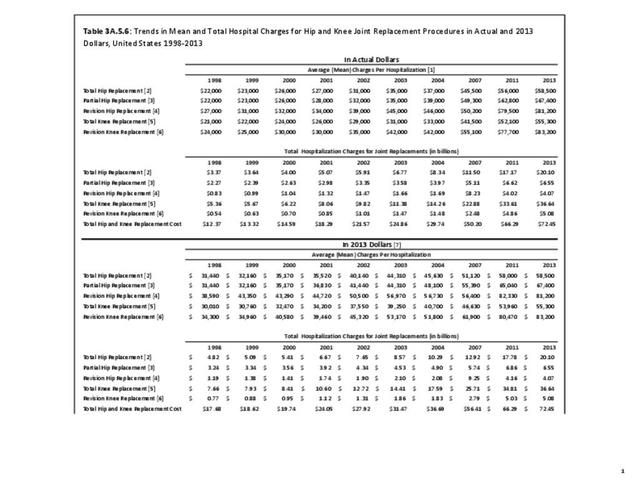
Despite shorter hospital stays, the mean hospital charges from 1998 through 2013 showed a steady increase for all knee replacements, with revision knee replacement being more expensive than total knee replacement. Total hospitalization charges for both types of knee replacements have increased by five times over (in constant 2013 dollars) from $8.4 billion in 1998 to $41.7 billion in 2013. (Reference Table 3A.5.6 PDF CSV)

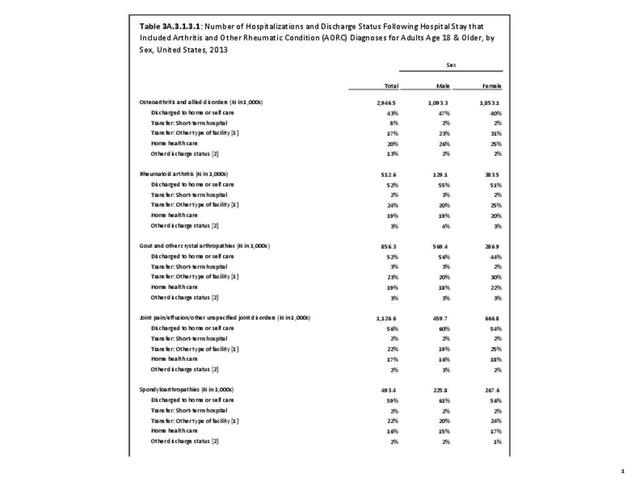
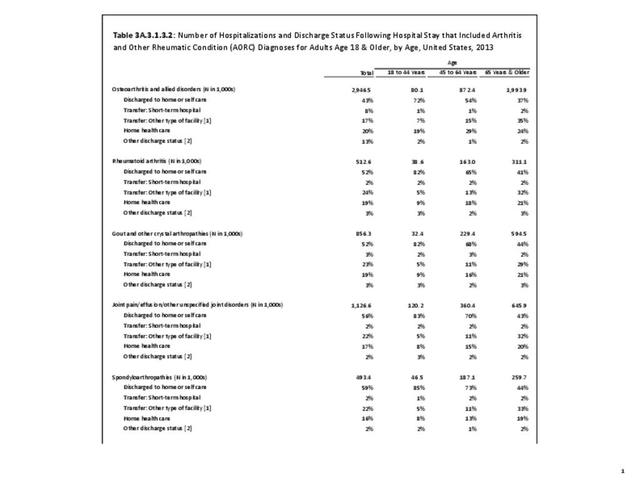
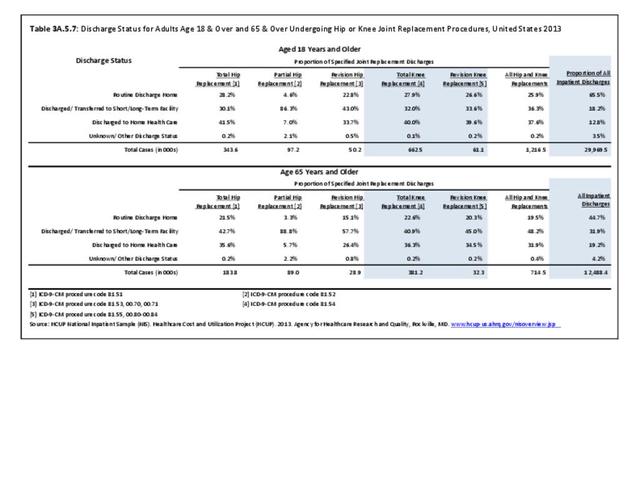
Most adults (72%) with knee replacements are discharged to either short- or long-term care or home health care, likely due to the short hospital stay. Among persons aged 65 and older, a slightly higher proportion are discharged to either short- or long-term care or home health care (77%). (Reference Table 3A.5.7 PDF CSV)
Hip Replacement Procedures
An estimated 493,700 hip replacement procedures were performed in 2013, comprising 39% of all joint replacement procedures. A majority, about 58%, occurred in females. Total hip replacements occurred three times as frequently as partial hip replacements, and both are far more common than revision hip replacement. A very small number of procedures, about 3,700 in 2013, were hip resurfacing, an alternative to replacement, particularly for young, active males. Females have more hip replacement procedures than males, particularly partial replacements. Hip replacements were more common among adults aged 65 years and older (61%), with most of the rest occurring among adults aged 45 to 64 years. Hip replacements by race/ethnicity paralleled that for all joint replacements, as did hip replacements by geographic region. (Reference Table 3A.5.1.1 PDF CSV; Table 3A.5.1.2 PDF CSV; Table 3A.5.1.3 PDF CSV; and Table 3A.5.1.4 PDF CSV)
Trends in hip replacement procedures from 1992 to 2013 show total hip replacements increasing in number by 150%, while the number of partial replacements remained relatively stable. The ratio of revision hip to total hip replacements was about 20% from 1992 to 2002, but has consistently been around 17% since then, and dropped to 15% in 2013. (Reference Table 3A.5.2 PDF CSV)

The principal or first listed diagnosis associated with total hip replacements was osteoarthritis (87%). The primary diagnosis for partial hip replacements was fractures (94%). (Reference Table 3A.5.3 PDF CSV)
The 22-year mean age was about 66 years for total hip replacements and 77 years for partial hip replacements, reflecting the different underlying diagnoses. Mean ages for both procedures show a slight decline over the time period, reflecting the younger age at which joint replacements are now considered. However, in 2013, the mean age for partial hip replacements jumped to 80. (Reference Table 3A.5.4 PDF CSV)
The mean length of stay for total hip replacements (3.0 days in 2013) showed the same remarkable decline as that for knee replacements--about 67% from 1992 through 2013. The mean lenth- of-stays for partial and revision replacements are longer, with about a 50% decline over the 22-year period. (Reference Table 3A.5.5 PDF CSV)

Despite shorter hospital stays, mean hospital charges from 1998 through 2013 steadily increased for all hip replacements even when compared in constant 2013 dollars. Revision hip replacements are the most expensive, while total hip replacements are the least expensive. Total hospital charges for all hip replacements have tripled (in constant 2013 dollars) from $9.25 billion in 1998 to $30.7 billion in 2013, led by charges for total hip replacements. (Reference Table 3A.5.6 PDF CSV)

Other Joint Replacement Procedures
Shoulder replacement procedures accounted for an estimated 45,000 procedures in 2013, comprising about 4% of all joint replacement procedures. At the same time, an estimated 19,000 other joint replacement procedures were performed for other joints in the upper and lower extremities, and the spine. More than with hip and knee replacements, these other joint replacement procedures occurred somewhat equally between females and males, and were more evenly divided between those aged 44 to 64 and those aged 65 years and older, except for shoulder replacements. Race/ethnicity and geographic regions resembled the distribution of all joint replacements. (Reference Table 3A.5.1.1 PDF CSV; Table 3A.5.1.2 PDF CSV; Table 3A.5.1.3 PDF CSV; and Table 3A.5.1.4 PDF CSV)

Edition:
- Fourth Edition