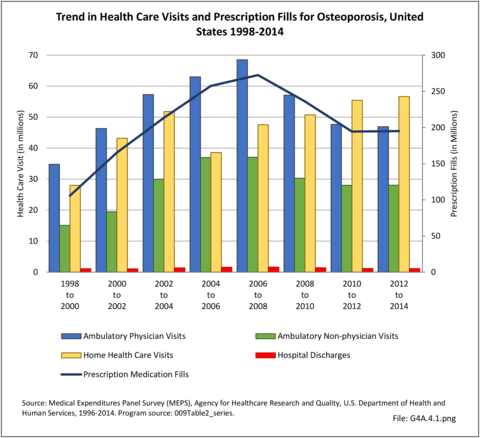
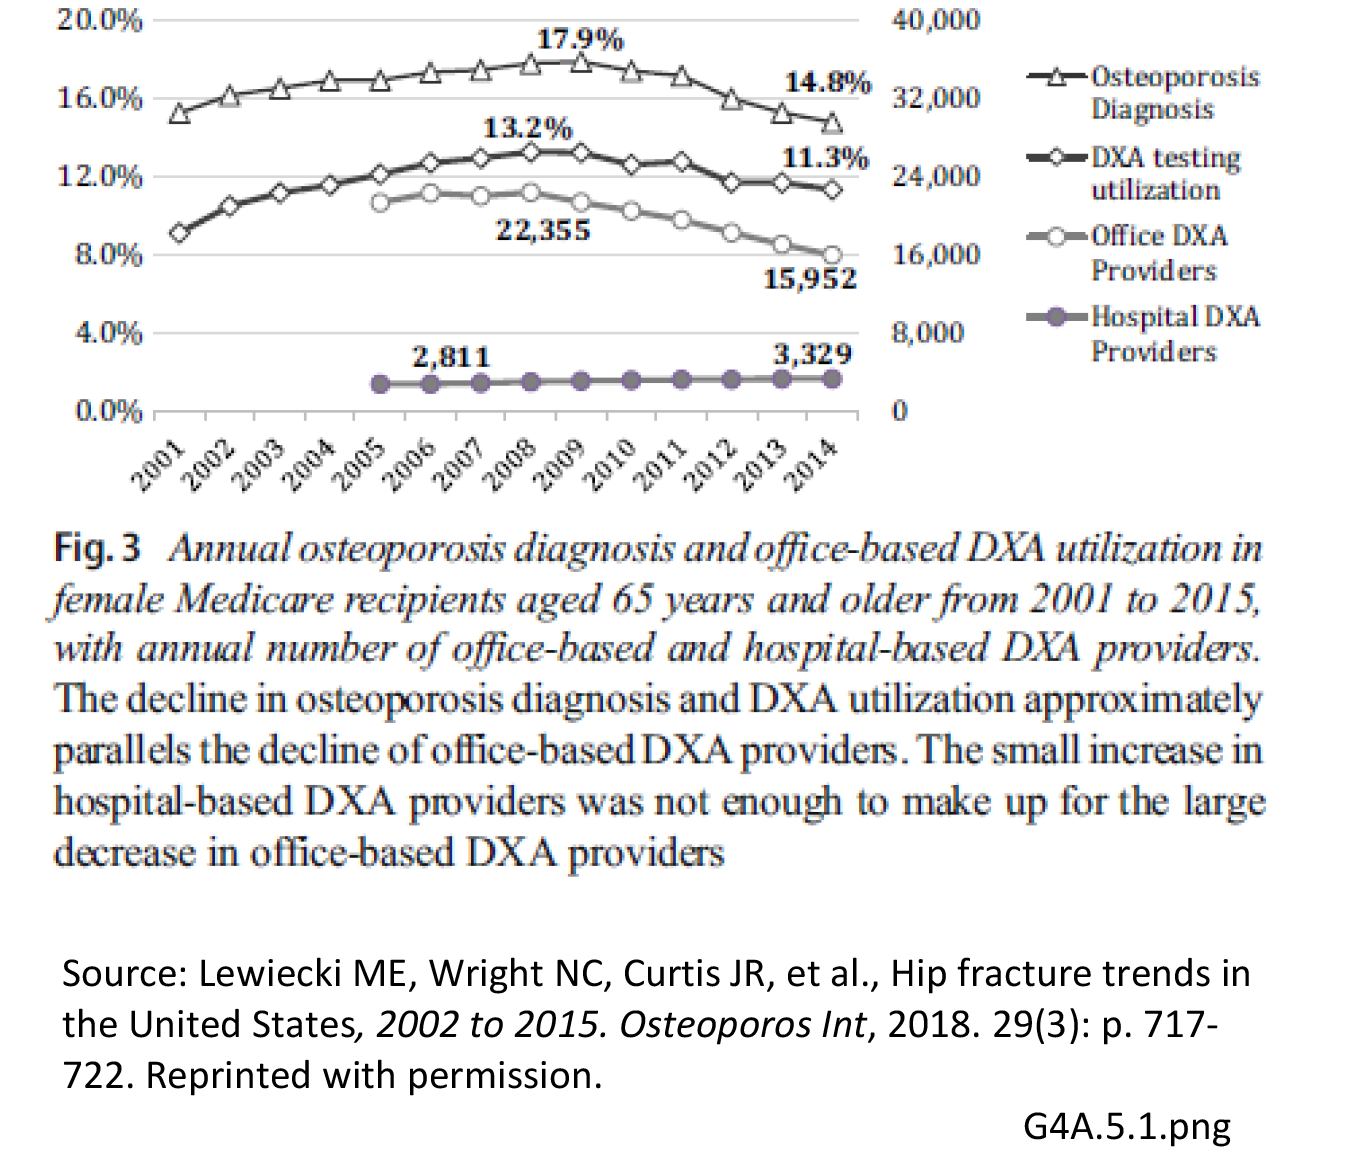
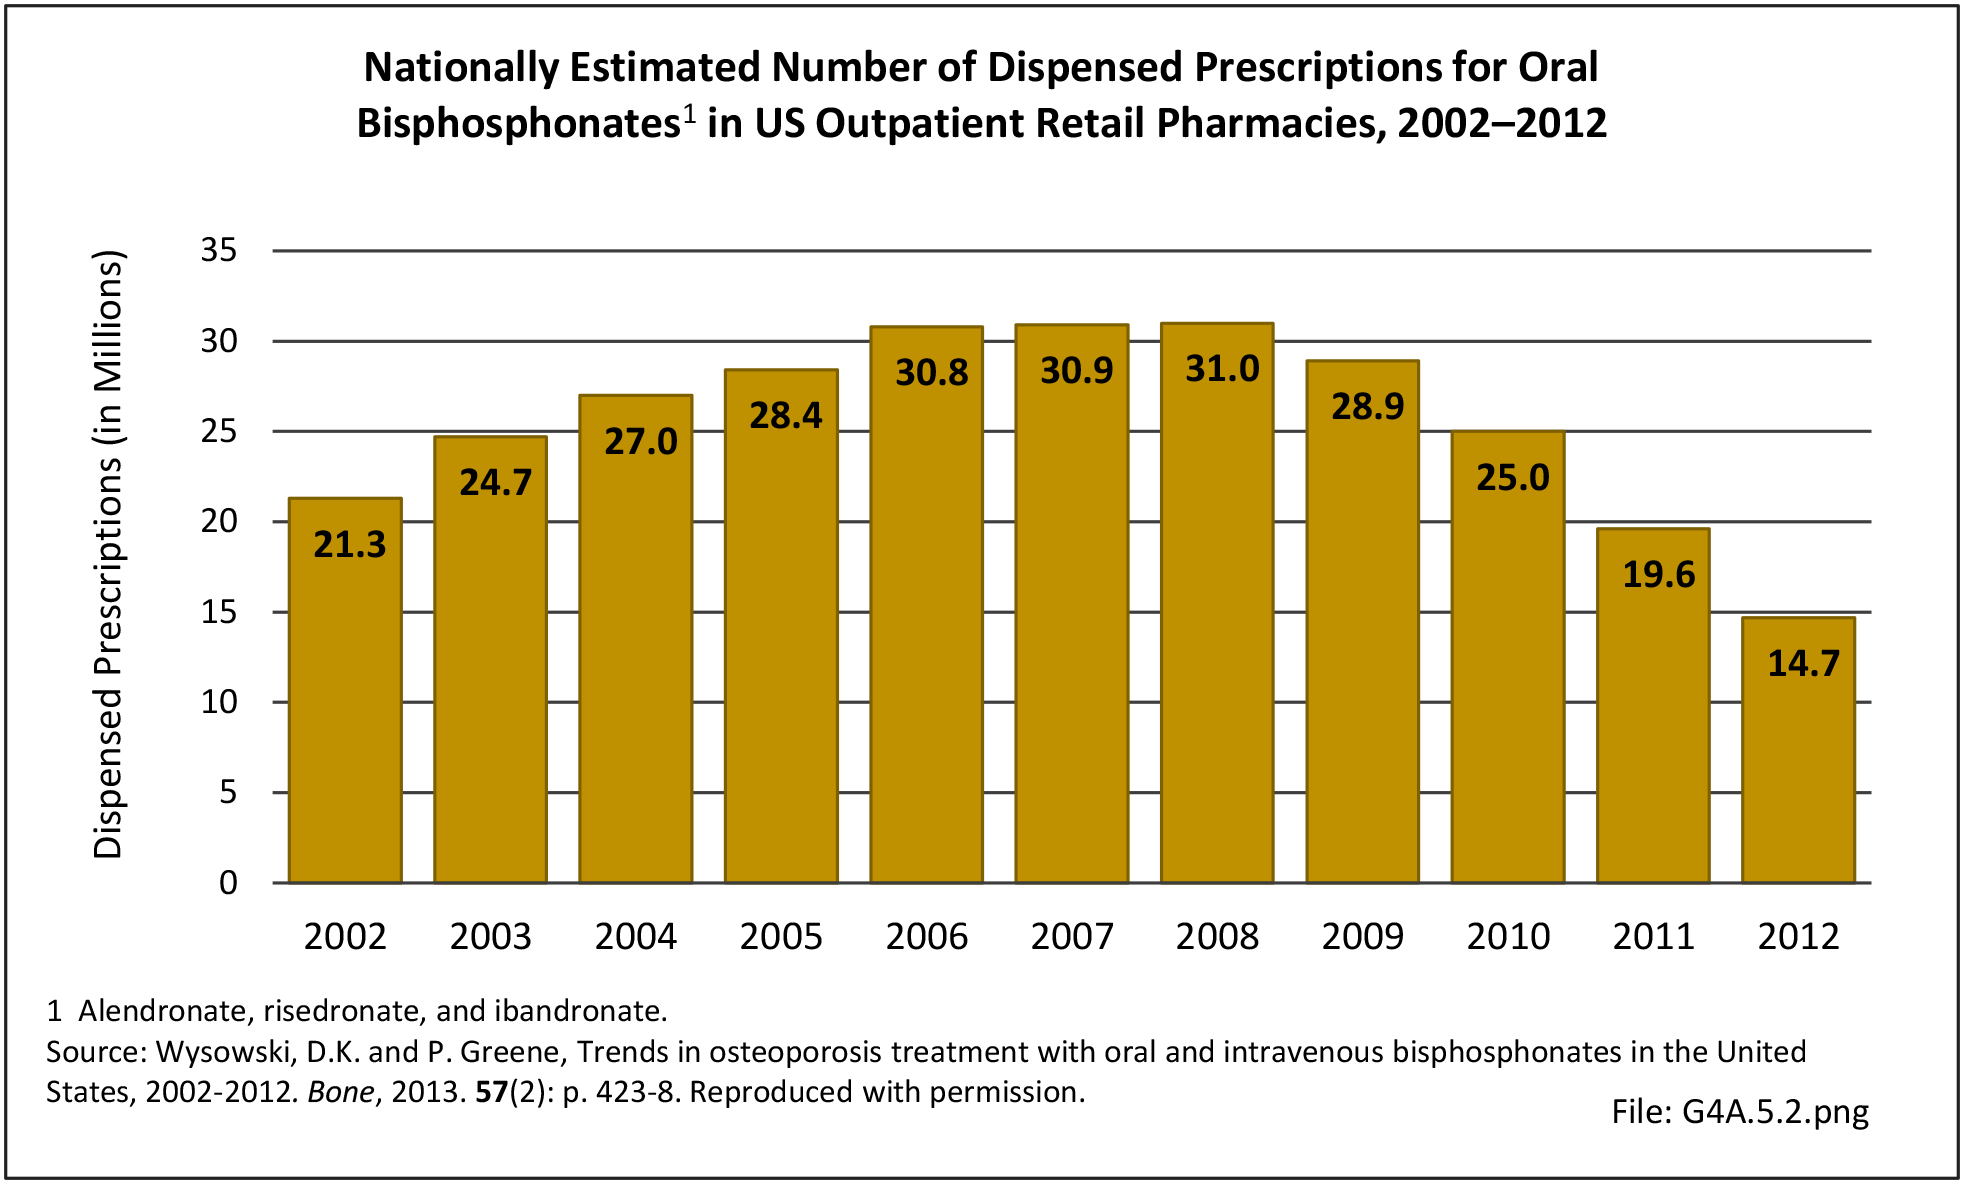
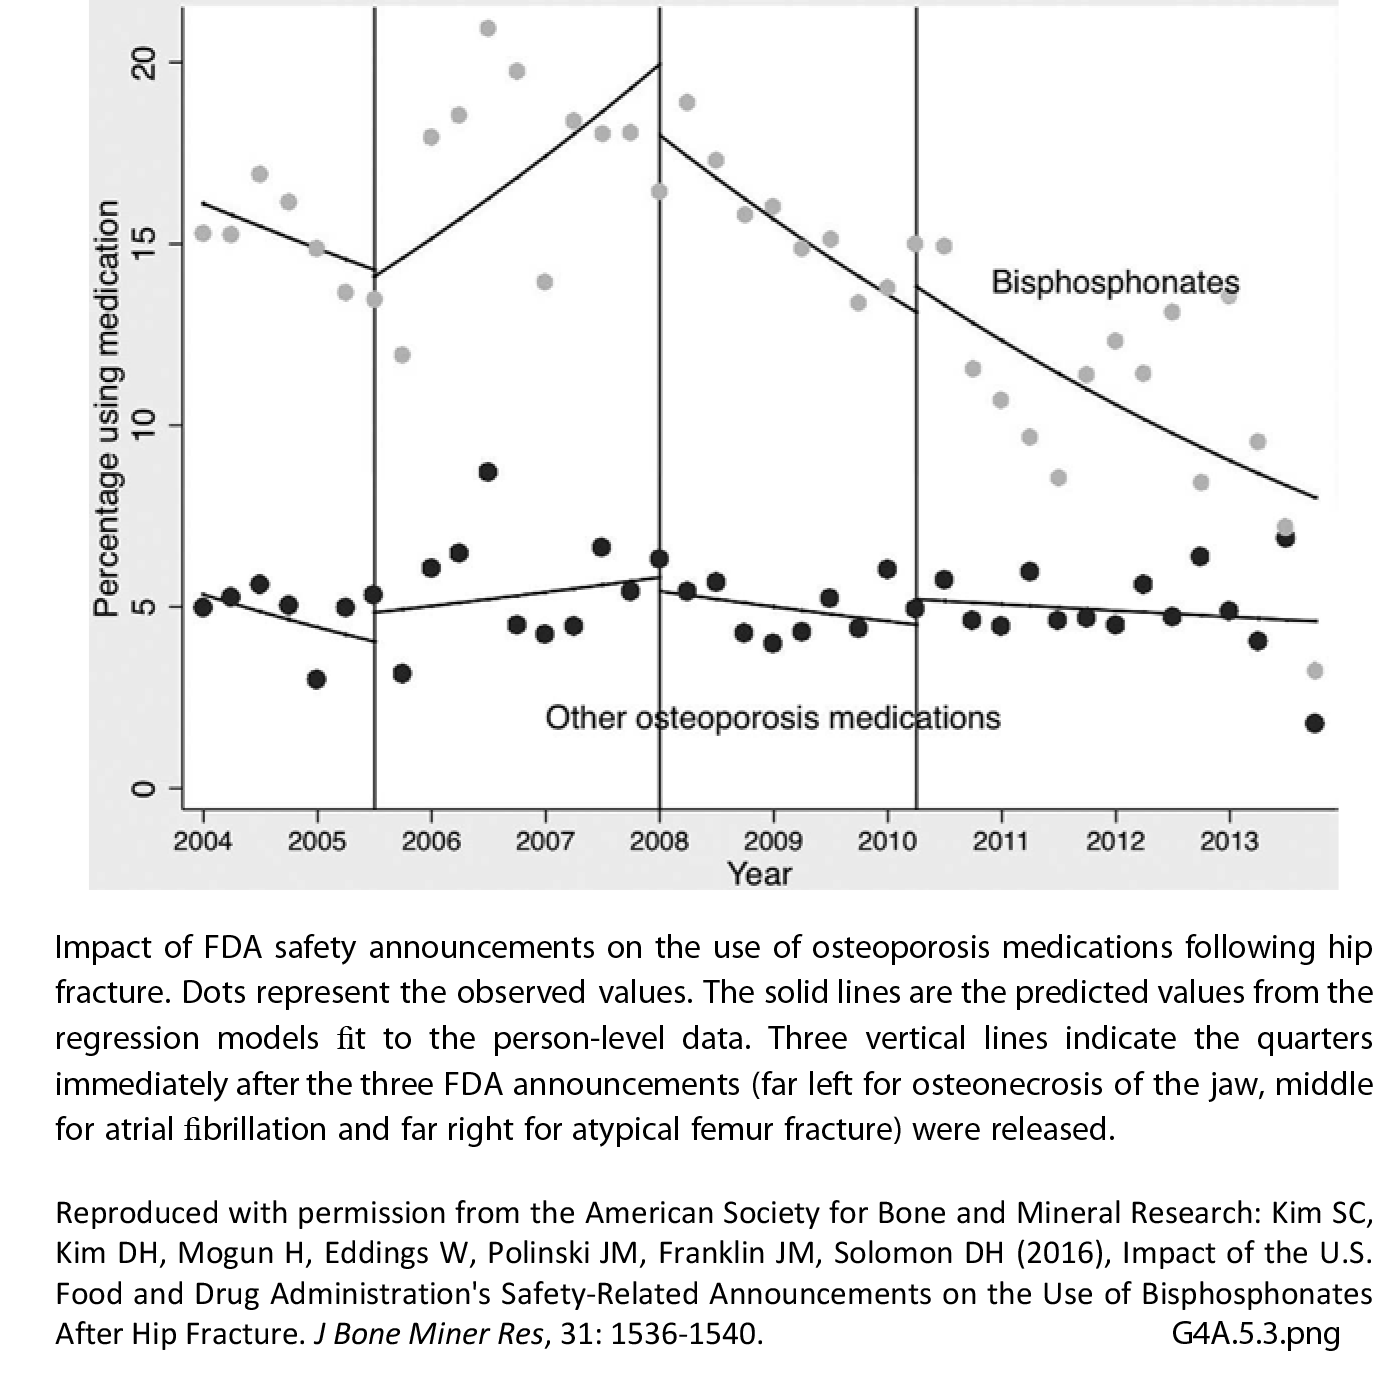
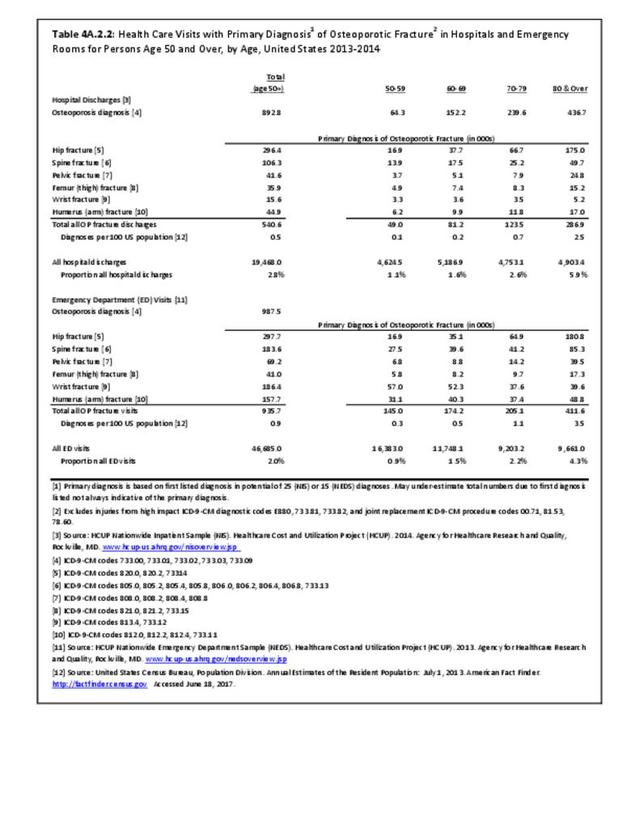
Despite year-to-year rise and fall in healthcare treatments and visits for osteoporosis, total healthcare visits to physicians, ambulatory nonphysician healthcare sites, and for home health services, along with the number of prescriptions filled, have each remained relatively steady over the past 15 years (2000 to 2014). The general trend was a rising number of visits in the early 2000s, with a decline since about 2007. The exception is home health visits. (Reference Table 8.2.4 PDF CSV)
Direct Medical Costs
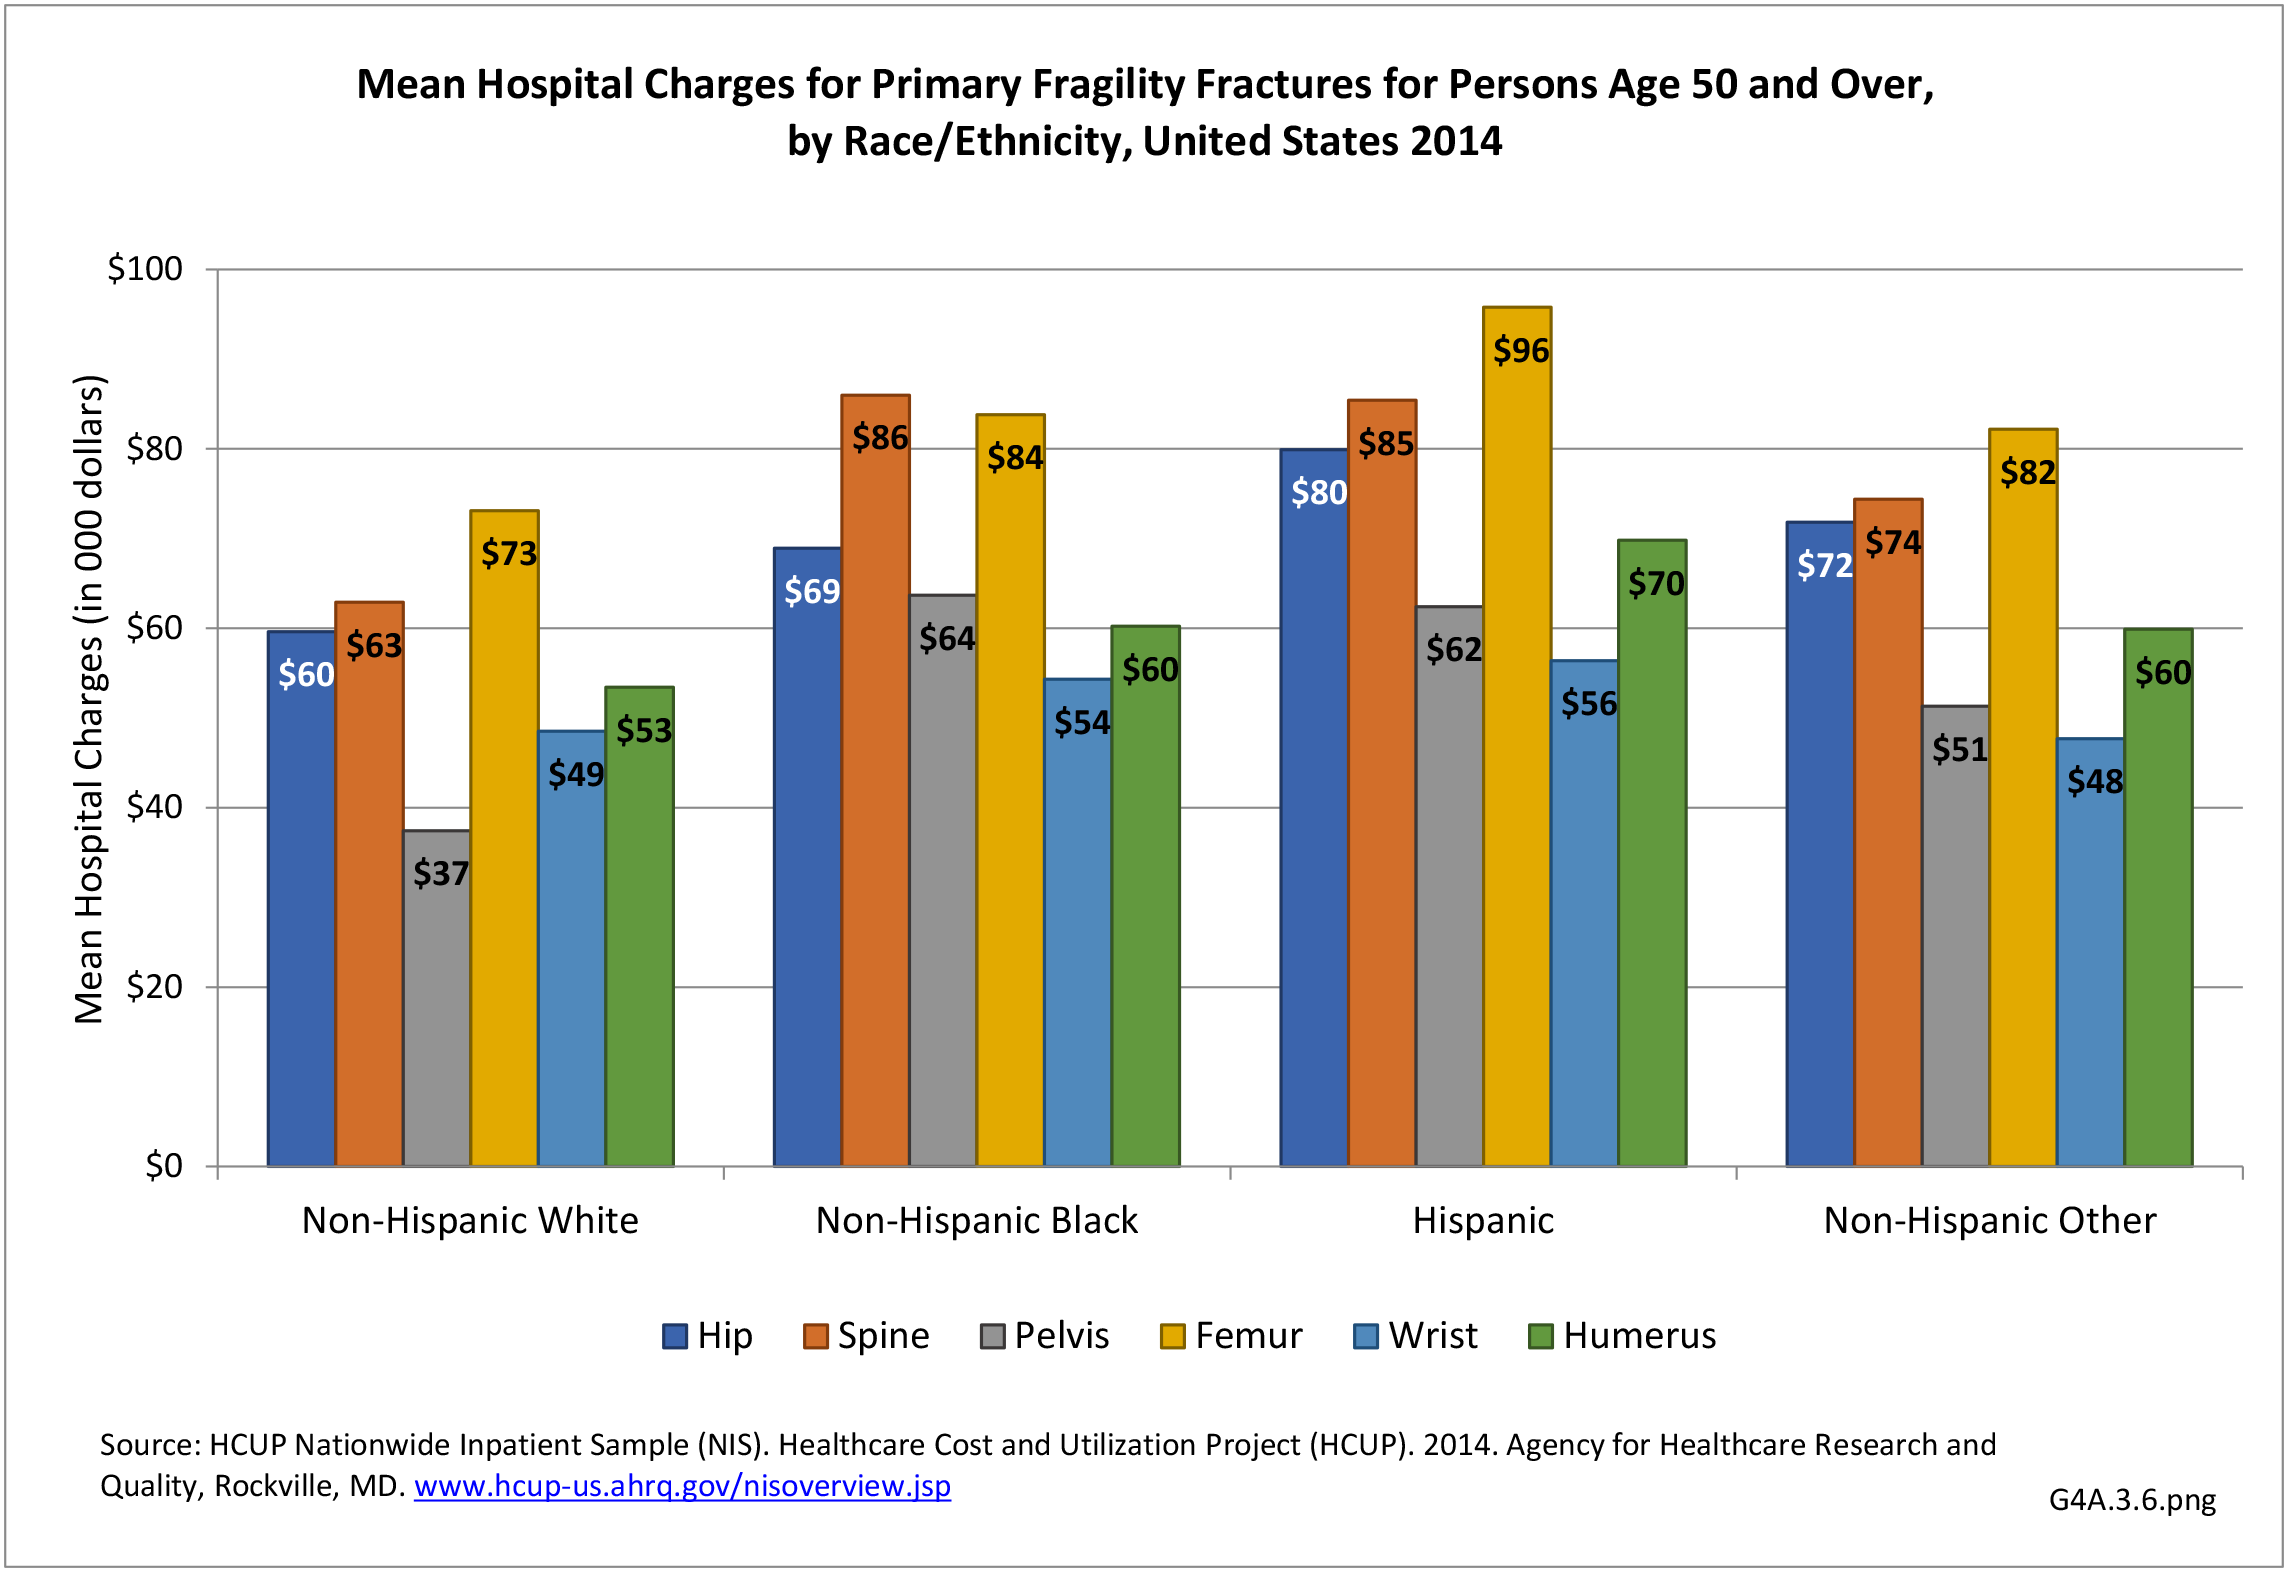
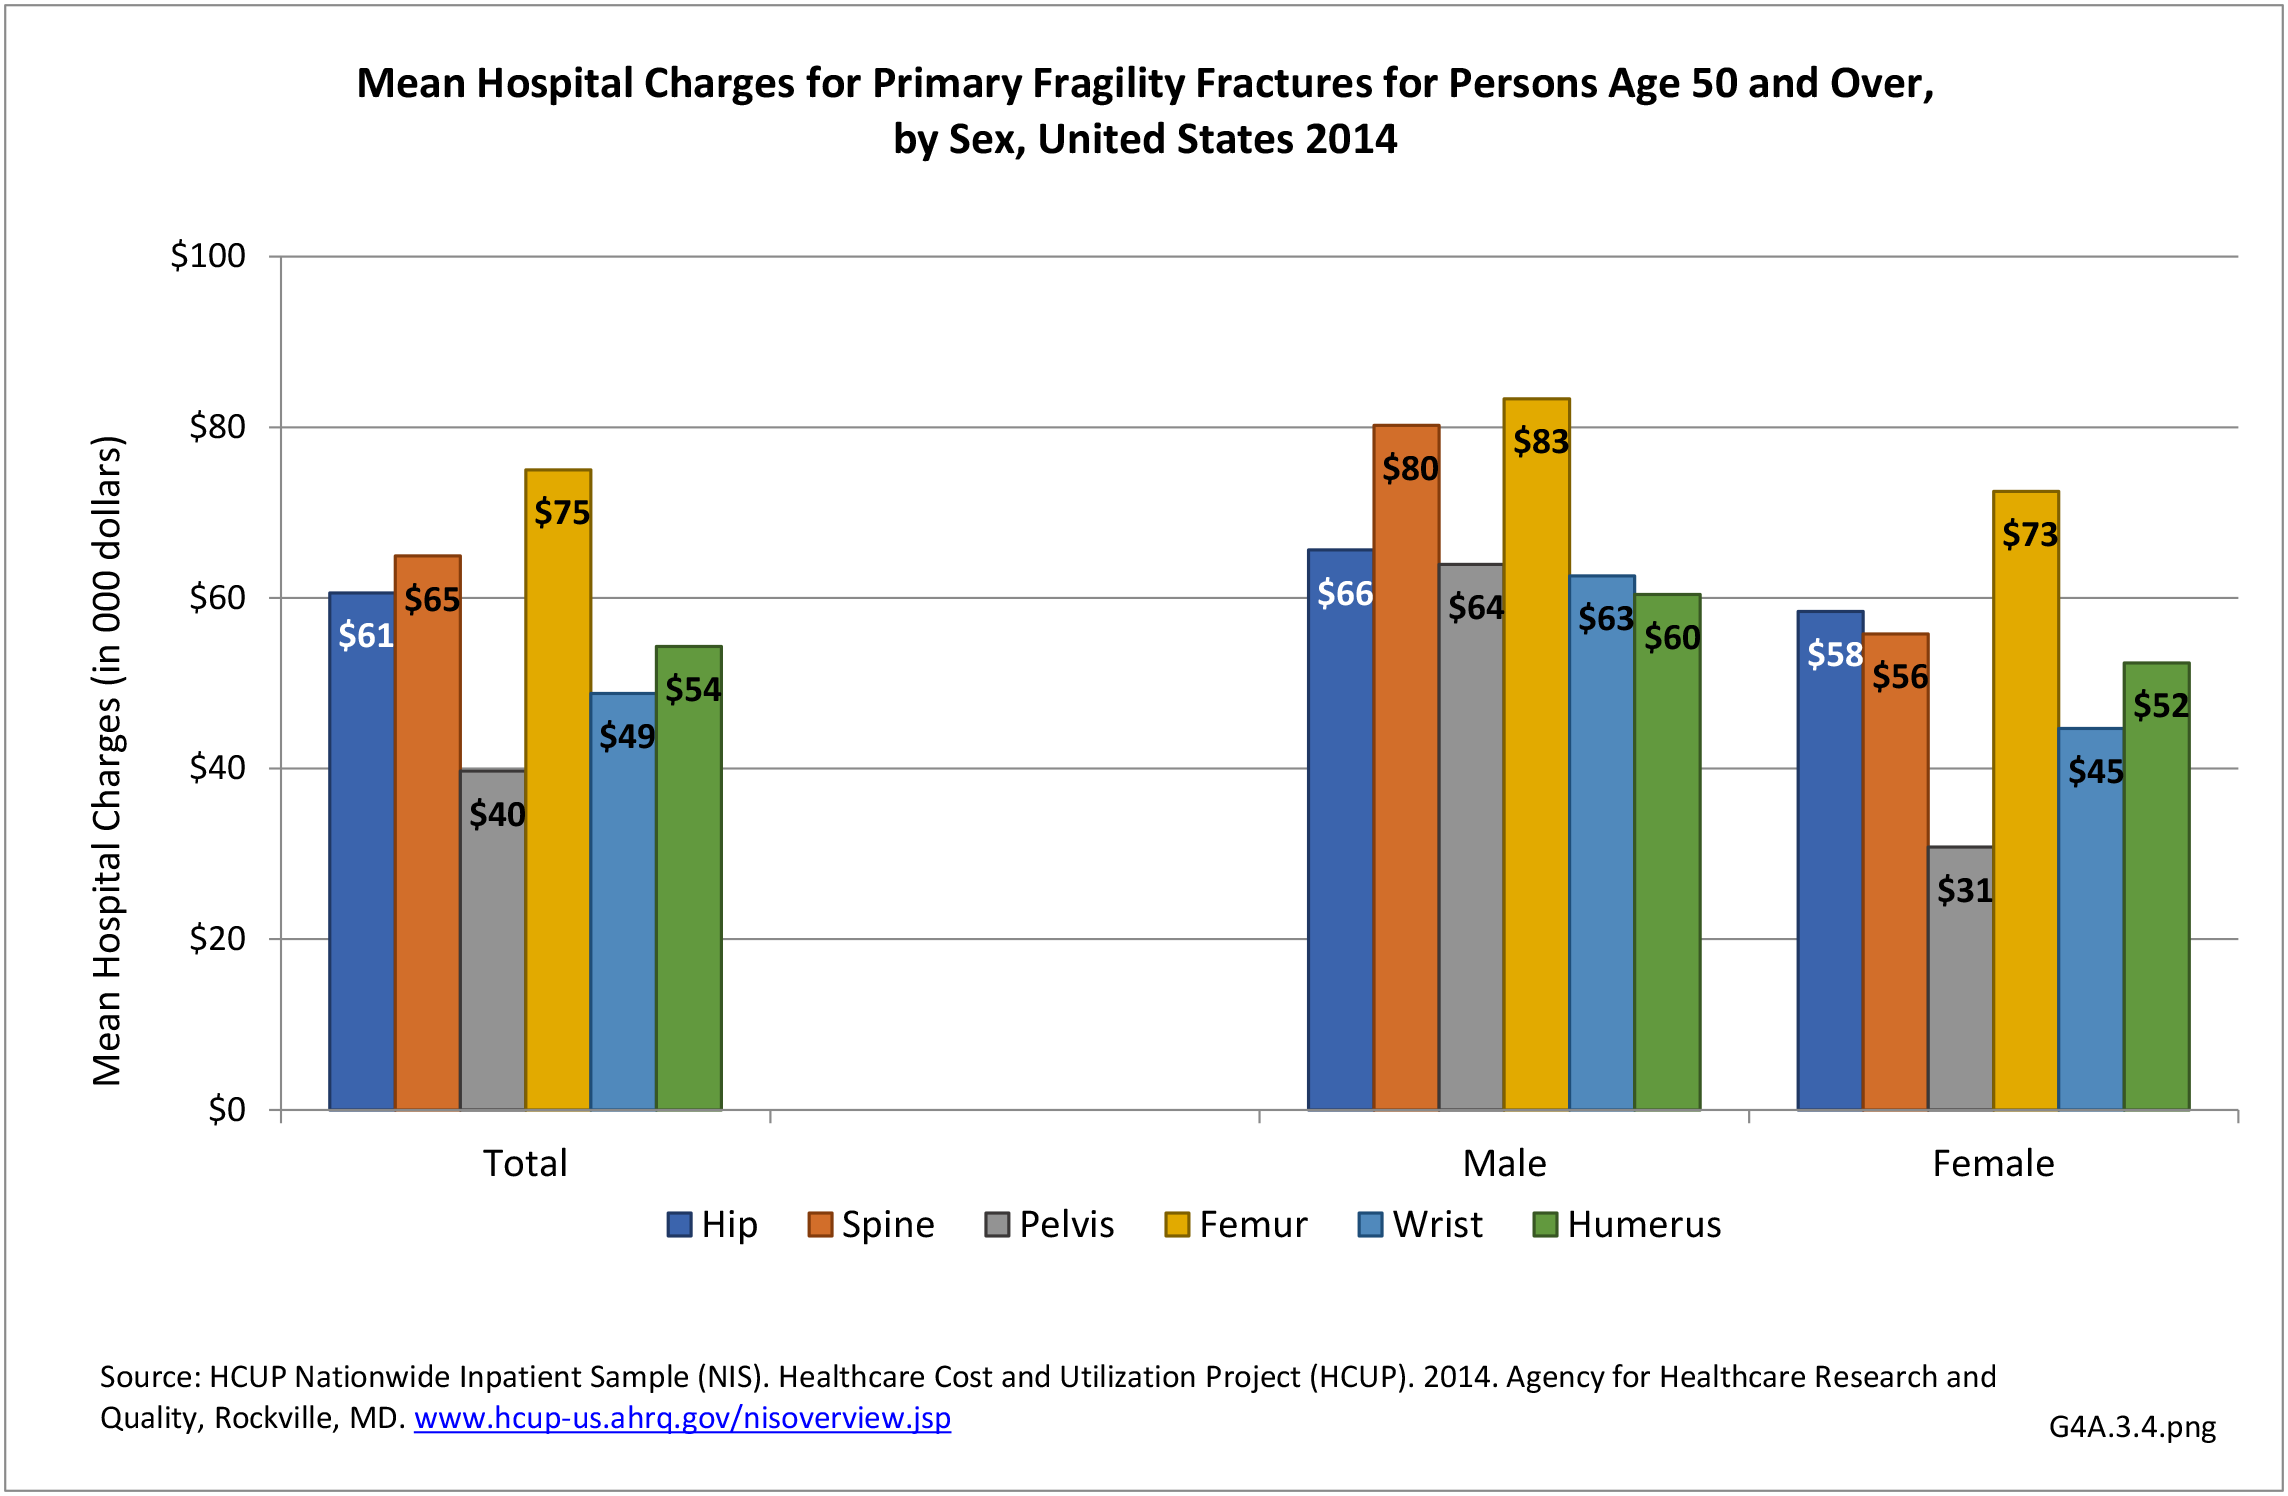
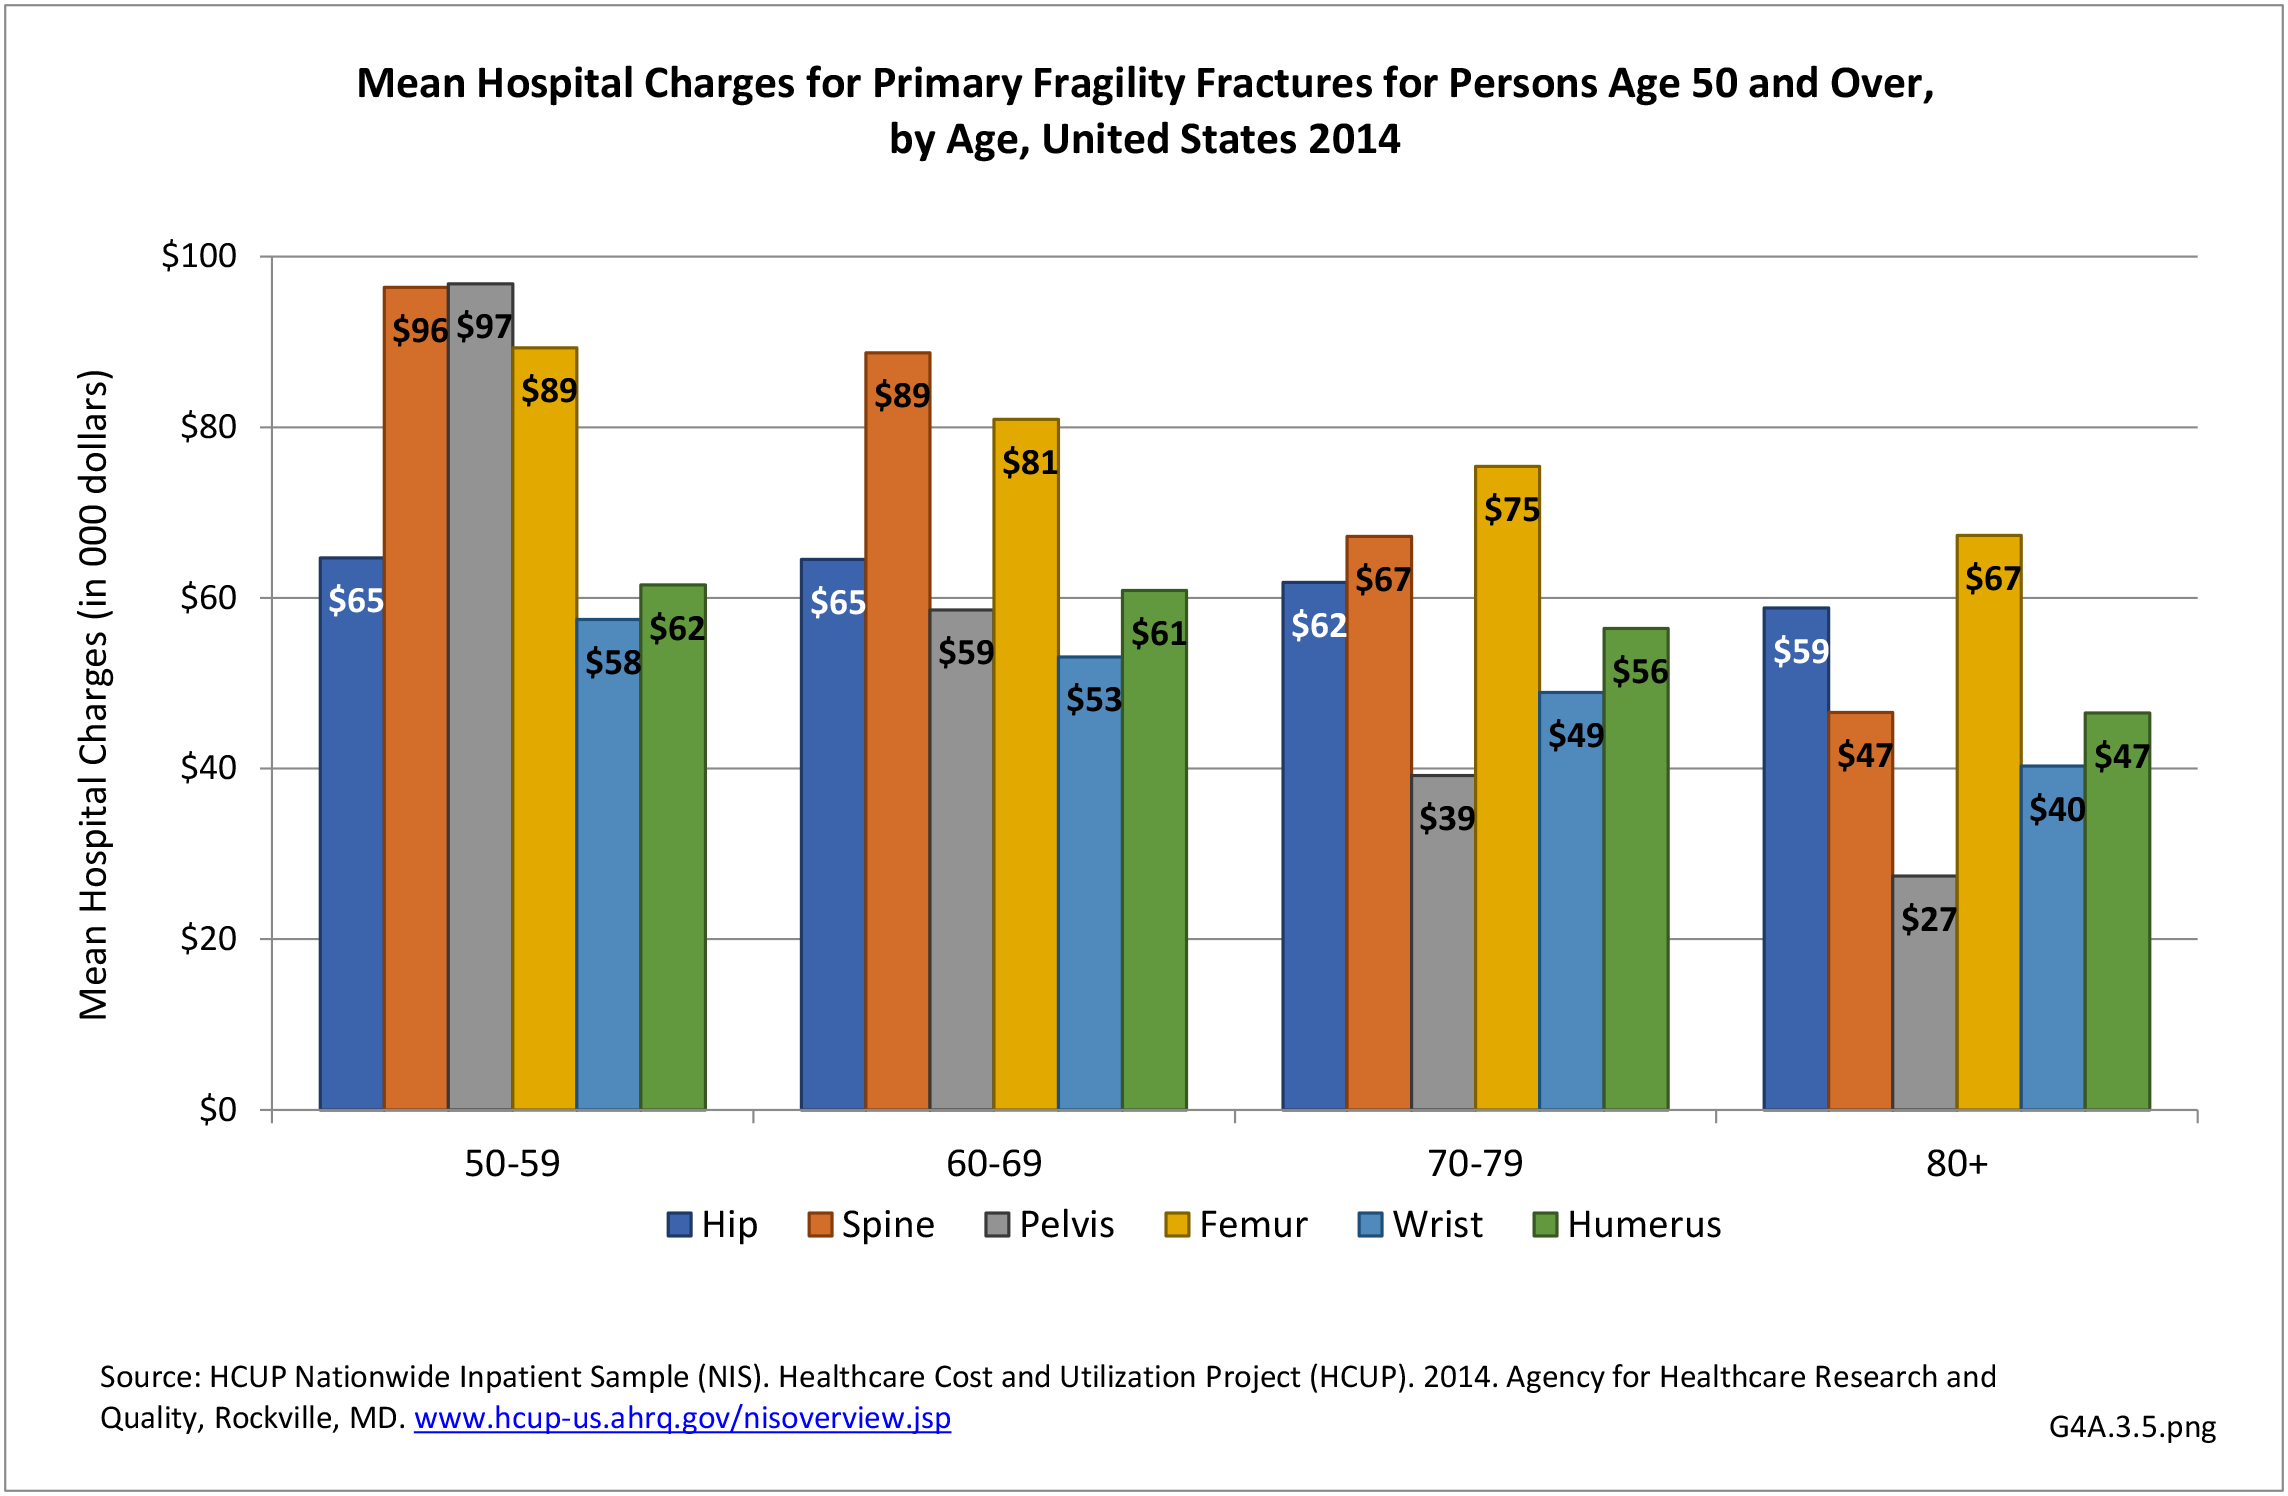
Medical costs reported in the Economic Cost chapter of this report, on which this section is based, are analyzed using the US Department of Health and Human Services, Agency for Healthcare Research and Quality, Medical Expenditures Panel Survey (MEPS) and capture four types of healthcare resources consumed: ambulatory visits (to both physicians and nonphysicians), prescription medications, home healthcare visits, hospital discharges, plus “residual” (all other types of care). Unlike the hospital charges discussed previously, the MEPS utilizes expenditures actually paid for healthcare by insurance companies and patients.
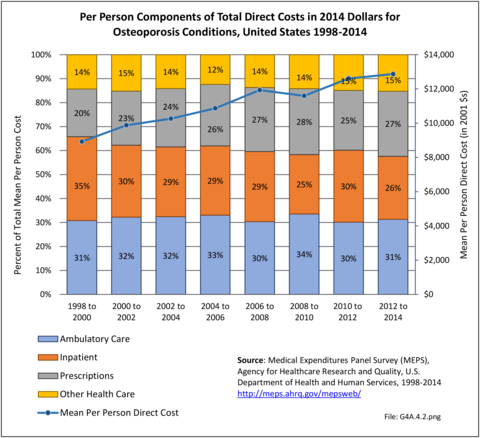
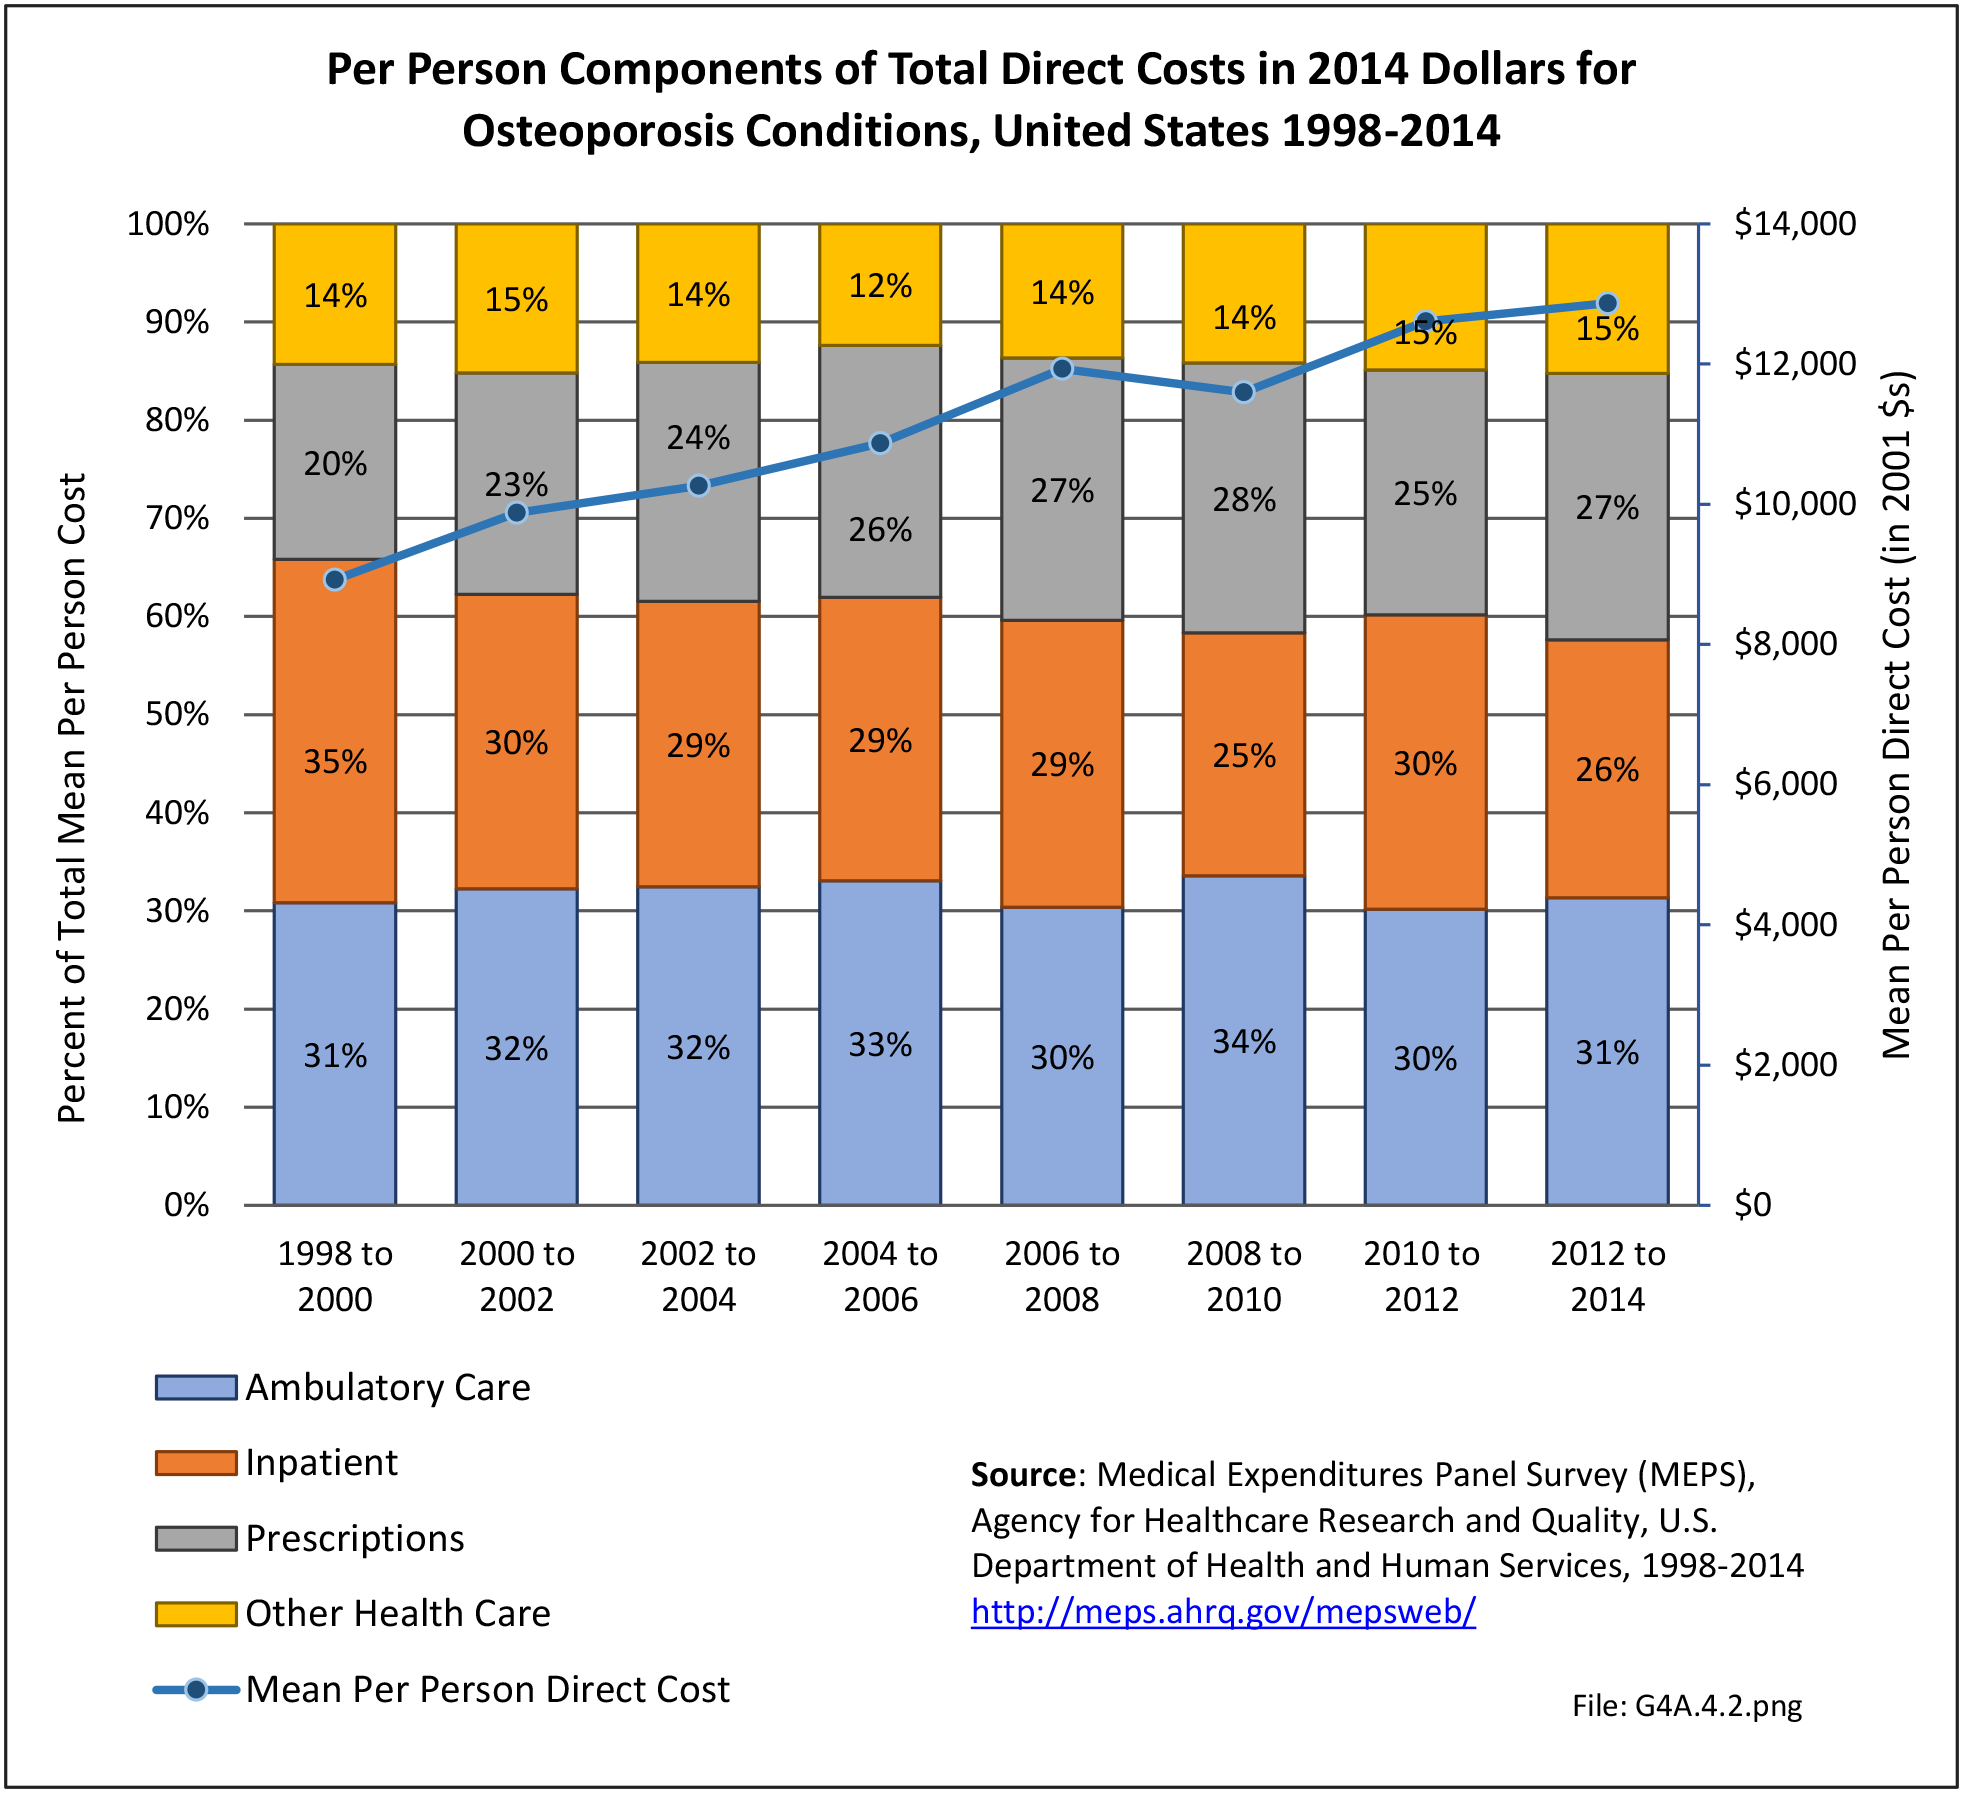
Overall, ambulatory care visits accounted for the largest share of per-person direct cost for people with an osteoporosis condition along with other conditions. At an average cost of $4,035 per person on average 2012-2014, ambulatory cost of care increased 47% from 1998 to 2014 in 2014 dollars. However, the share of per person total direct cost for osteoporosis ambulatory care remained constant at 31%. The mean per-person cost for inpatient care, after dropping for several years, was slightly higher at $3,381 in 2012-2014 than in 1998-2000 in 2014 dollars. The share of total direct costs for inpatient care dropped by 25% between 1998-2000 and 2012-2014. The greatest change in average per-person cost was for prescriptions, rising from $1,771 in 1998-2000 to $3,494 in 2012-2014, in 2014 dollars, an increase of 97%. The share of cost for prescriptions rose 37%, from 20% to 27%. (Reference Table 8.4.4 PDF CSV)
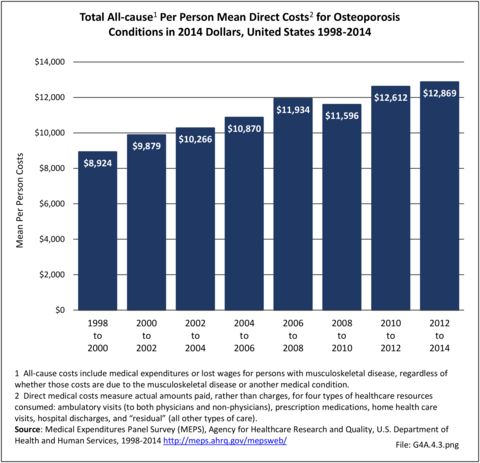
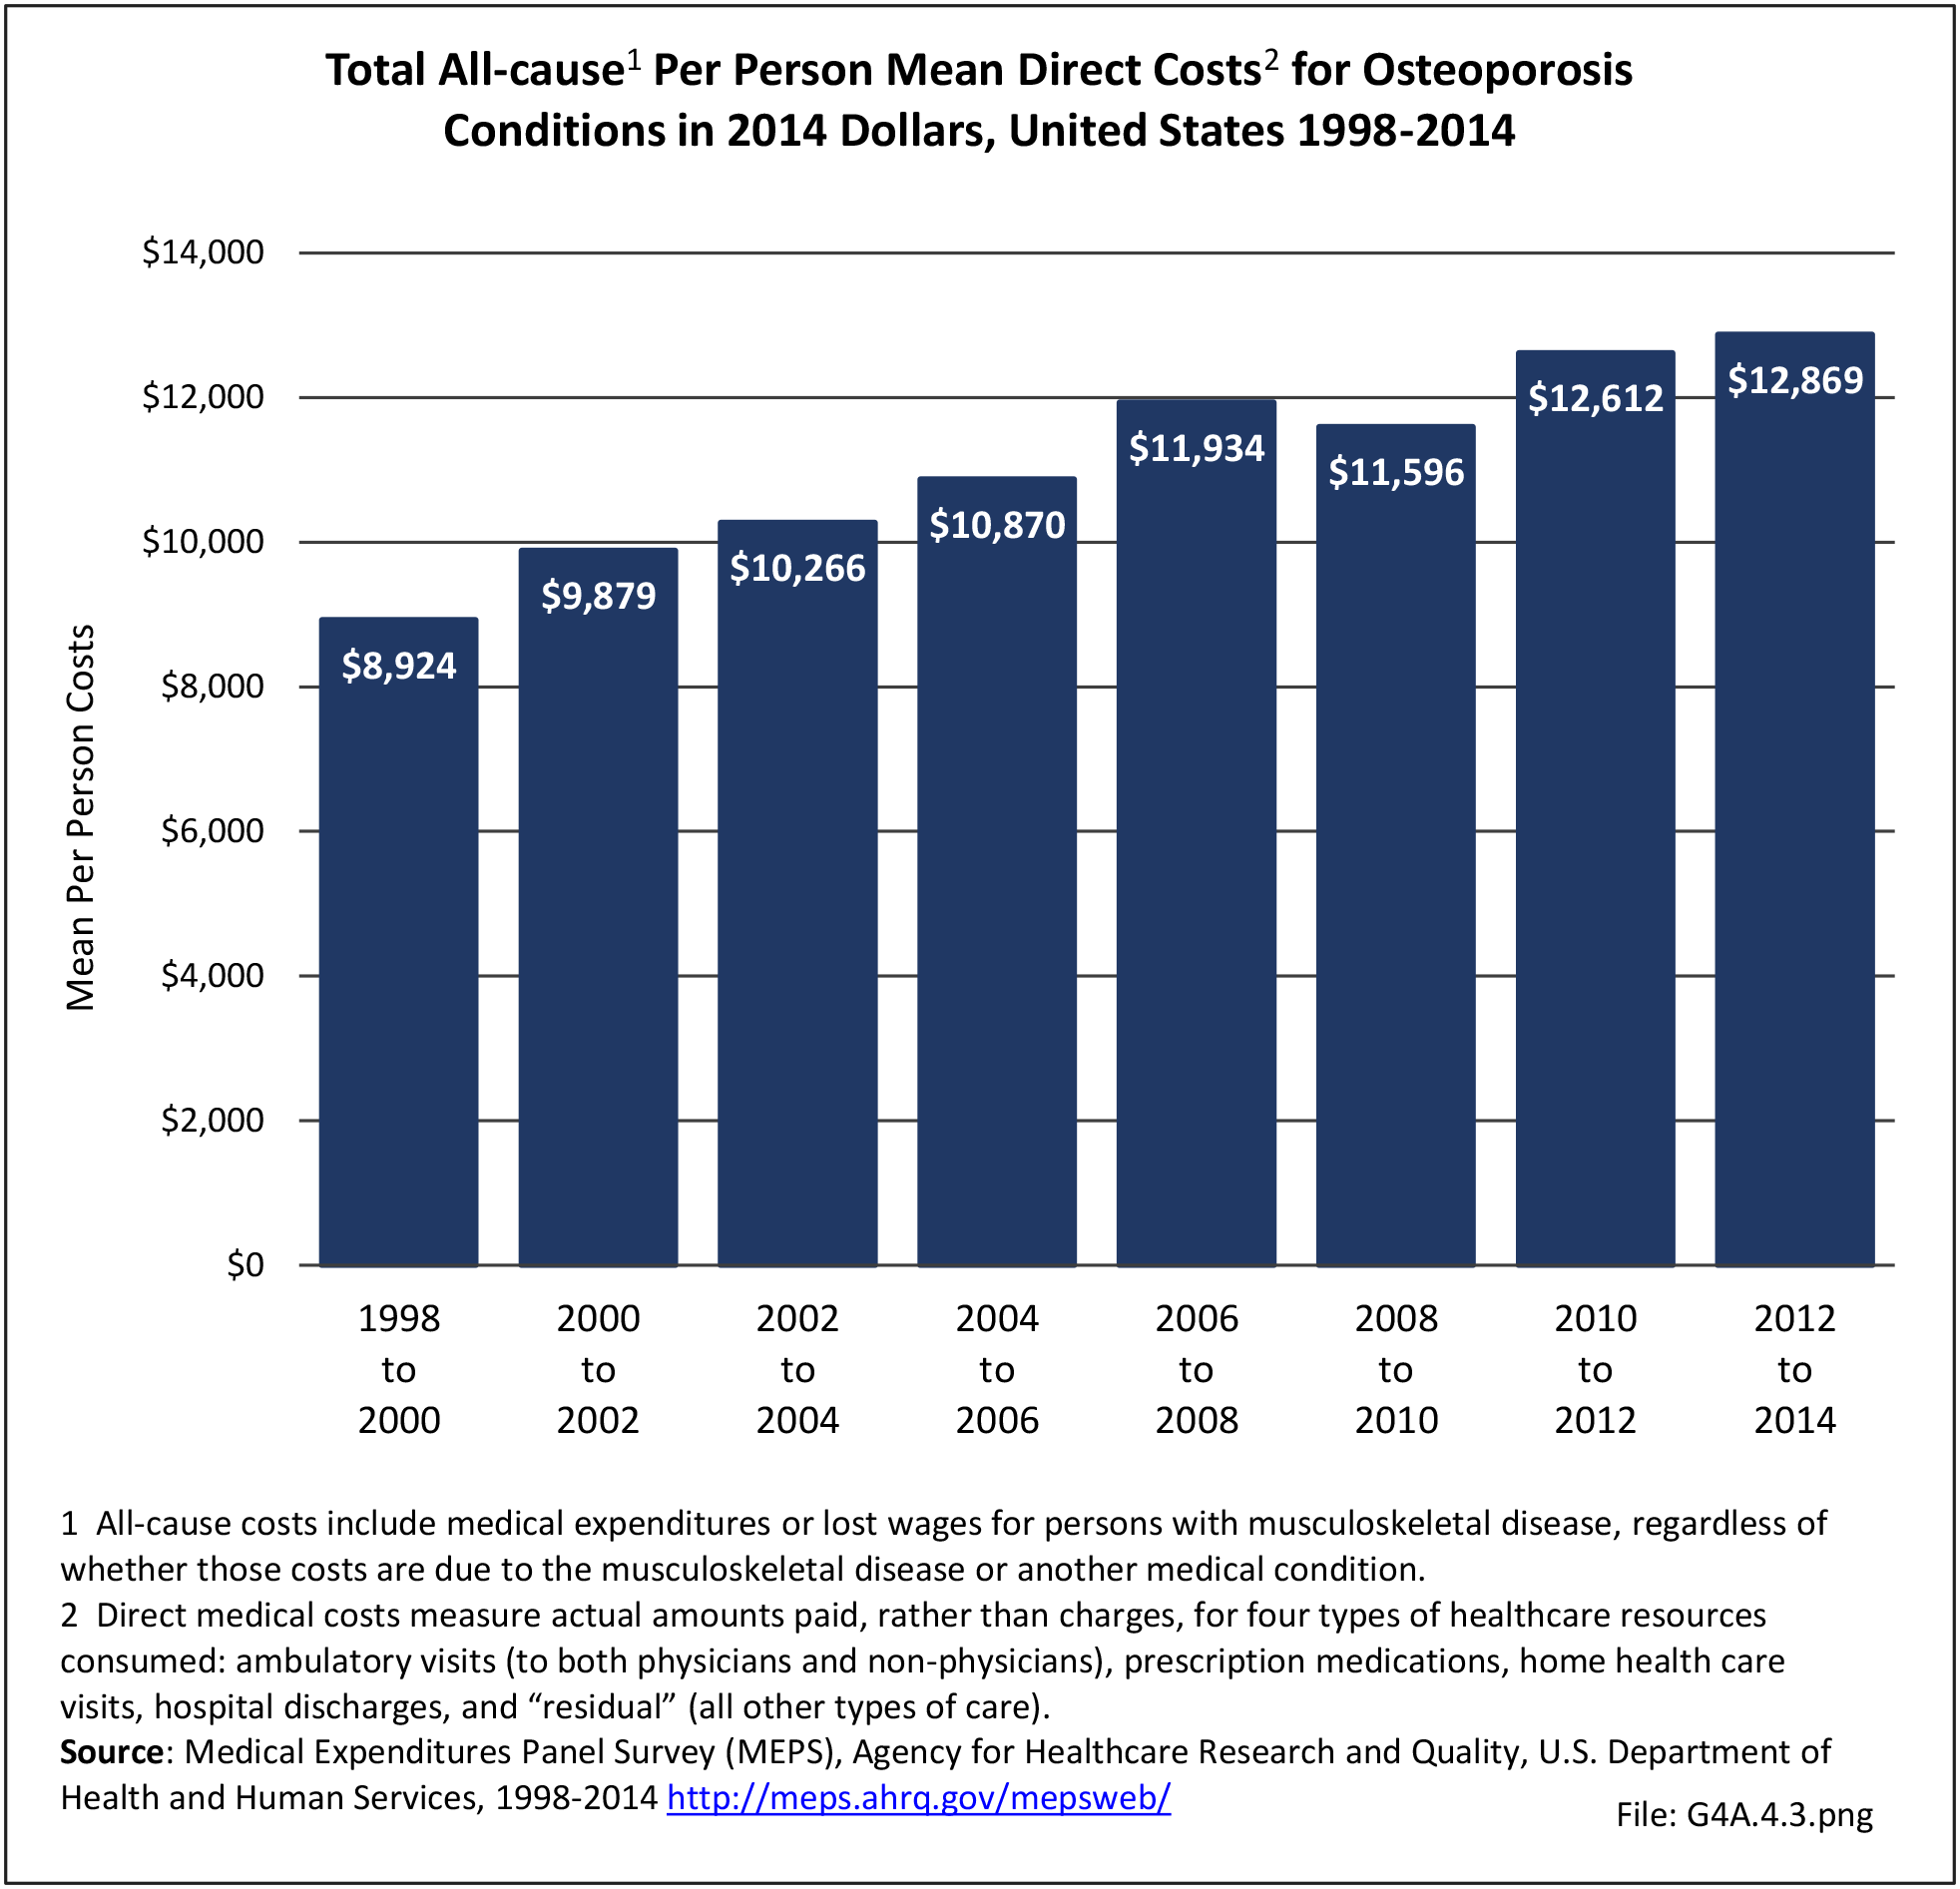
Total direct per-person healthcare costs in 2012-2014 for people with an osteoporosis condition along with other conditions were $12,869, an increase of 44% since 1998-2000 in 2014 dollars. Incremental direct per-person costs, those costs most likely attributable to an osteoporosis condition and a more useful statistic, cannot be calculated for osteoporosis because of the small sample size. (Reference Table 8.6.4 PDF CSV)
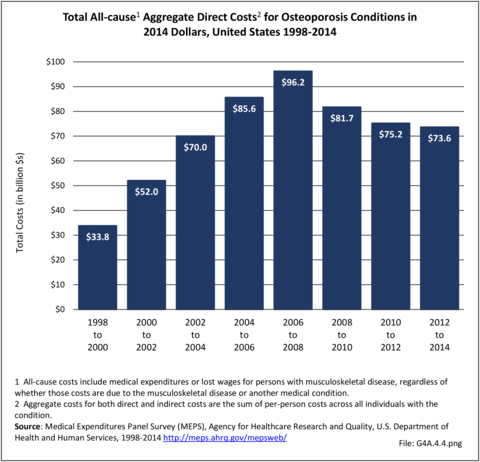
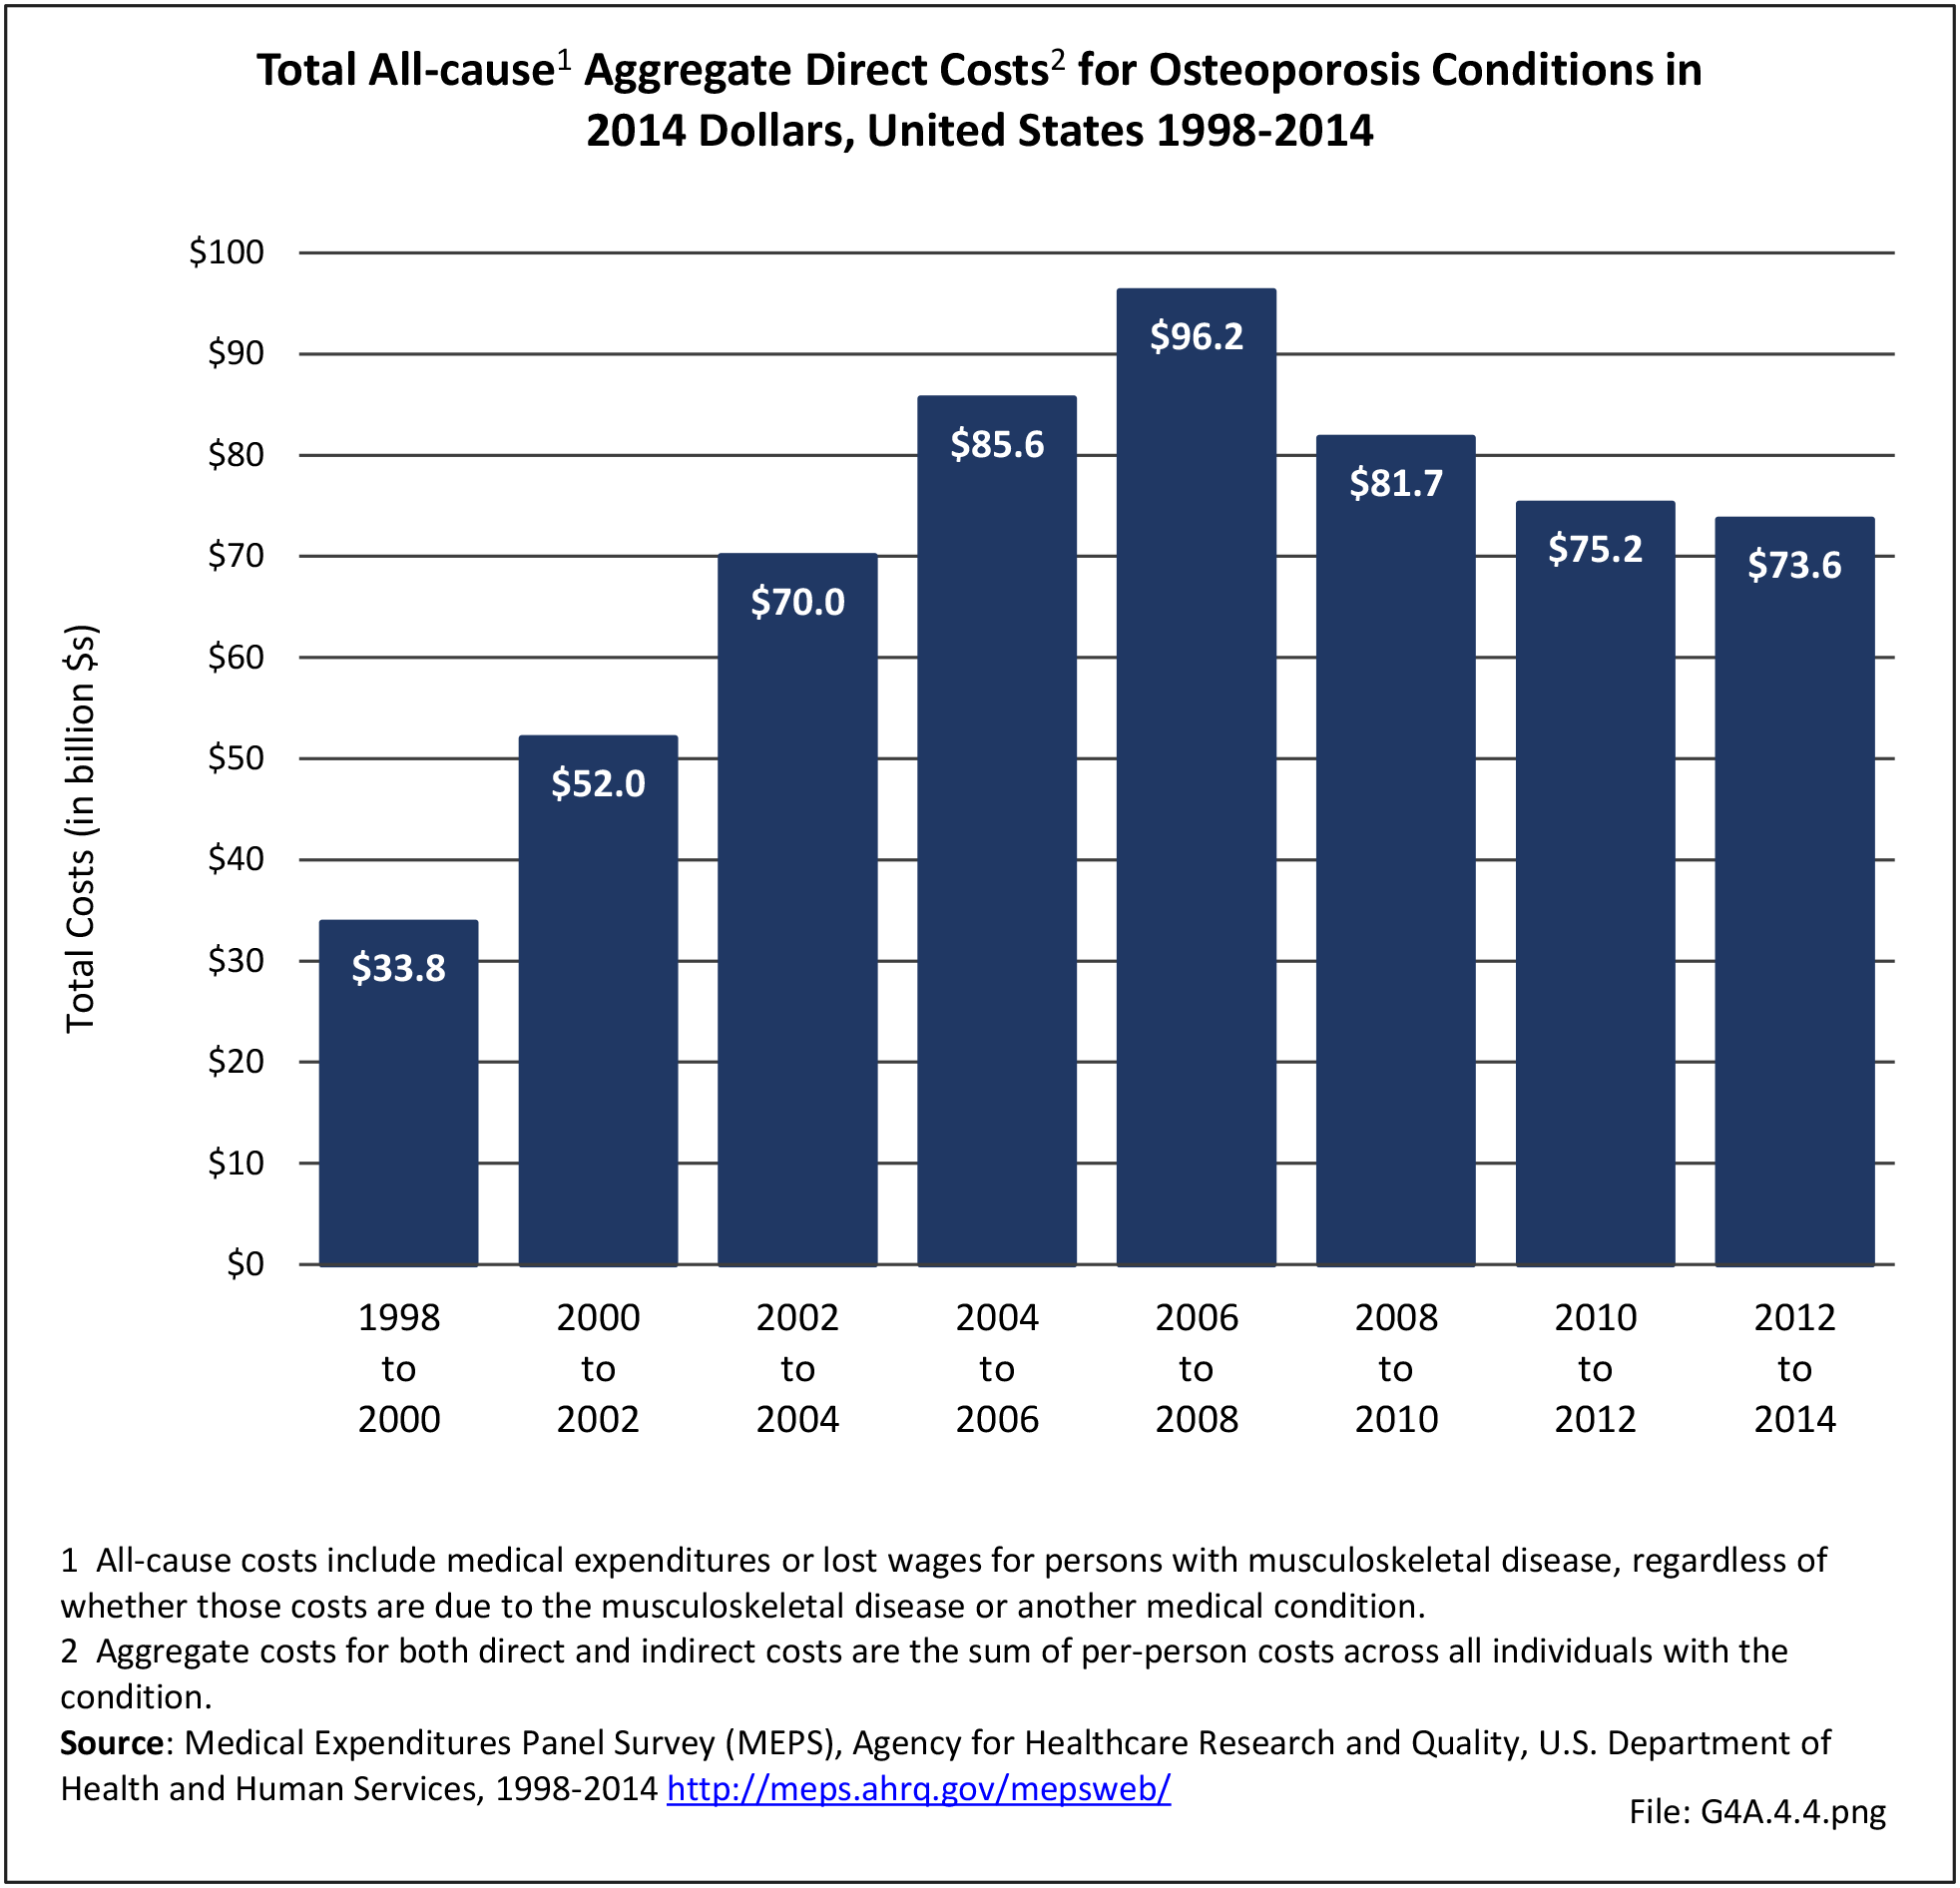
Total aggregate direct costs for all persons were $73.6 billion in 2012-2014, a rise of 118% from the $28.1 billion in 1998-2000, in 2014 dollars. (Reference Table 8.6.4 PDF CSV)
Indirect Costs (Society/Employers)
Indirect costs associated with lost wages for people ages 18 to 64 years are not calculated for those with an osteoporosis condition. Osteoporosis is rarely cited as a reason for lost workdays or bed days, in part because of the older age of the most commonly affected adults. However, approximately 50% of people with hip fractures do not regain their prior activity level, leading to societal costs for added care, particularly among caregivers whose income may be reduced due to lost workdays and productivity, as well as physical therapy, transit assistance, and inhome care. Similarly, vertebral compression fractures due to osteoporosis contribute to spinal deformity, reduced mobility, and the need for assistance with activities of daily living, further increasing indirect societal costs.
Edition:
- Fourth Edition

