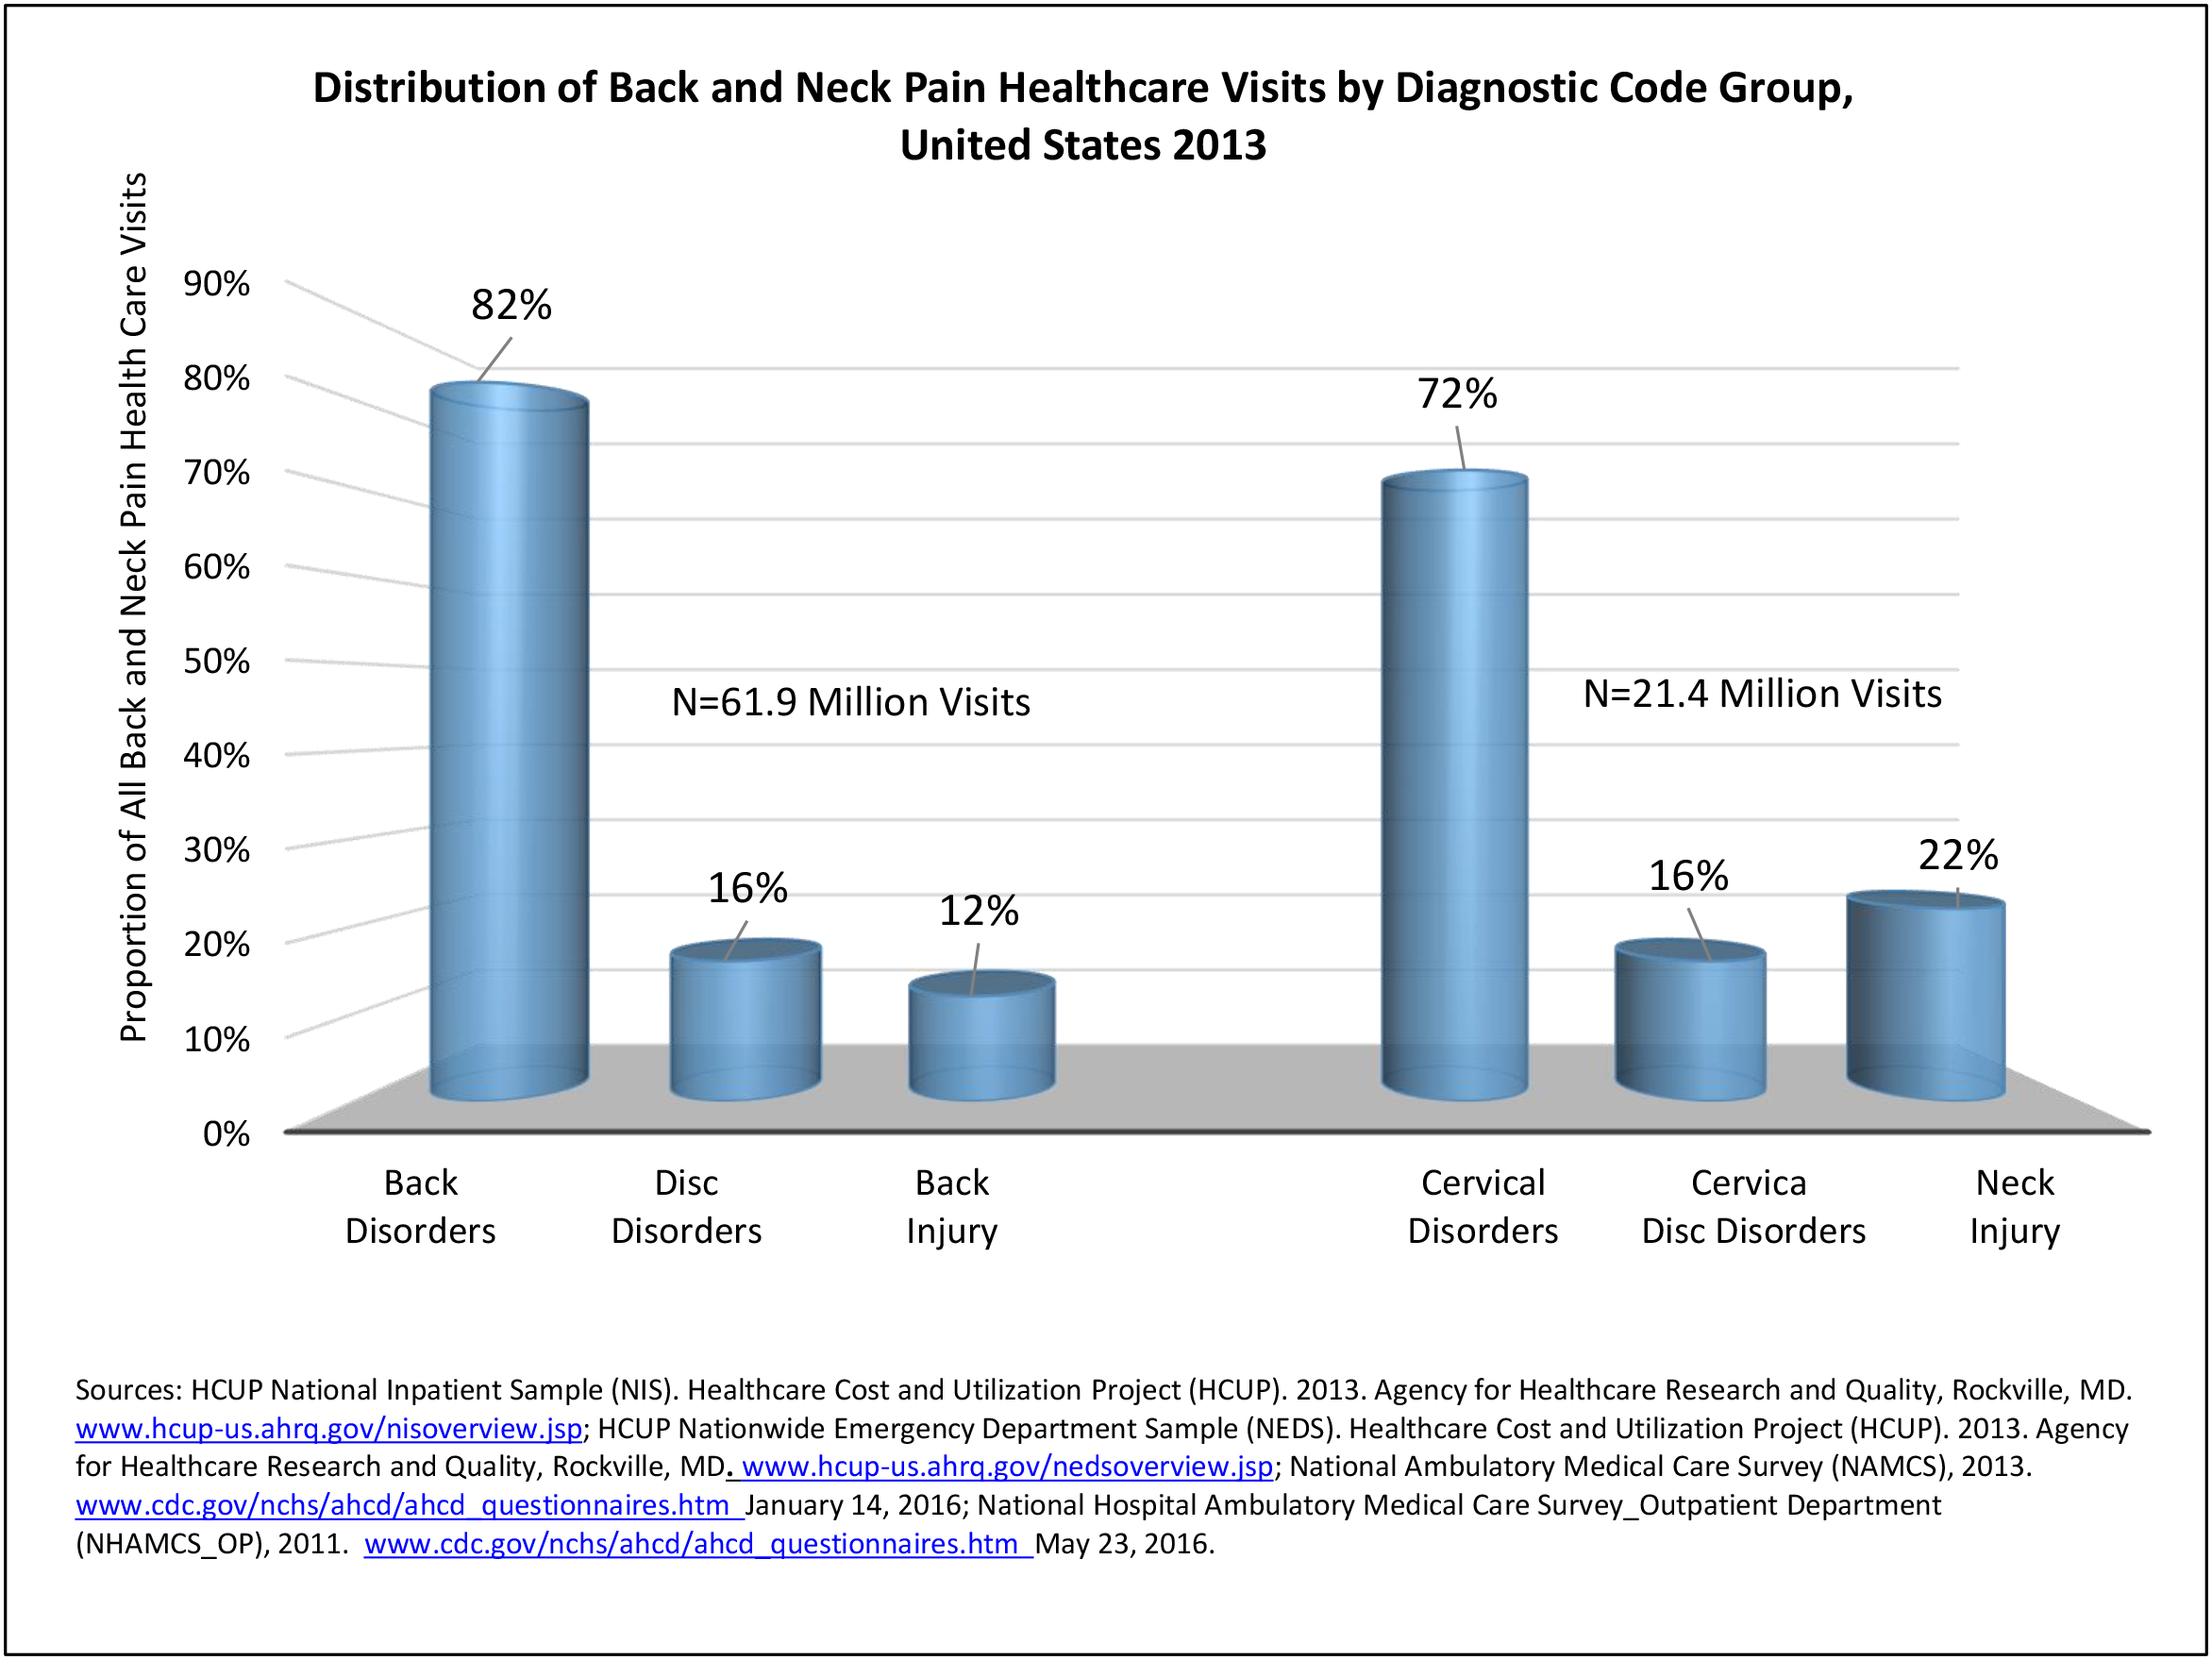
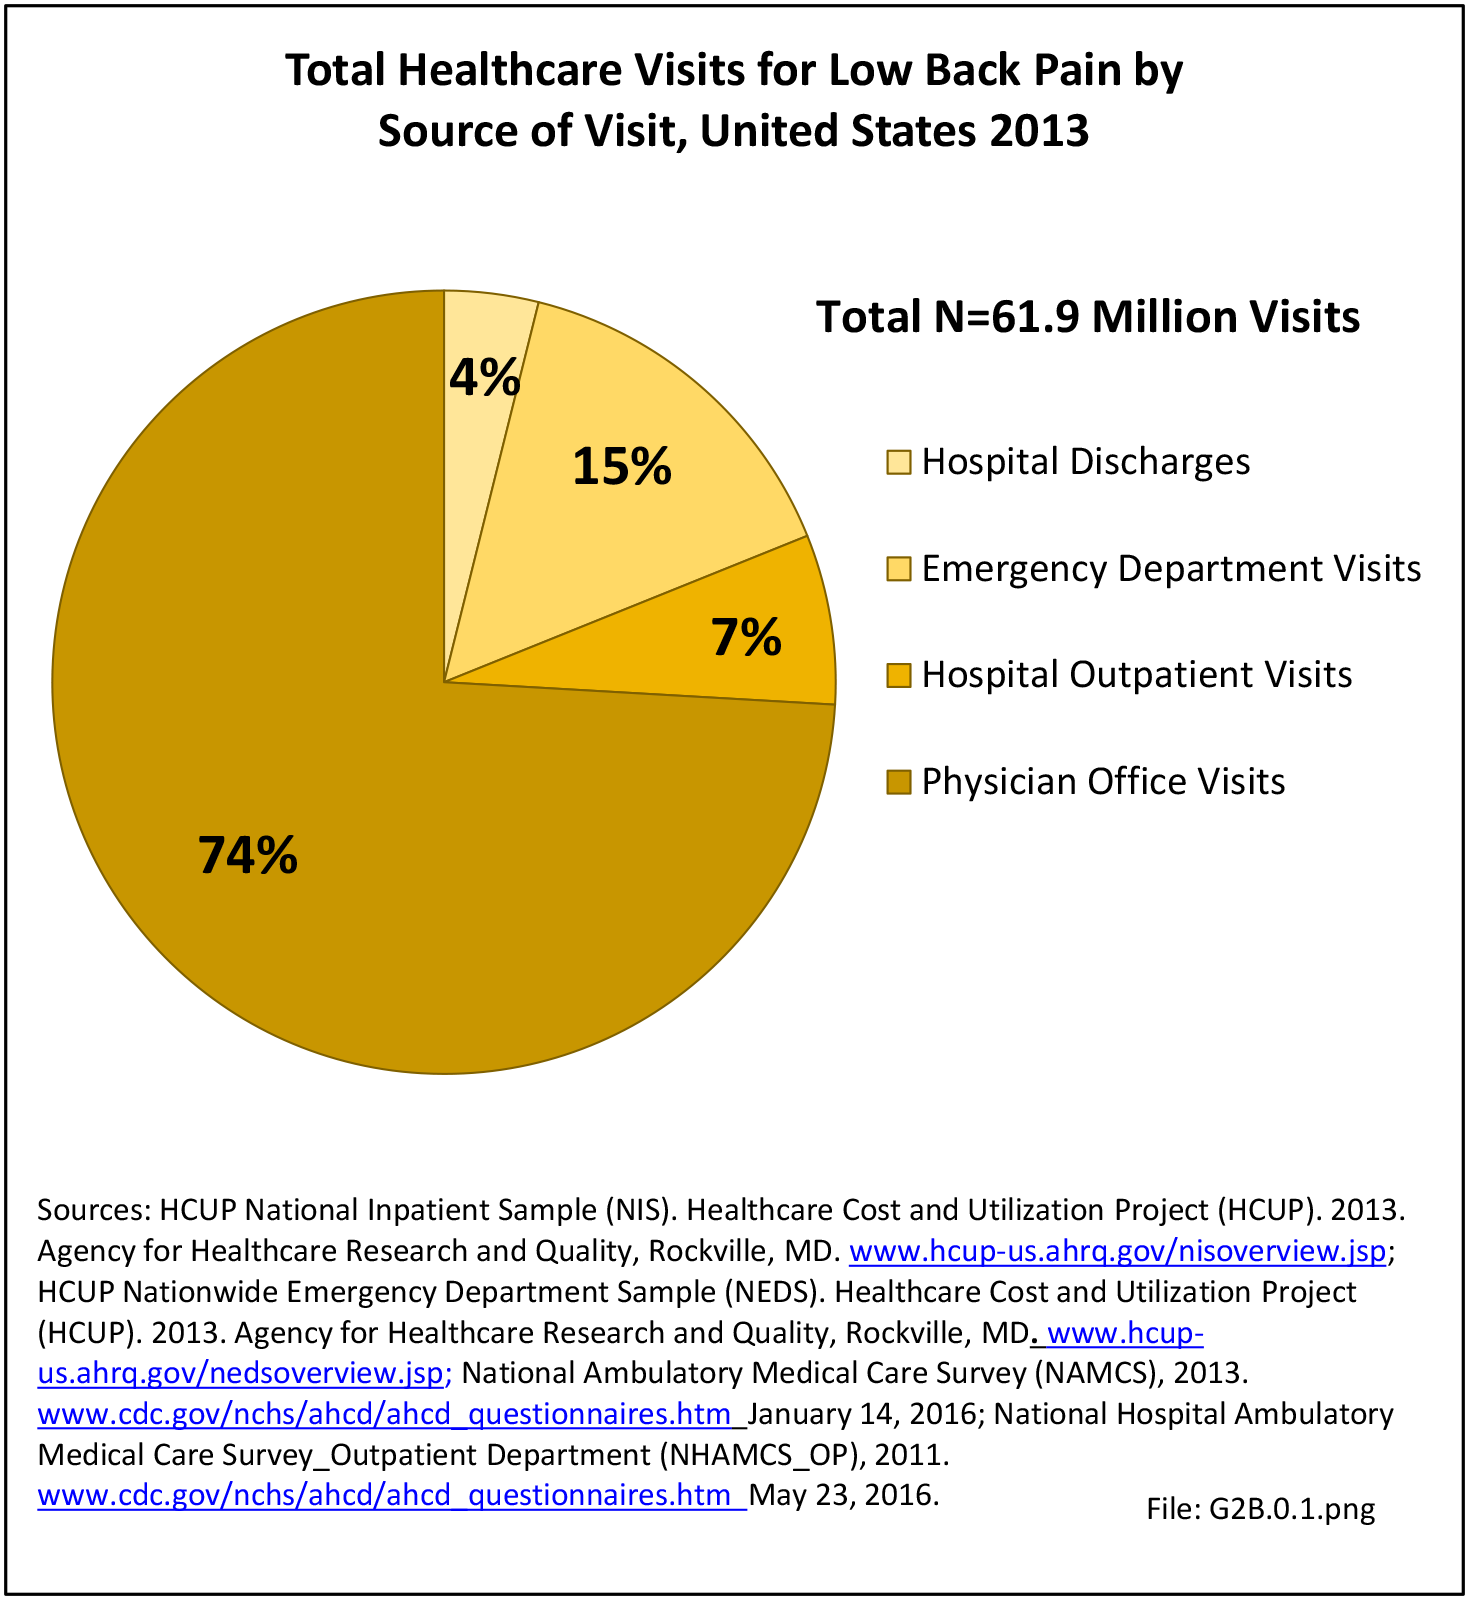
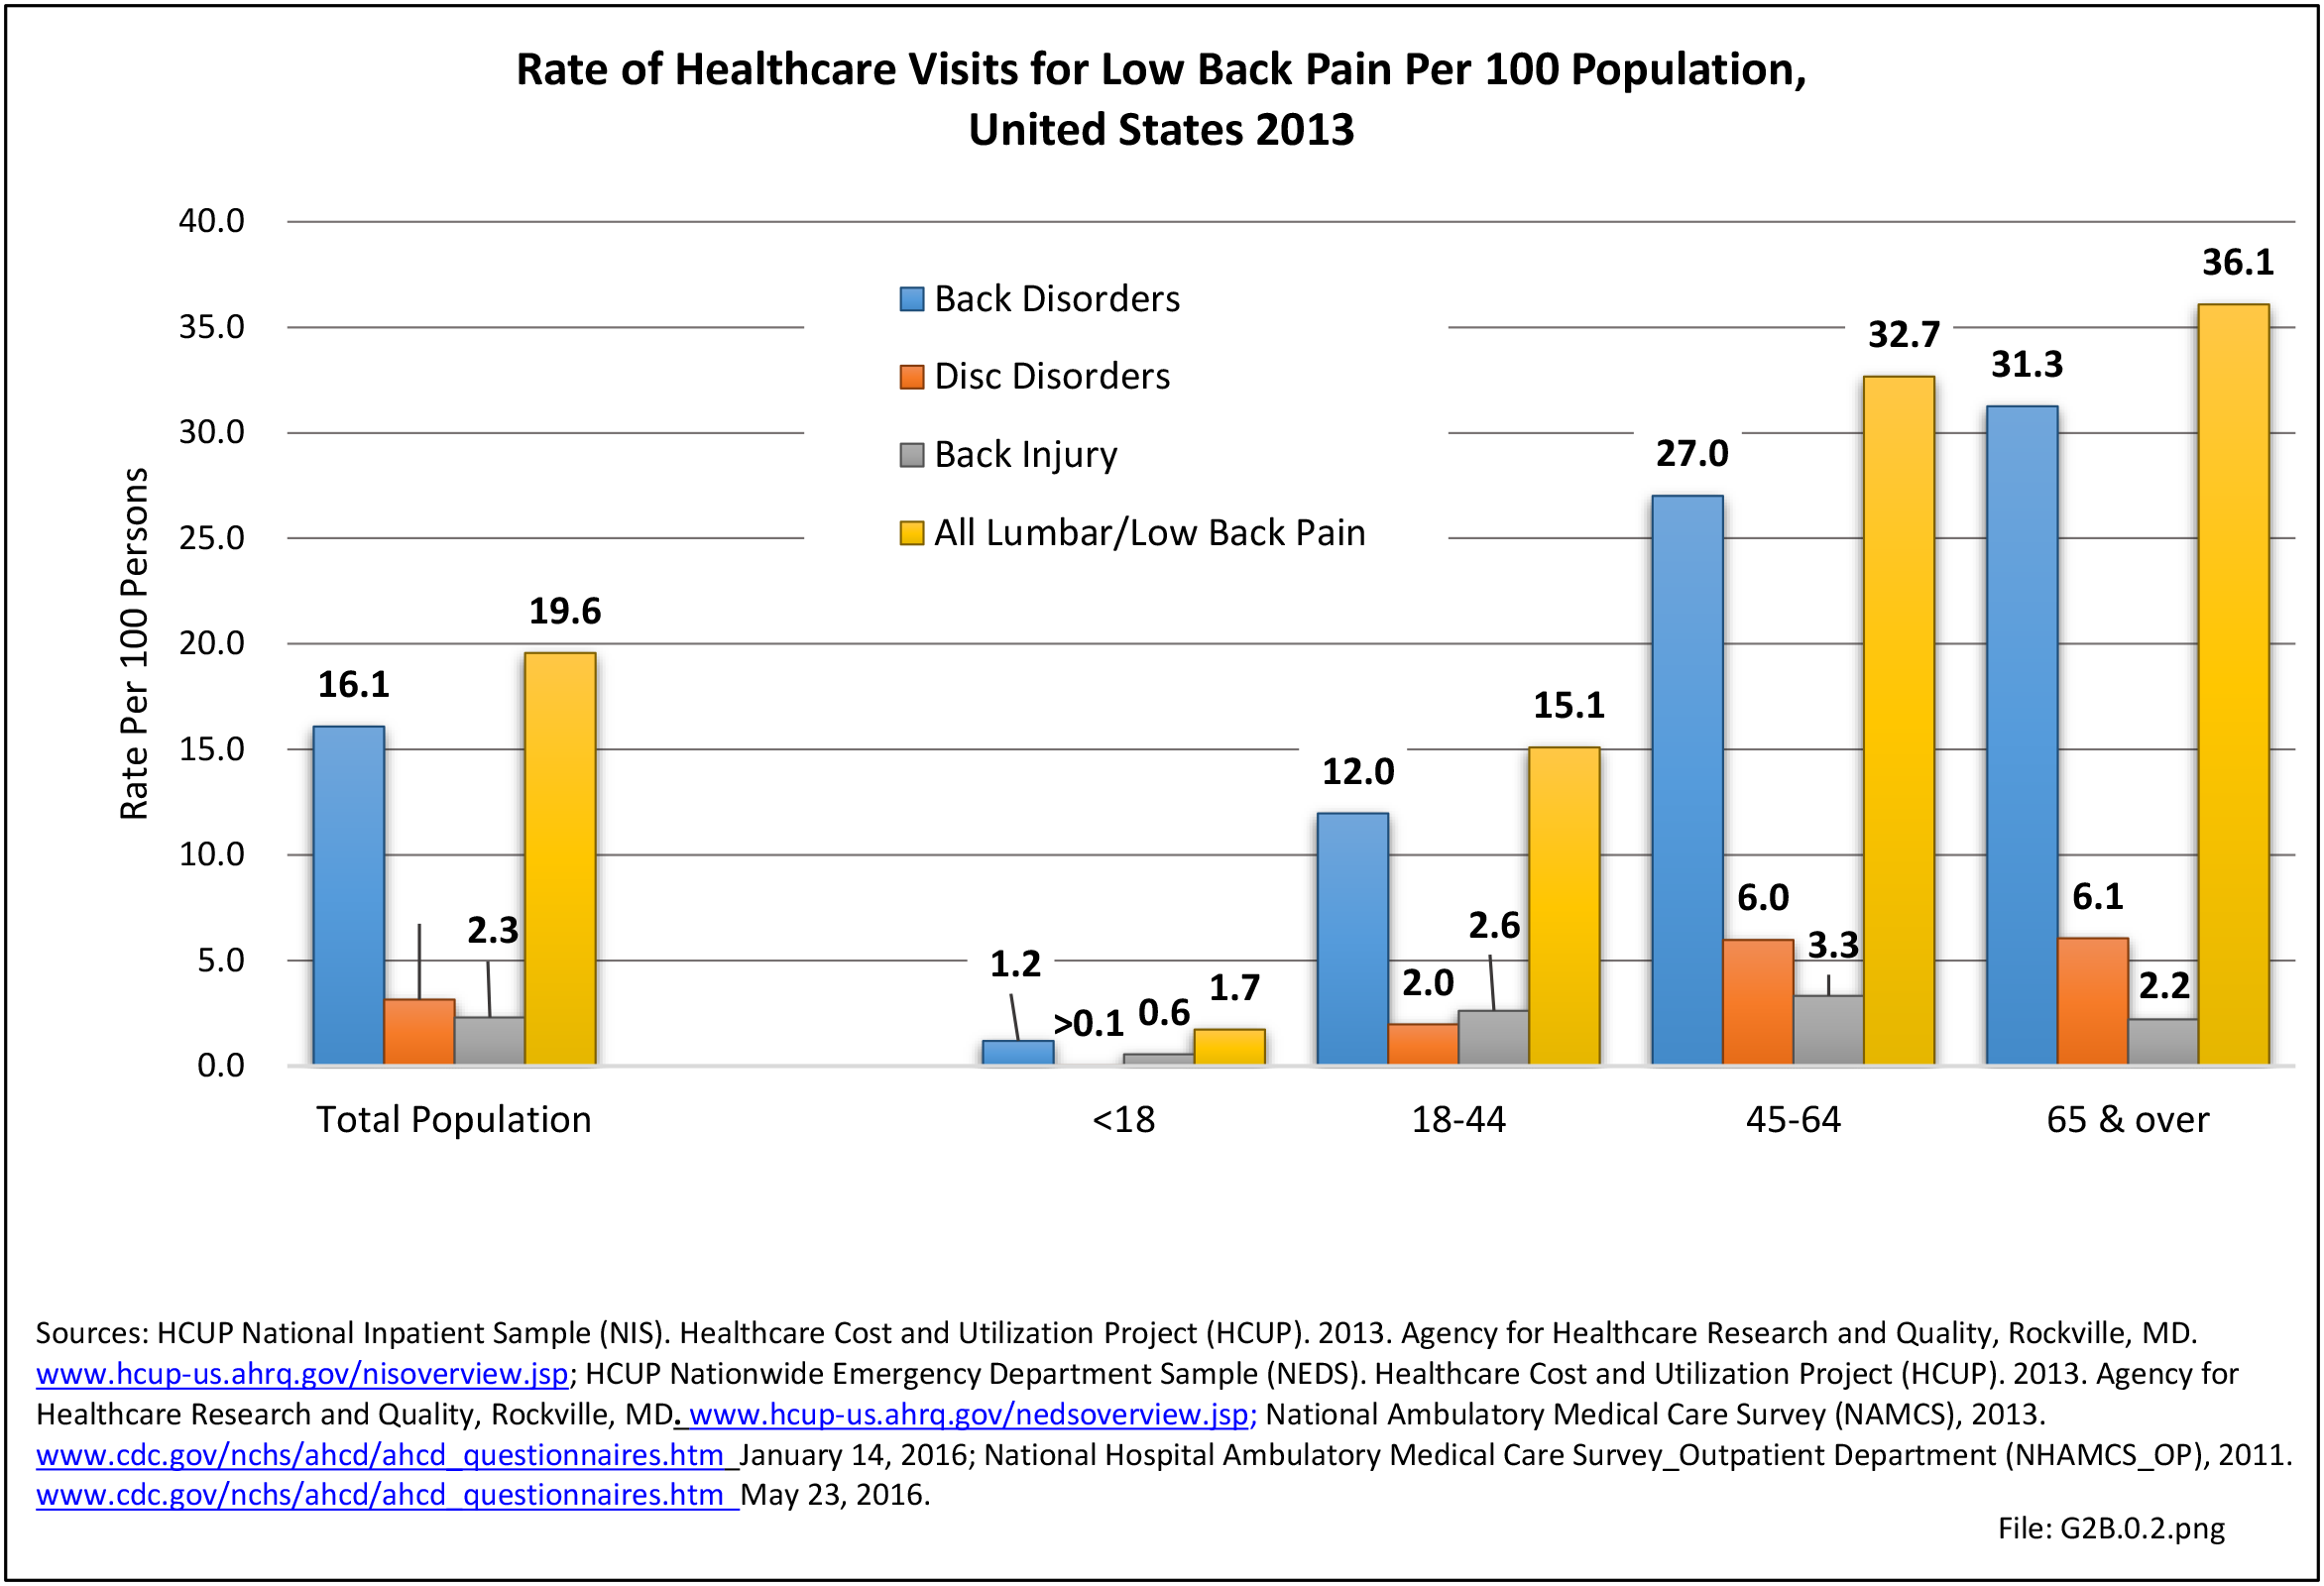
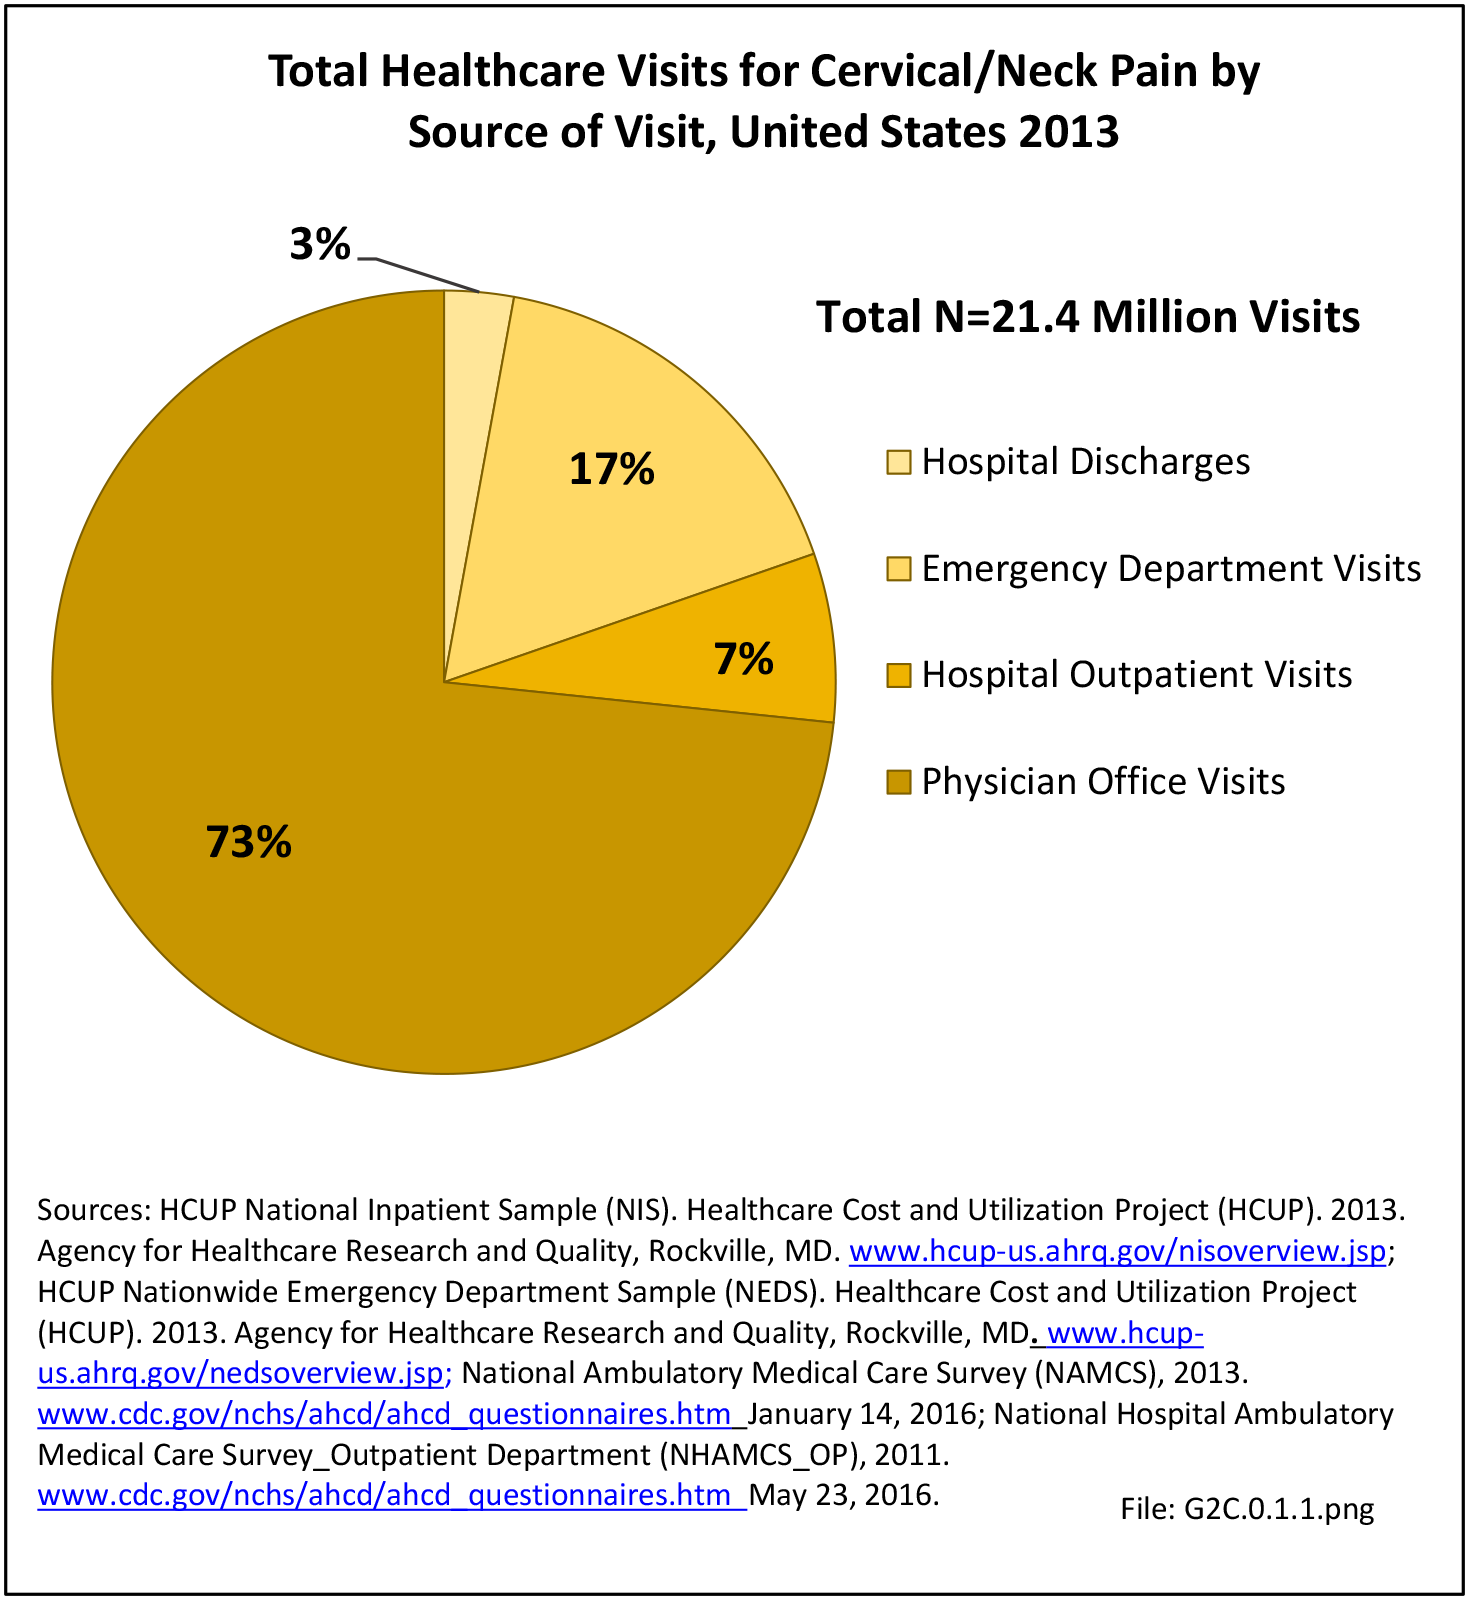
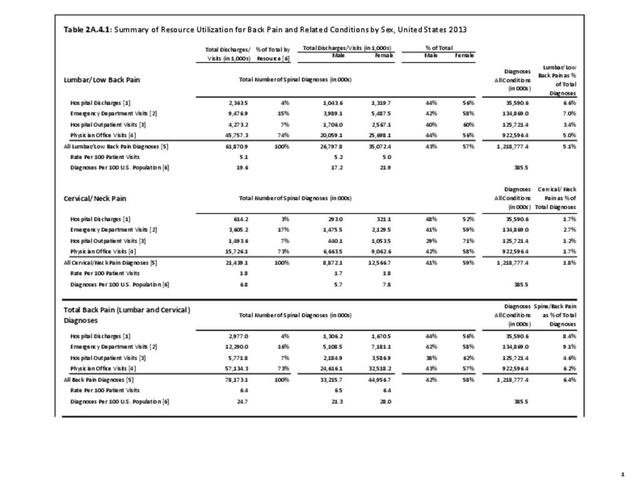
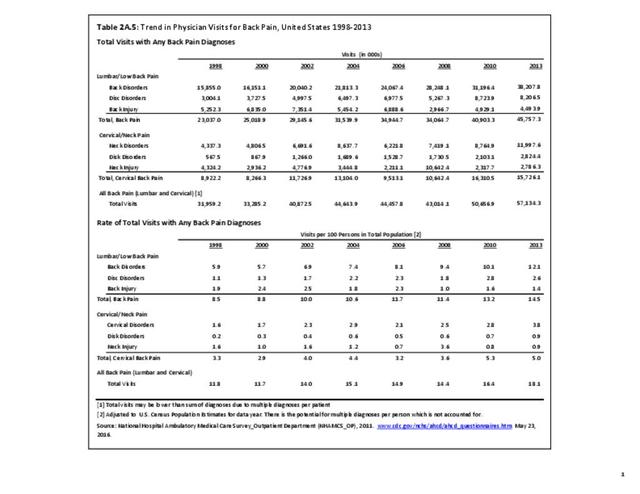
As discussed on previous pages, back pain was the most common reason for healthcare visits among musculoskeletal disorders in 2013. In 2013, nearly 1 in 4 persons (24.7%) in the United States had a healthcare visit with a diagnosis of back pain, accounting for 6.4% of healthcare visits for any cause. Three out of four visits (73%) were physician office visits and the number of physician office visits for back pain continues to increase. In 1998 there were 32 million visits in 2004 nearly 45 million, and in 2013 more than 57 million. Physician office visits for back pain not only show a rapid increase in number, but also continue to include a larger share of the population. In 1998, 11.8 in 100 persons visited a physician because of back pain. In 2004, this had increased to 15.1 persons in 100. Although a slight decrease was seen through 2008, by 2013 the ratio had increased to 18.1 persons in 100. Low back pain accounted for most of the increase in visits. (Reference Table 2A.4.1 PDF CSV and Table 2A.5 PDF CSV)

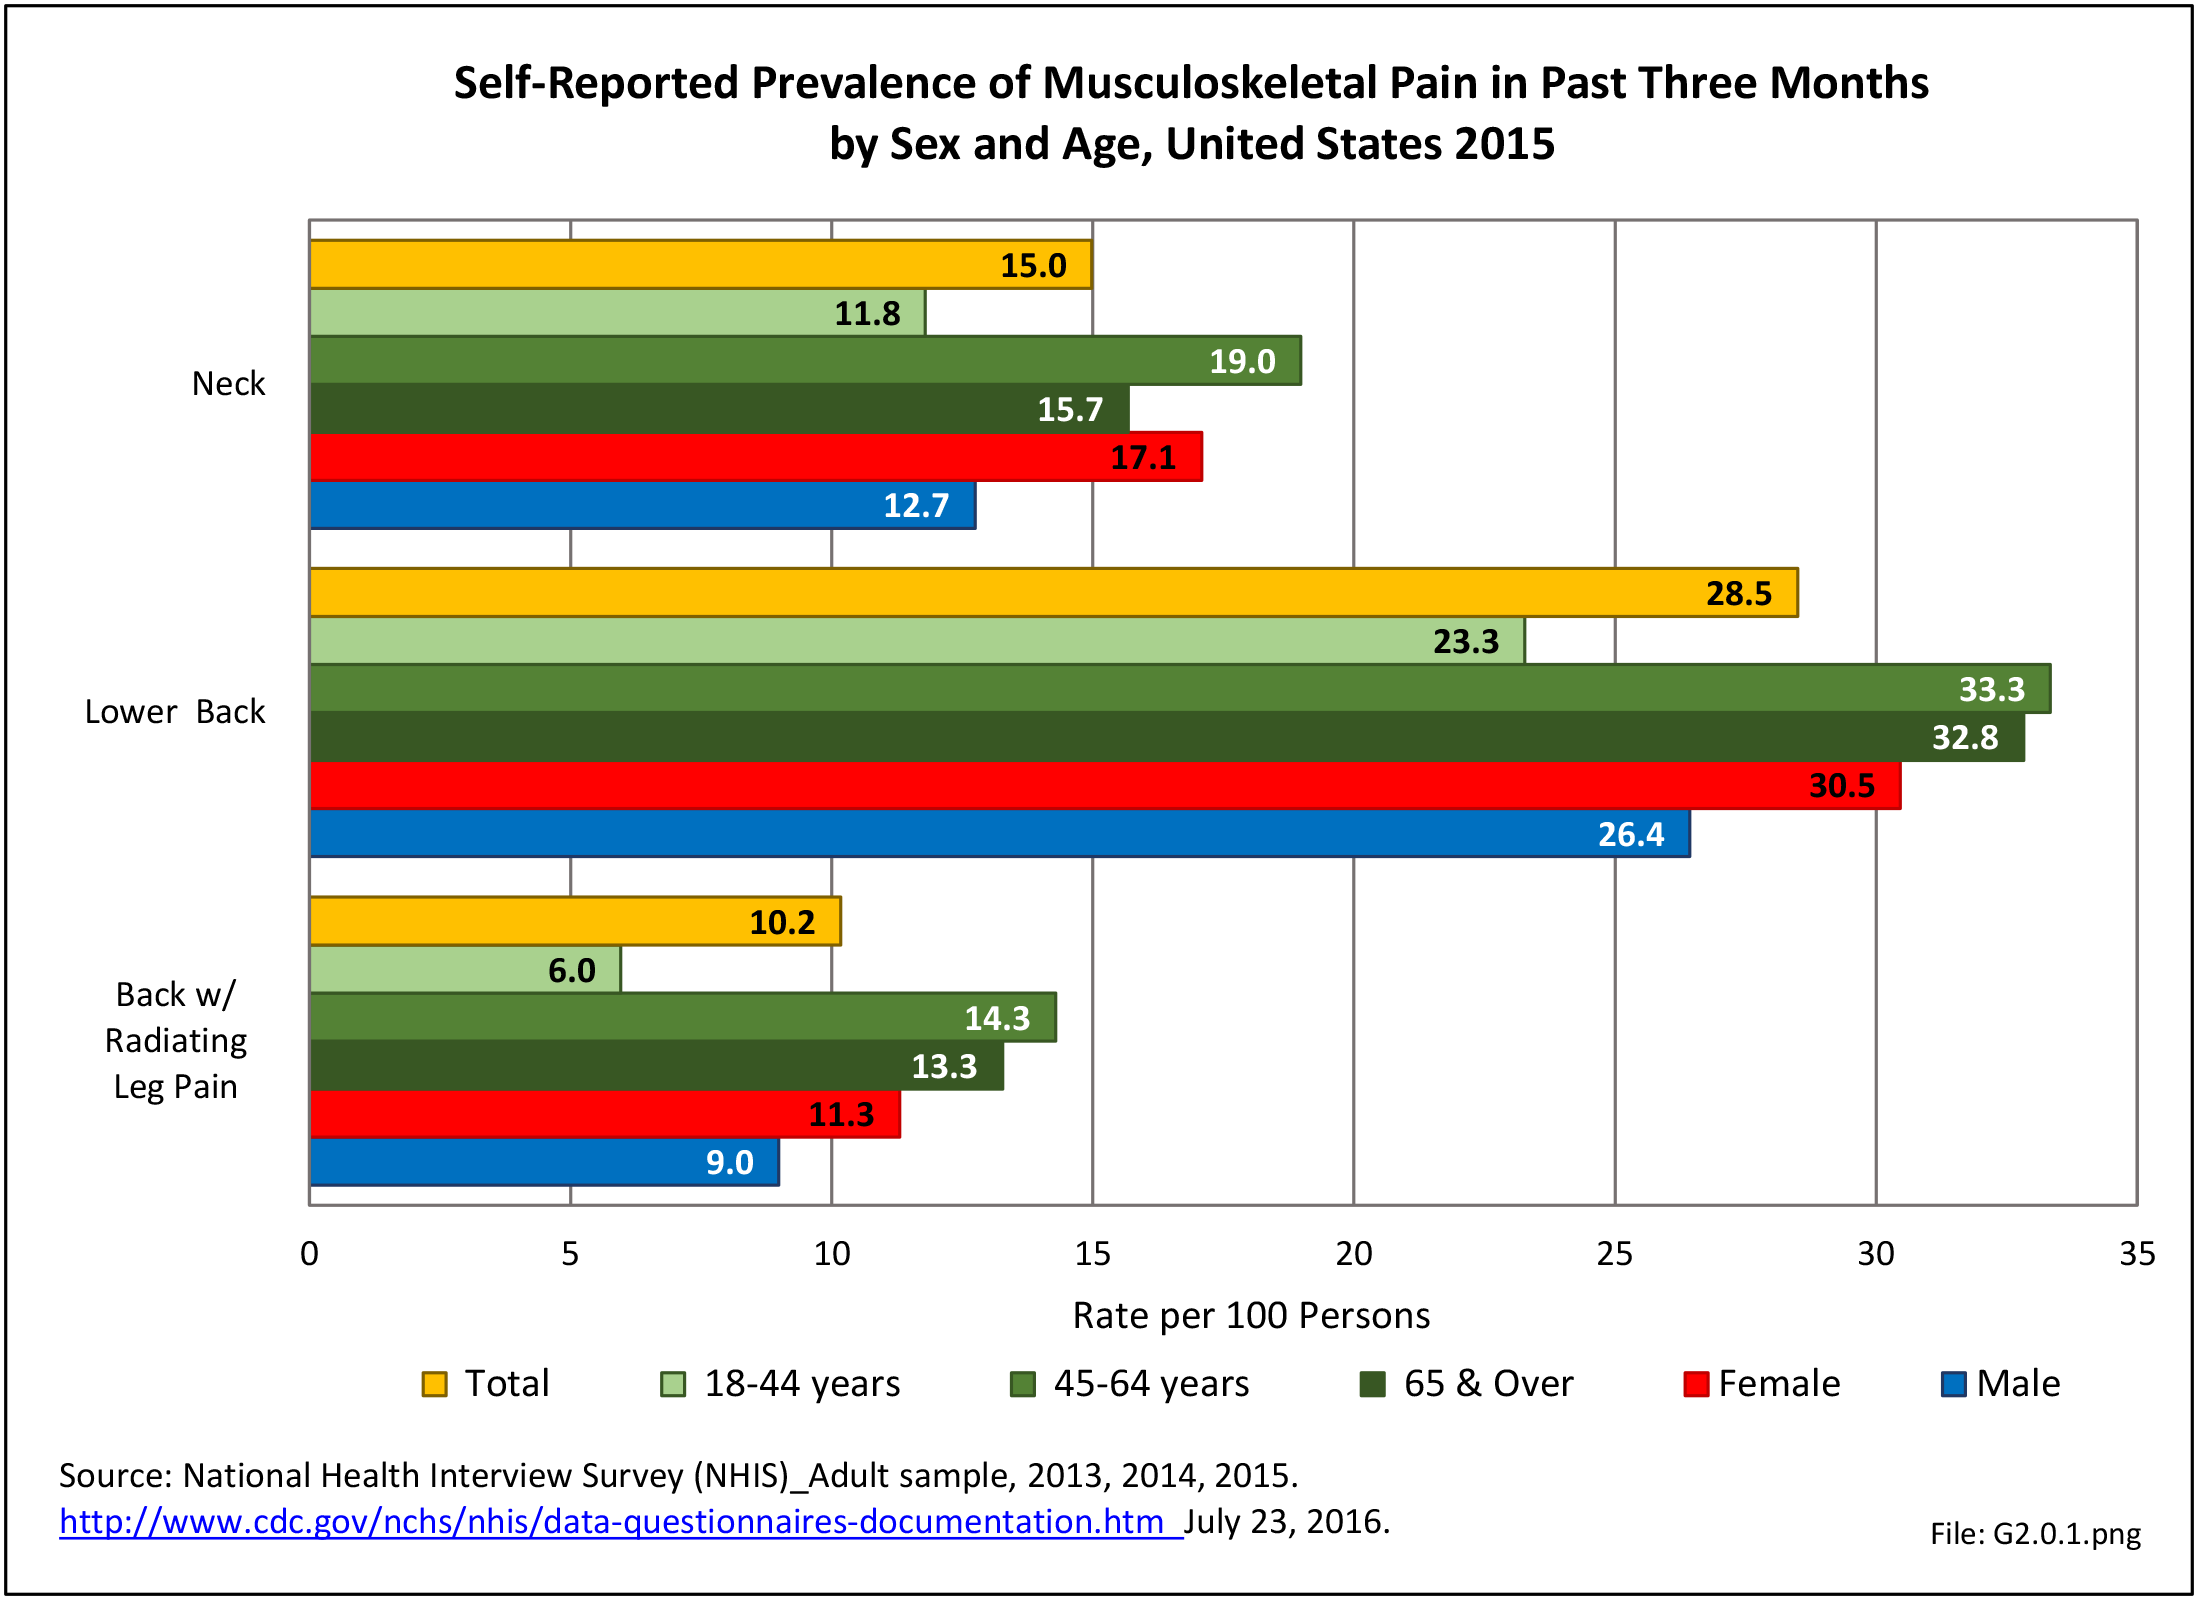
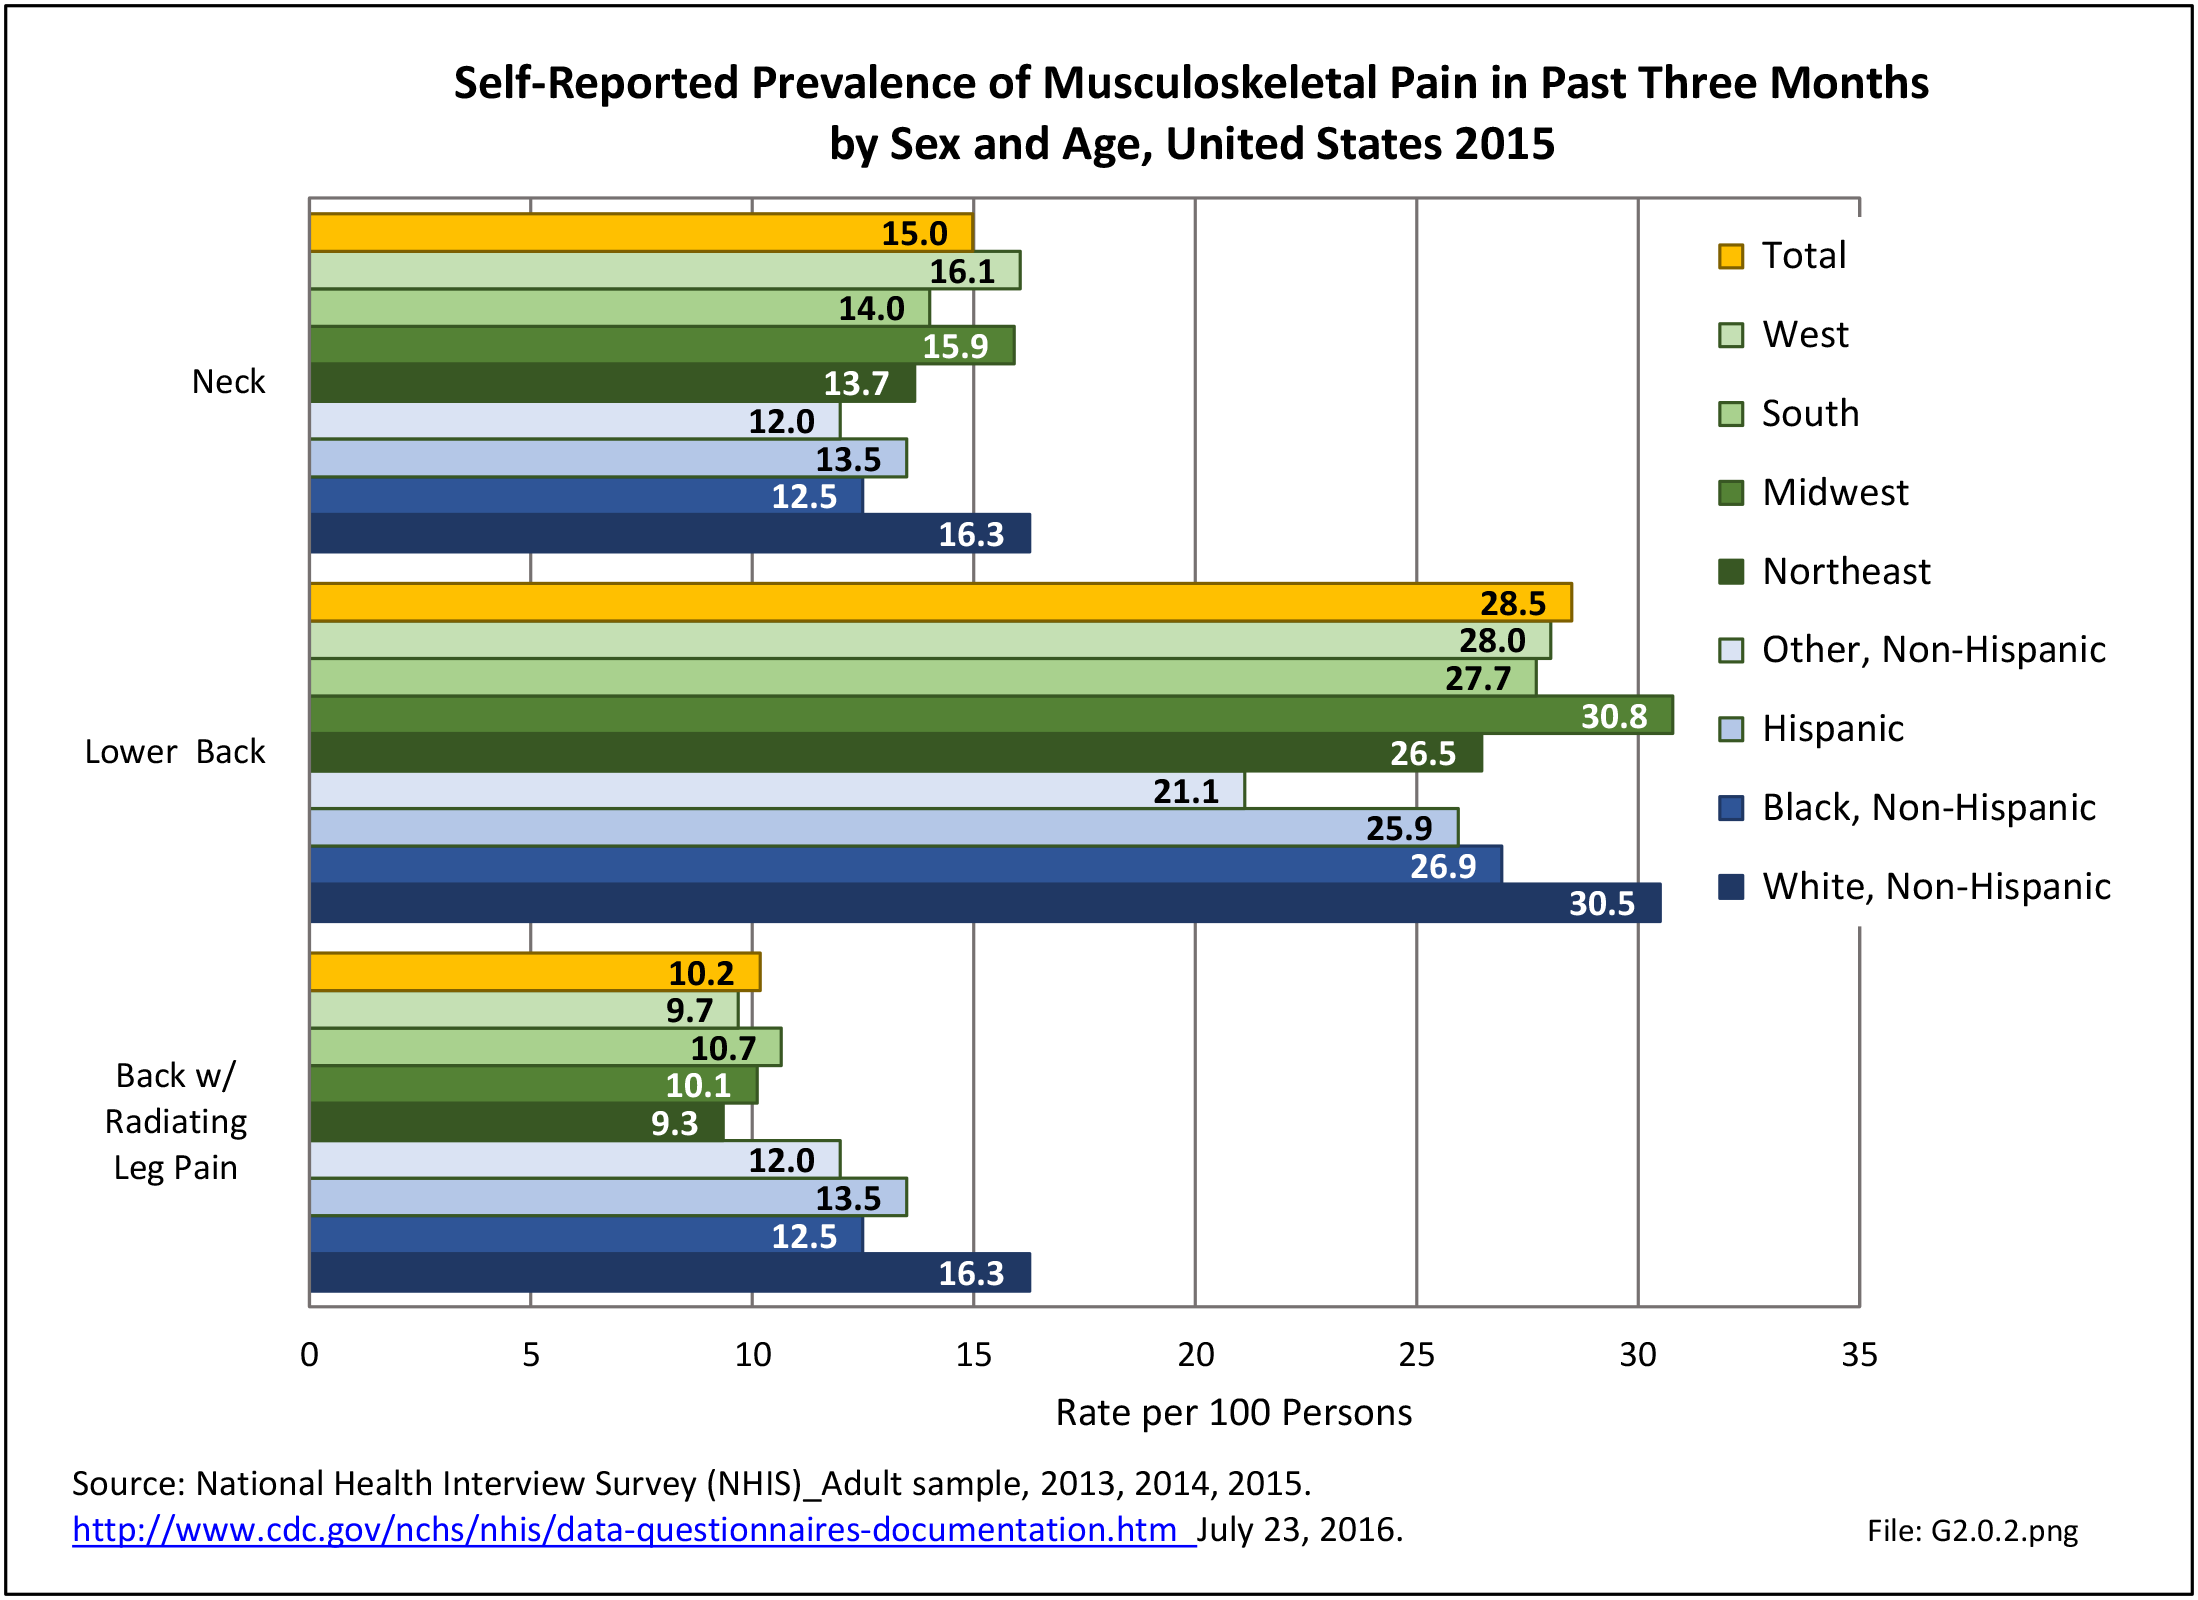
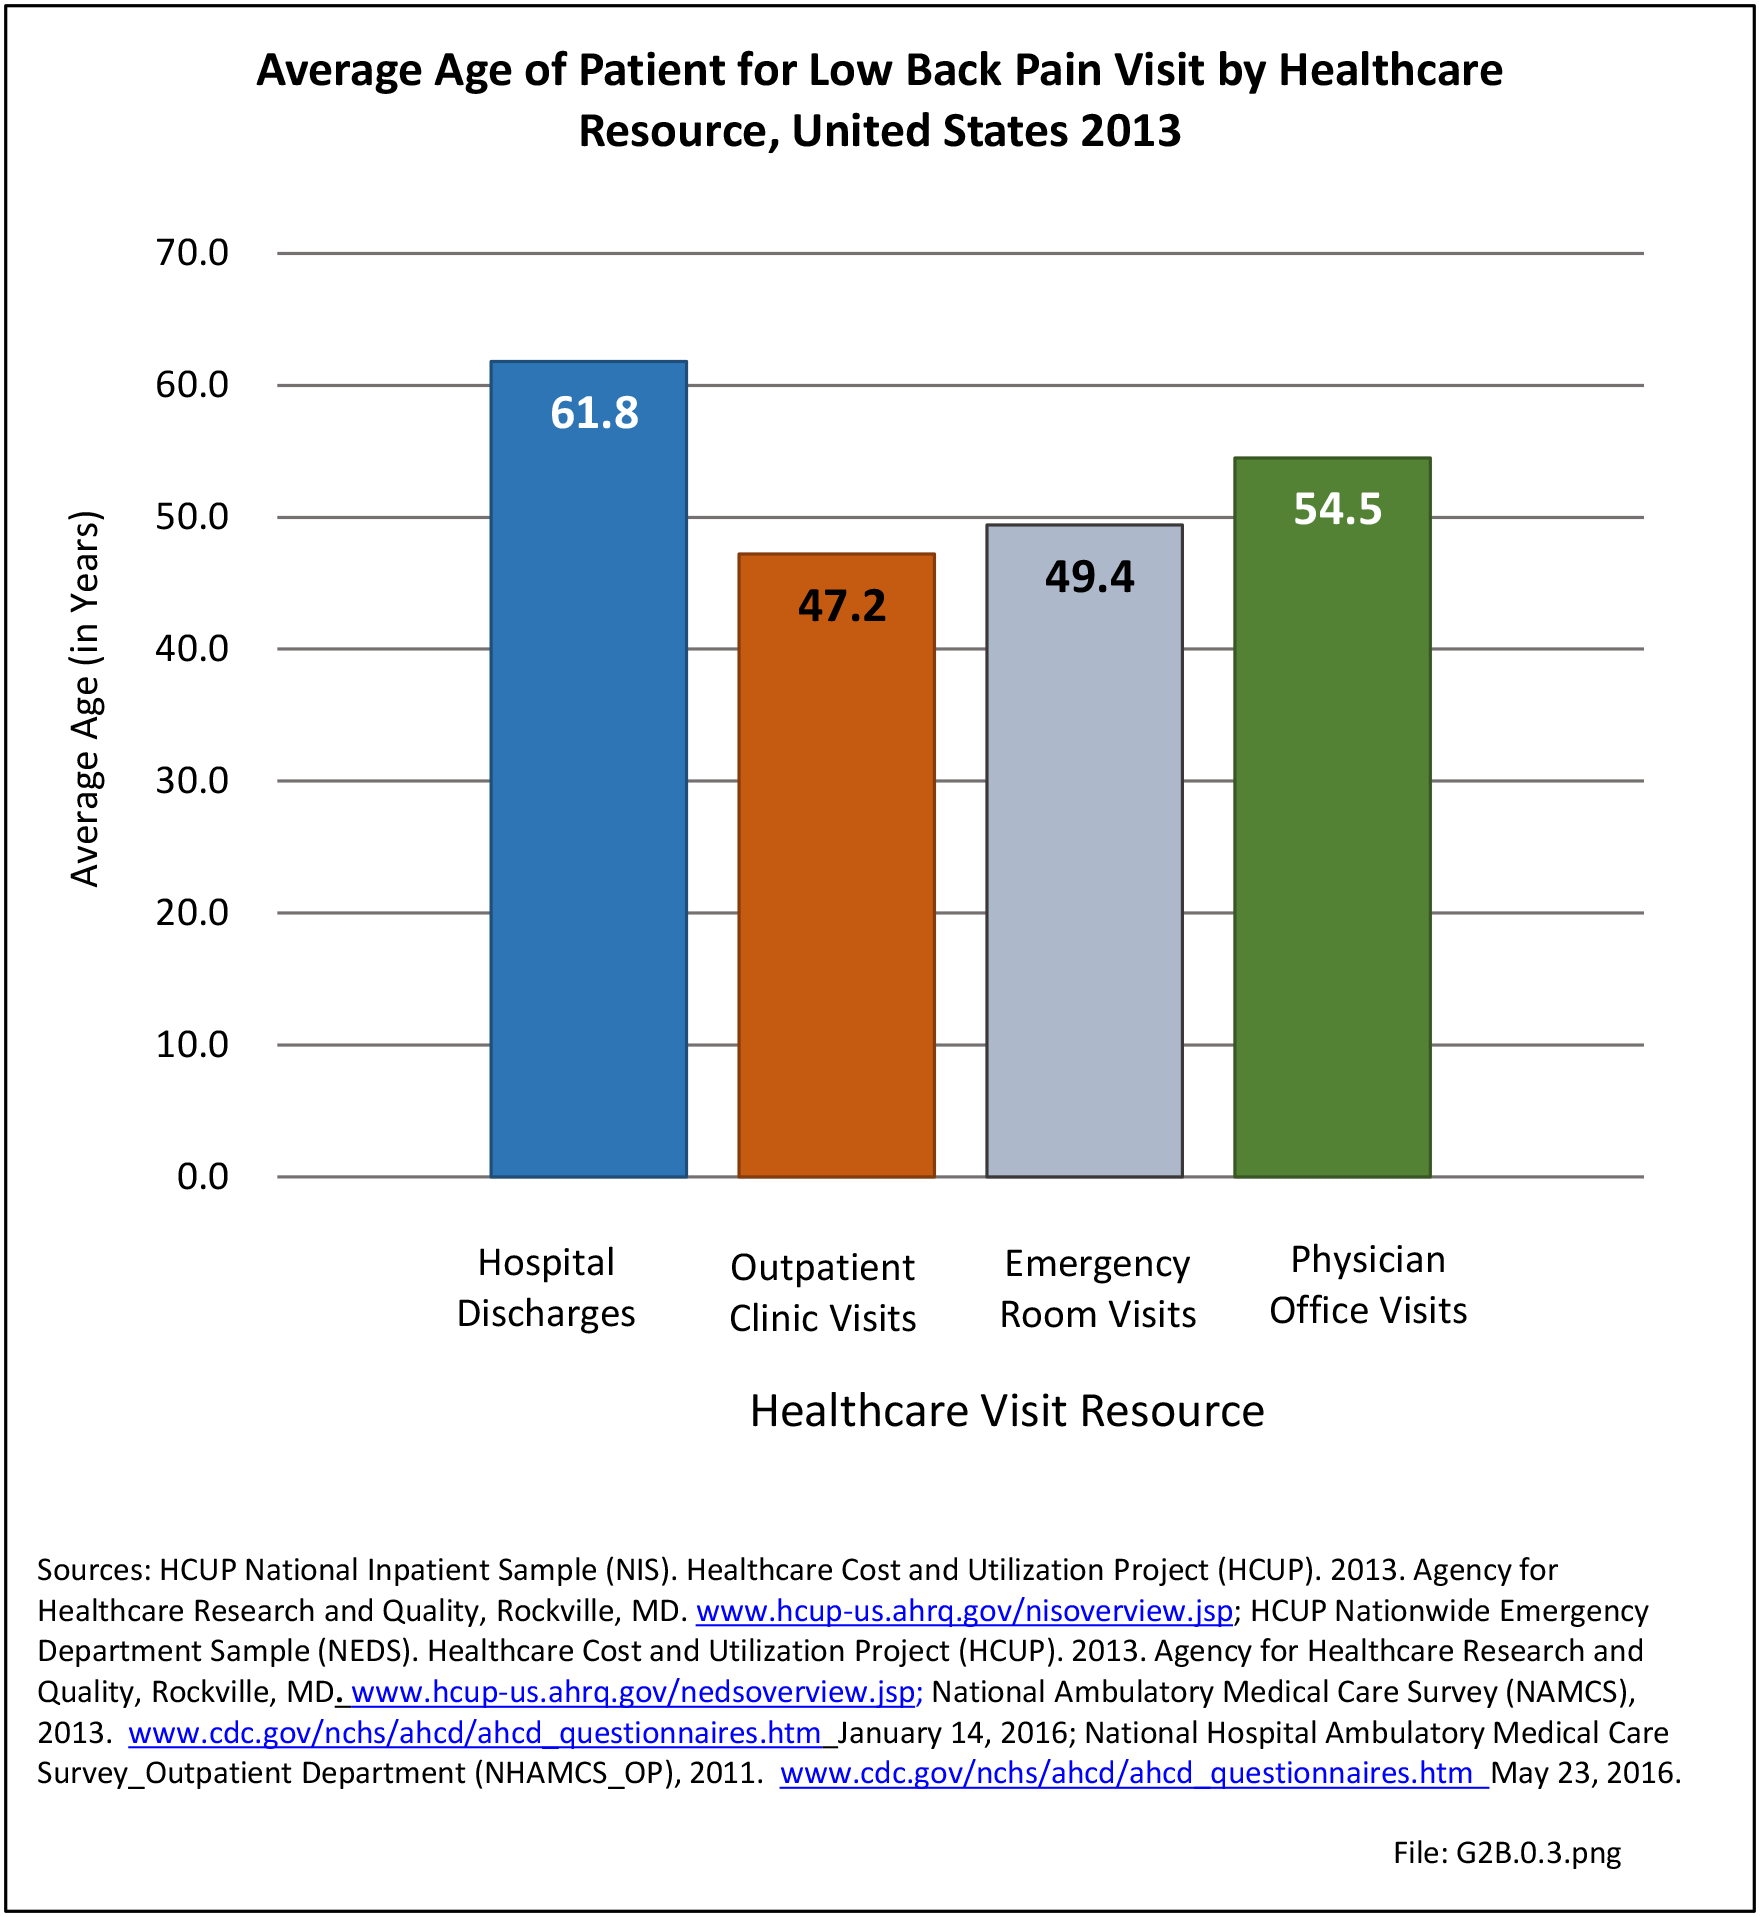
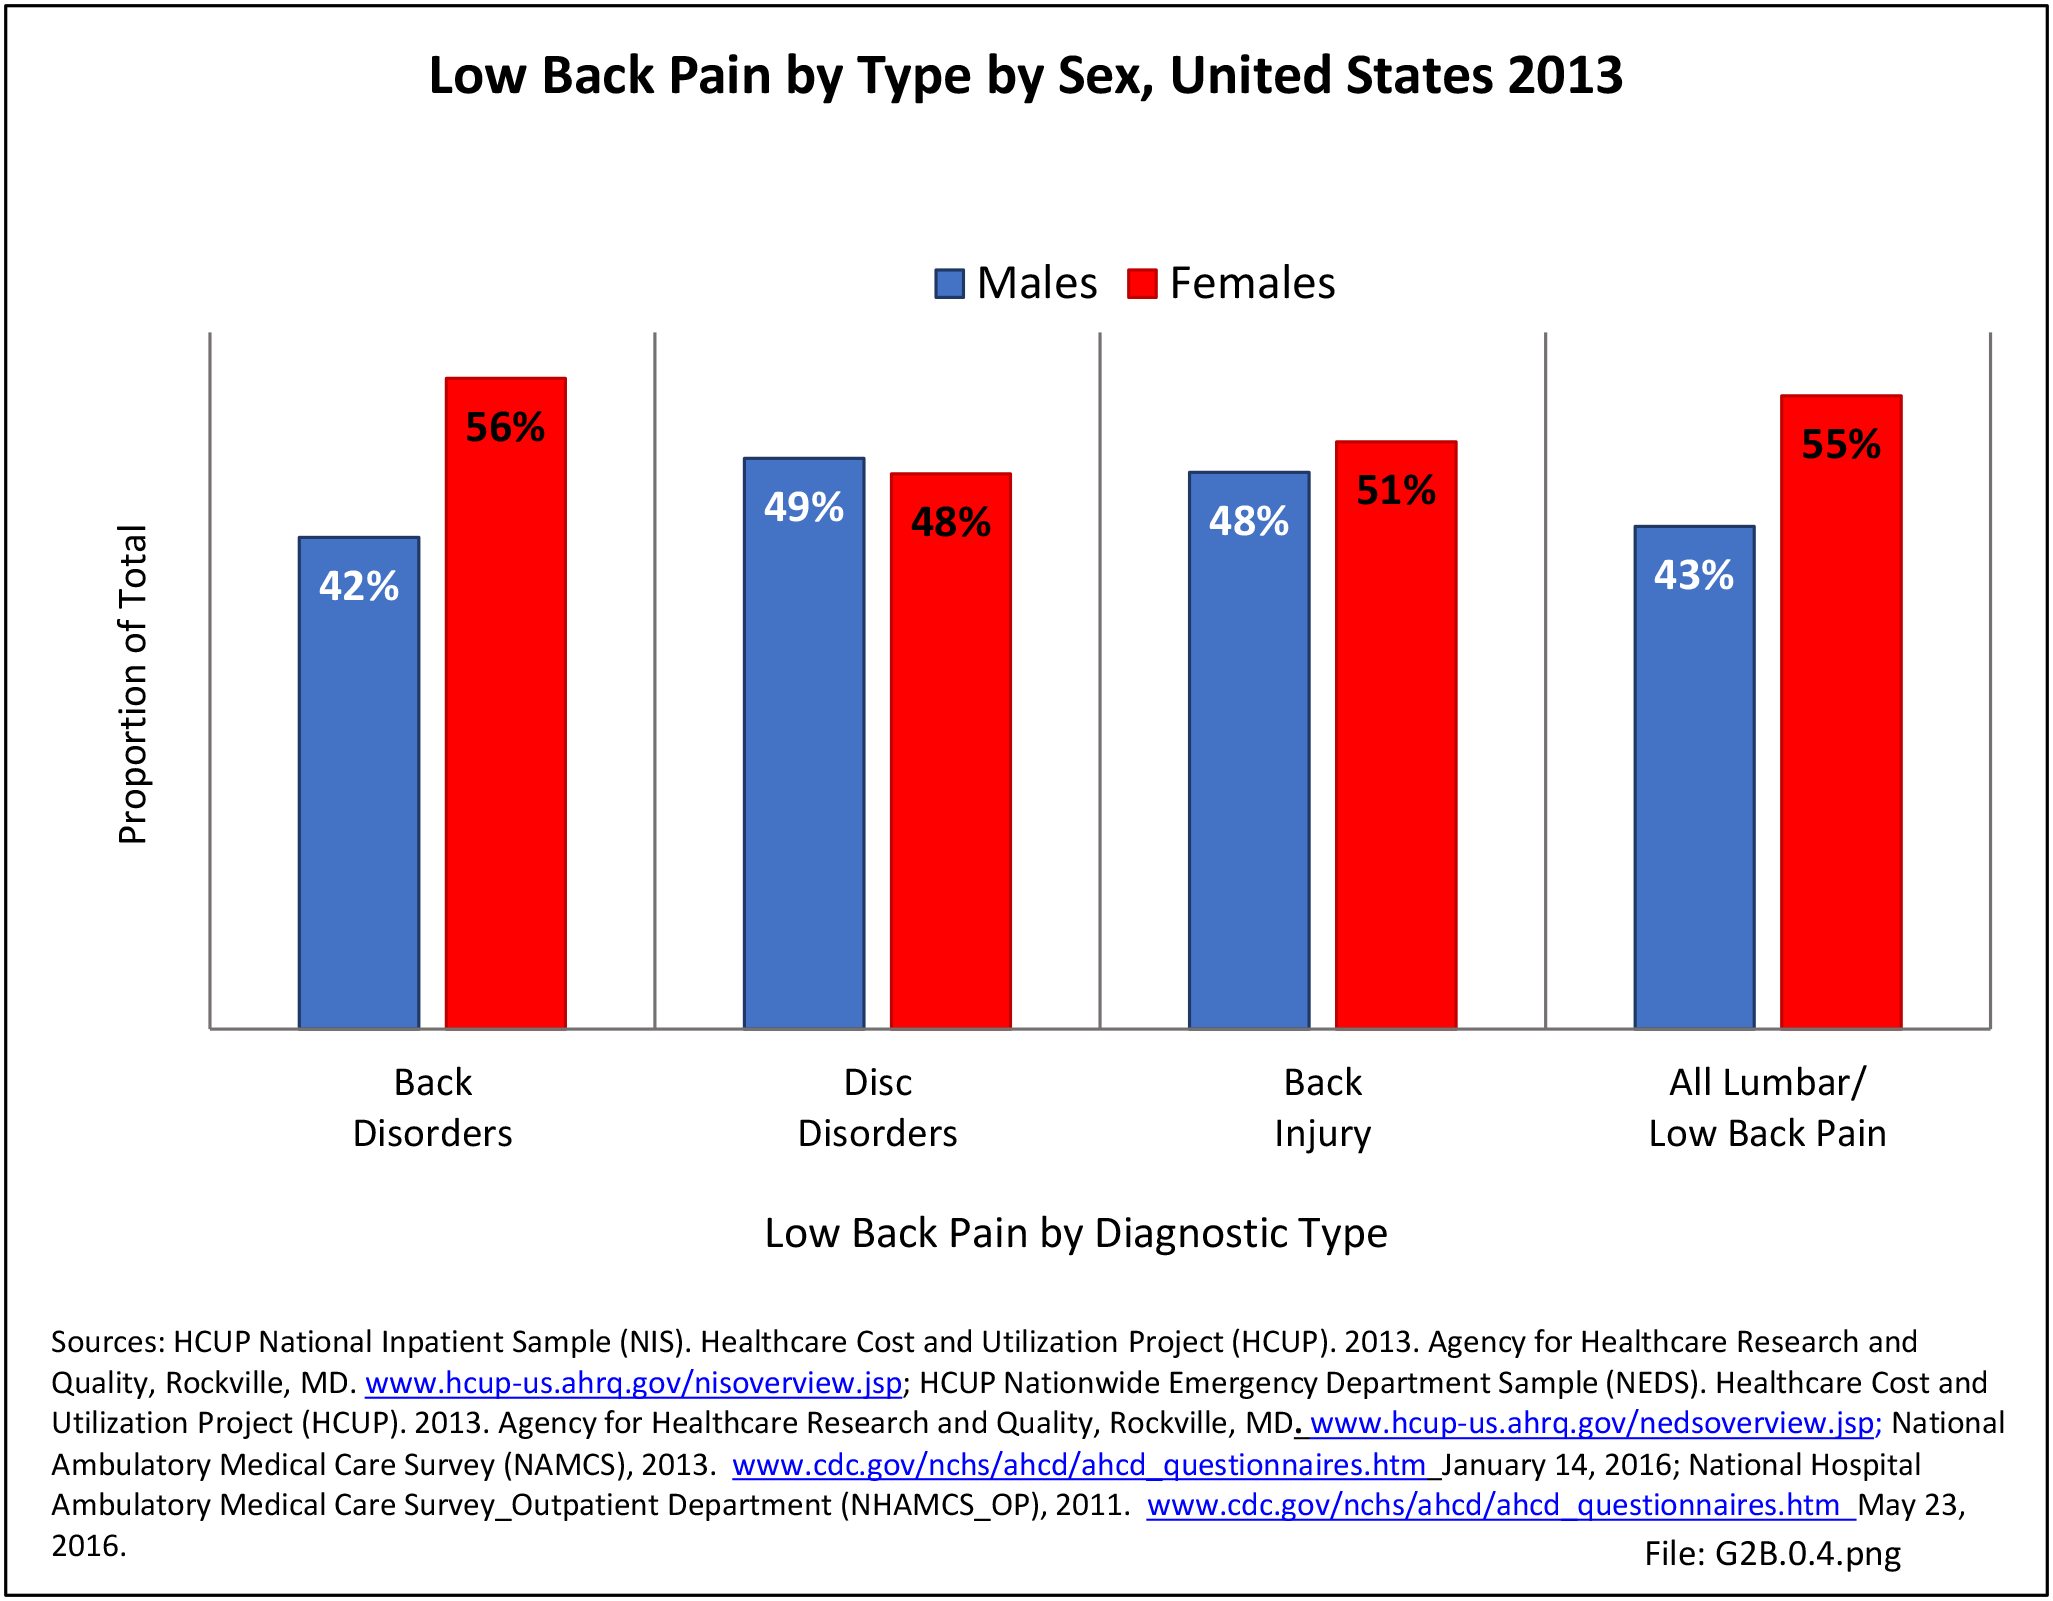
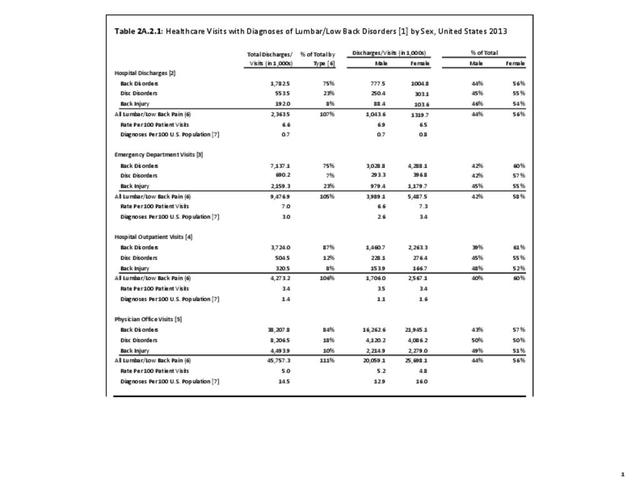
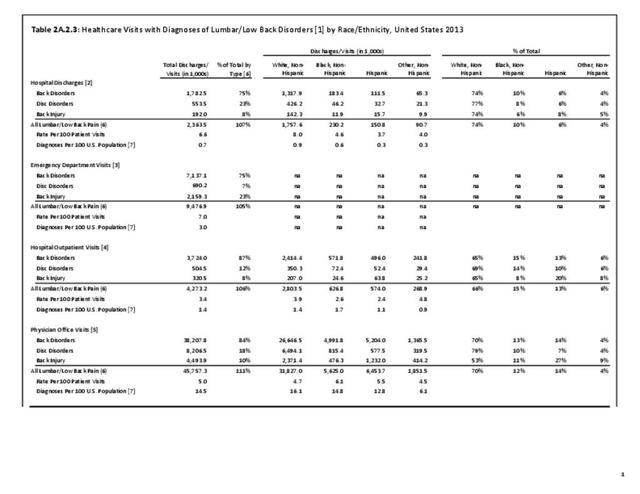
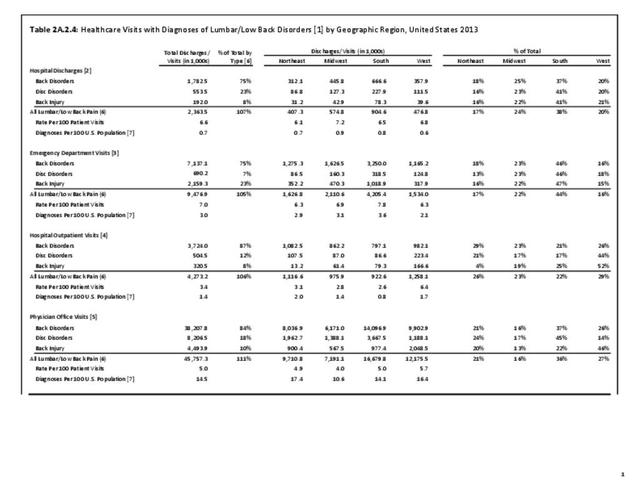
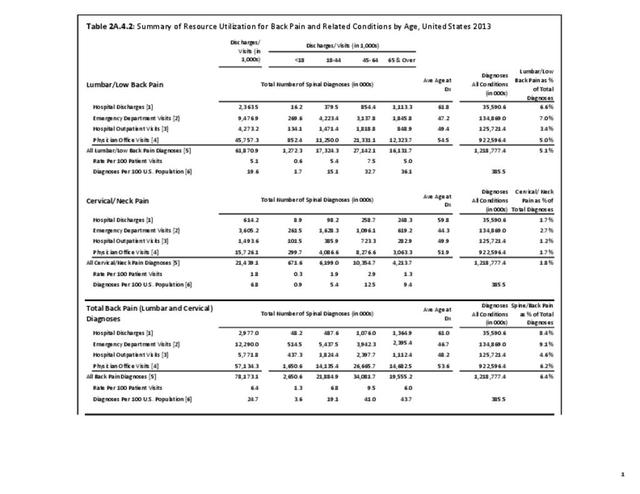
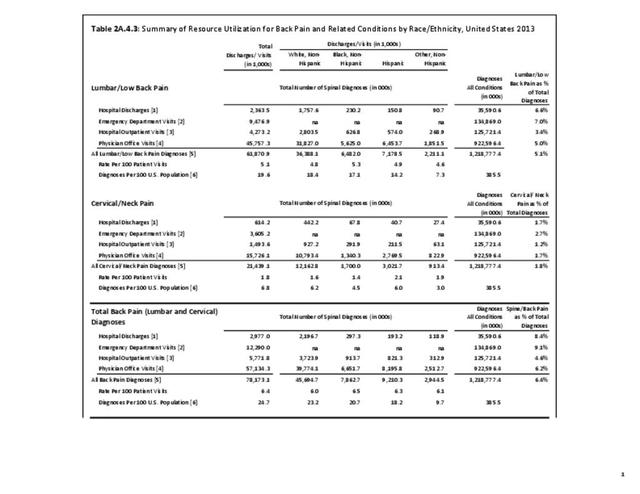
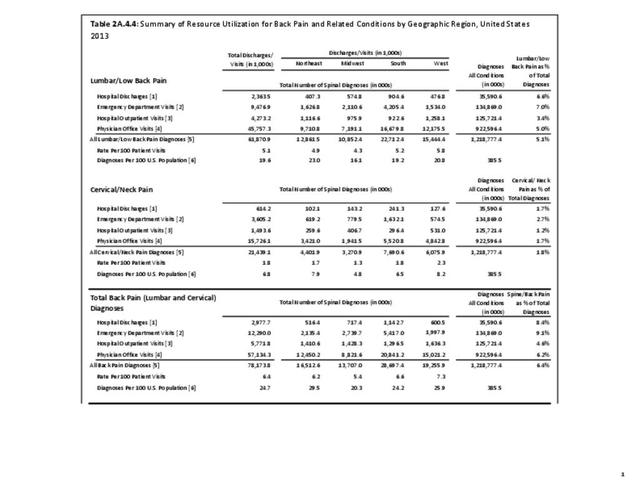
With respect to sex, females accounted for 58% of total back pain healthcare visits in 2013, however, the rate of total back pain visits per 100 patients was slightly less than that of males (6.4 vs. 6.5). Persons ages 45 to 64 years had the highest rate of total back pain diagnosis per 100 patient visits (9.5), but those aged 65 and older had the highest rate per 100 persons in their age group (43.7). The rate of total back pain visits per 100 patient visits was similar across all race/ethnic groups and geographic regions, with non-Hispanic whites and residents of the northeastern United States having the highest rates per 100 persons (23.2 and 29.5, respectively). (Reference Table 2A.4.1 PDF CSV; Table 2A.4.2 PDF CSV; Table 2A.4.3 PDF CSV; and Table 2A.4.4 PDF CSV)
Discharge Status
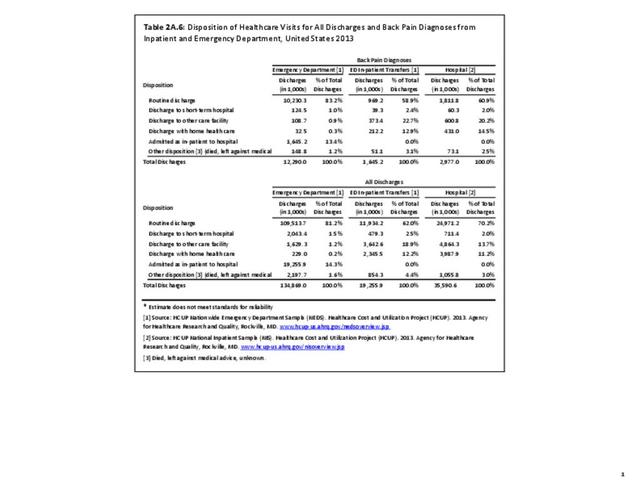
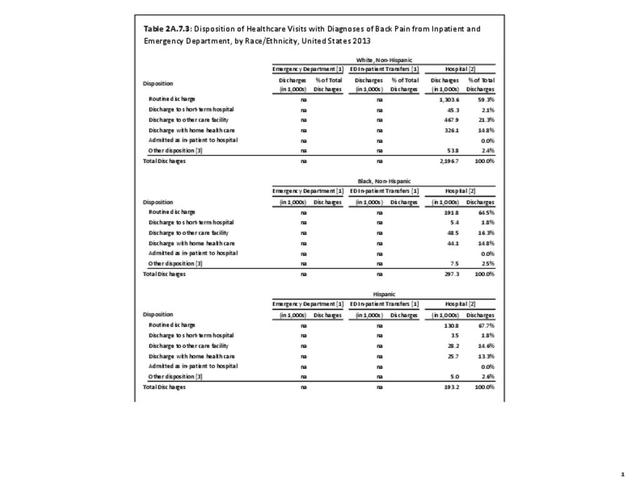
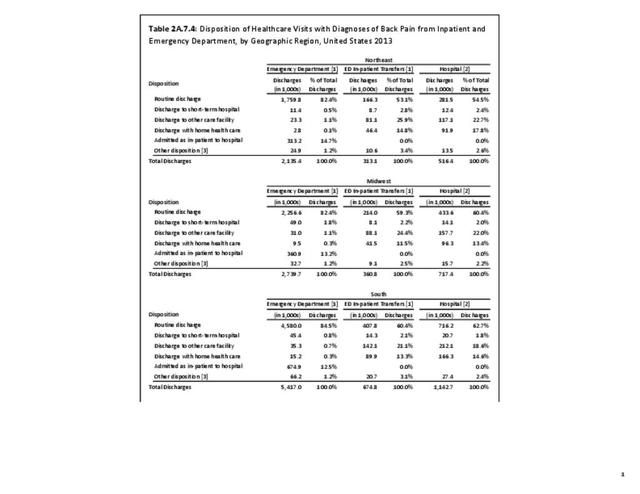
Most patients who present to a hospital emergency department with back pain are treated and routinely discharged to home from the emergency department (83.2%), with only a minority requiring admission to an inpatient unit (13.4%). These statistics are similar to all other emergency department discharges. When discharged from the hospital after a diagnosis of back pain, whether as a transfer patient from the emergency department or a direct hospital admission, routine discharges drop to about 60%, with 1 in 5 (22%-25%) discharged to another care facility and 13%-14% discharged with home health care. These numbers are somewhat higher than those found among all hospital discharges for any diagnoses. (Reference Table 2A.6 PDF CSV)
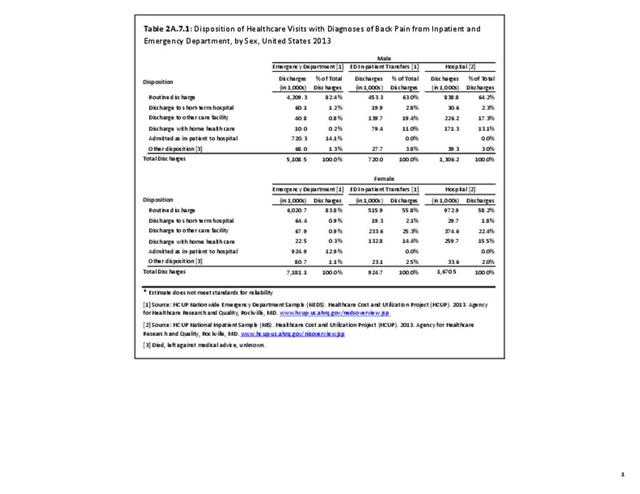
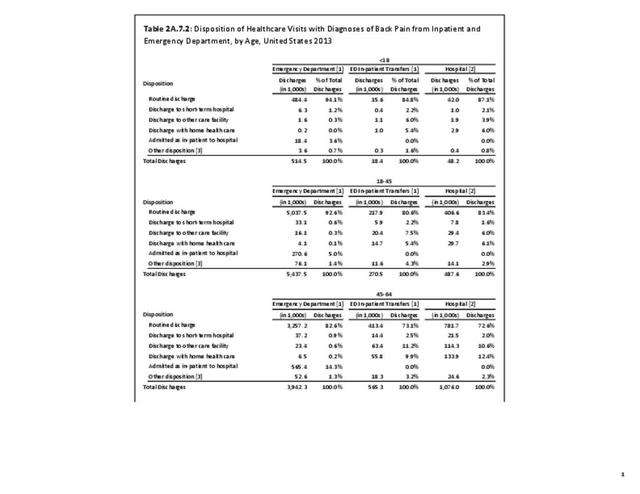
No significant differences are observed in disposition of back pain visits to the emergency department or hospital between sexes, but females are slightly more likely to be discharged to another care facility or have home health care provided. When comparing age groups, a large majority of routine discharges are observed in patients aged 45 years or younger. The percentage of routine discharges is decreased by 10% to 82.6% for the 45 to 64 years age group, and is reduced by another 20% in the 65 years and older age group (60.6%). By age 65 and older, more than half of the discharges are to another care facility or with home health care. No meaningful differences are observed in the disposition of patients with respect to race/ethnicity. Residents of the Northeast region are the most likely to be discharged to additional care (40.5%). (Reference Table 2A.7.1 PDF CSV; Table 2A.7.2 PDF CSV; Table 2A.7.3 PDF CSV; and Table 2A.7.4 PDF CSV)

Functional Limitations
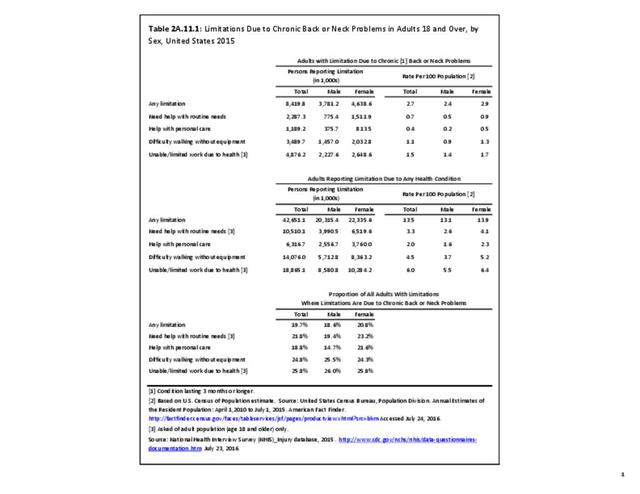
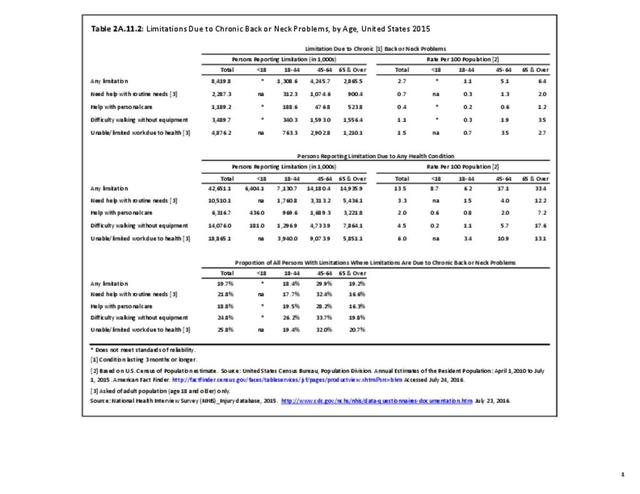
Approximately 6% of the working age population, persons age 18 years and older, report they are unable to work or limited in the type of work they can perform because of a medical condition. Among this group, 25.8% reported they are unable to work due to back or neck problems. Similar ratios of limitations related to daily living are also found. Approximately 1 in 22 persons of working age has difficulty walking without equipment due to a medical condition; 24.8% report that condition to be back or neck pain. Overall, 13.5% of working-age persons report at least one limitation with activities of daily living, which include eating, preparing food, bathing, rising from a chair, walking up steps, etc. For one in five of these persons, the cause of their limitation is back or neck pain. (Reference Table 2A.11.1 PDF CSV)

Age groups account for major differences in limitations due chronic back or neck problems. One in three patients age 65 years and older report they have limitations in activities of daily living (ADL), with 1 in 5 (19.2%) reporting ADL due to chronic back or neck pain. Among the 17% of persons with ADL for any cause in the 45 to 64 years age group, 29.9% list the cause is due to chronic back or neck problems. Of note, in this age group, chronic back or neck pain is the cause of each type of limitation, including inablity to work at all or type of work, for approximately 1 in 3 with limitations from any cause. No considerable differences are reported between males and females. (Reference Table 2A.11.1 PDF CSV and Table 2A.11.2 PDF CSV)
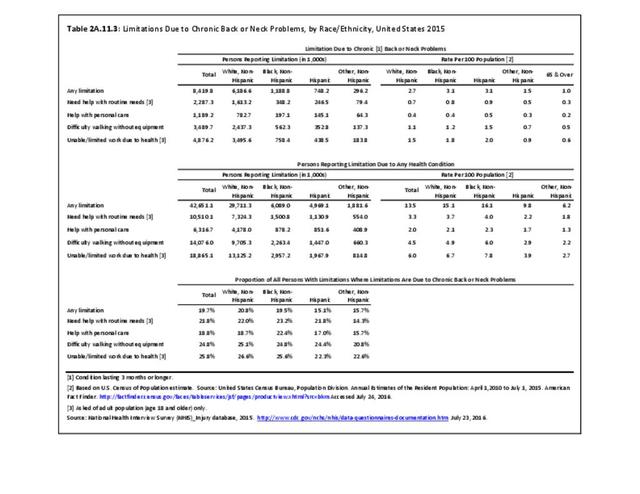
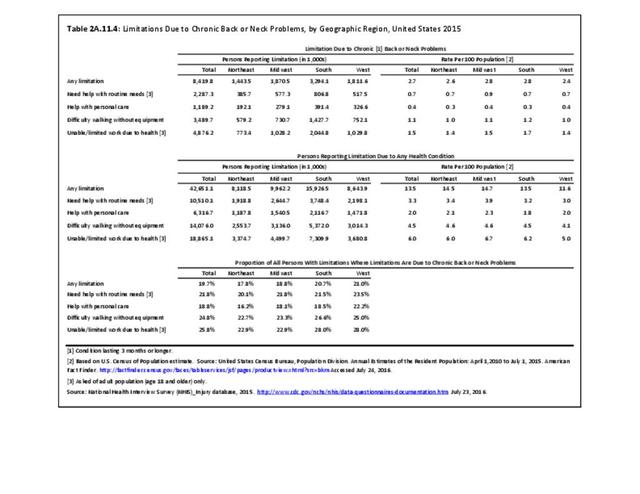
Although the race/ethnic group classified as non-Hispanic others represents a small proportion of the total population, they report the lowest rates of limitations in activities of daily life. Hispanic patients report fewer limitations due to any health condition (9.8%) than non-Hispanic whites (15.1%) and non-Hispanic blacks (16.1%). Among persons with limitations due to any cause, non-Hispanic whites (20.8%) and non-Hispanic black patients (19.5%) have comparatively higher percentages of limitations due to chronic back or neck problems compared with Hispanic patients (15.1%), with the exception of difficulty walking without equipment. No significant differences are seen among geographic regions in ADL. (Reference Table 2A.11.3 PDF CSV and Table 2A.11.4 PDF CSV)
Lost Work Days/Bed Days
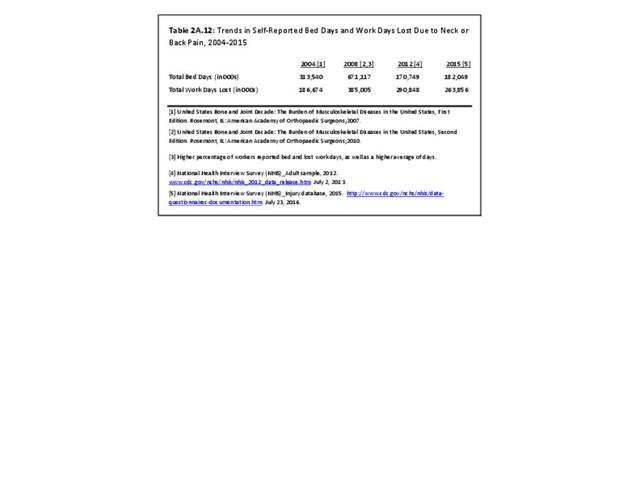
Self-reported bed days and work days lost due to back or neck pain have fluctuated over the past decade. Both recorded their highest totals in 2008, registering 385,000 lost work days and 671,000 bed days. Both bed days and work days lost have remained steady since 2012. (Reference Table 2A.12 PDF CSV)
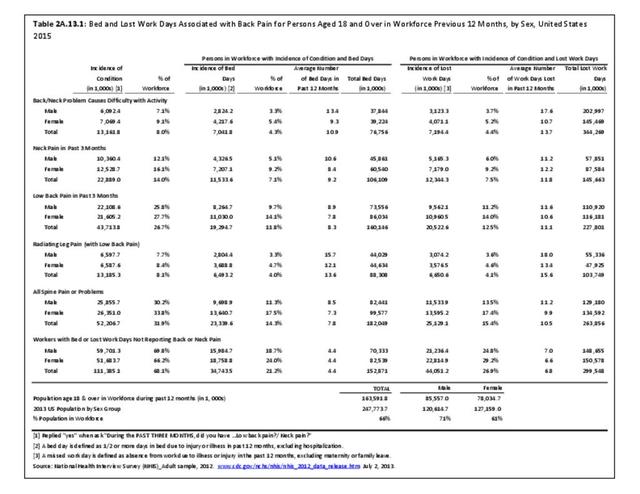
Work days lost due to spine pain or spine problems were more frequently reported by females than males during 2015 (17.4% vs. 13.5%). However, females, on average, lose one less day of work than do men (9.9 to 11.2, respectively). (Reference Table 2A.13.1 PDF CSV)

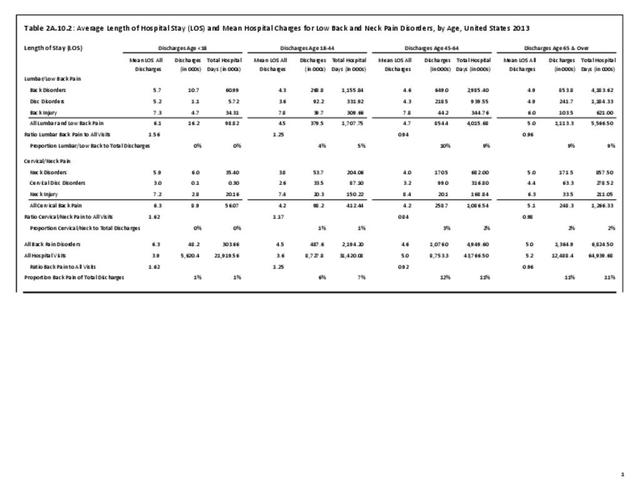
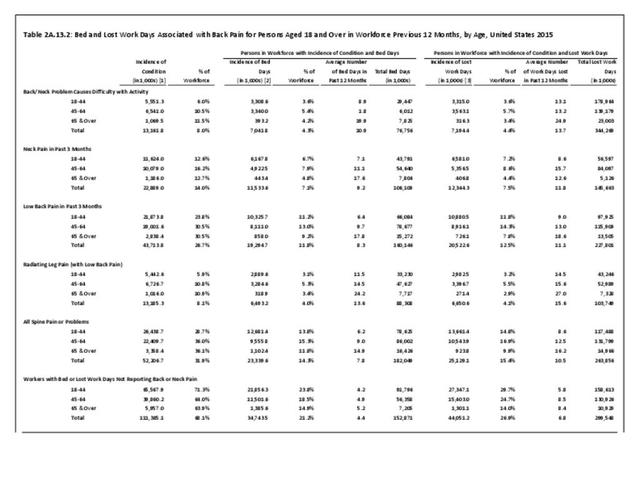
Back pain severe enough to keep people from working in any occupation is most likely to occur in the 18 to 64 years age group, accounting for 14.8% of persons in the 18 to 44 years age group, and 16.9% of persons in the 45 to 64 years age group. This is, of course, not surprising since those are the most common years in which people work. The average number of workdays lost was 8.6 and 12.5 days for the two age groups, respectively. The oldest group of workers, age 65 years and older, report more than 16 days of work lost due to spine pain or problems, but they constitute such a small group that their impact is less than that of younger workers. (Reference Table 2A.13.2 PDF CSV)
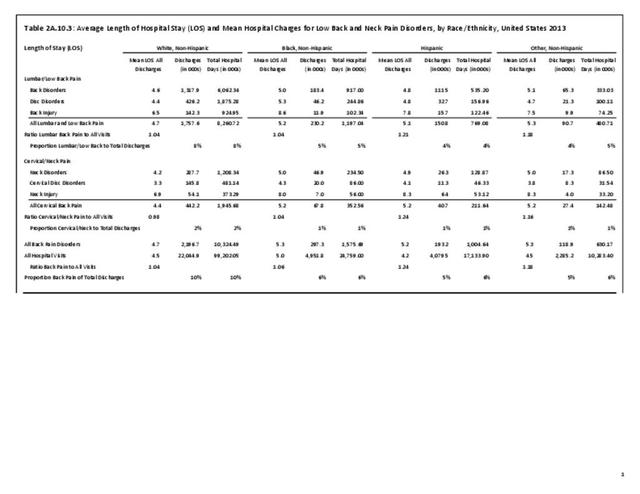
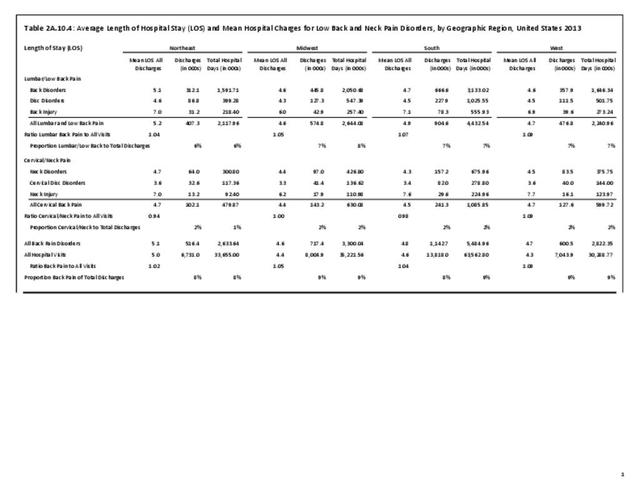
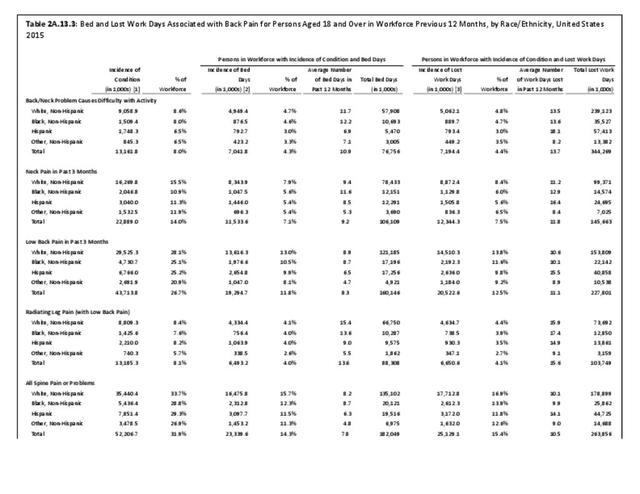
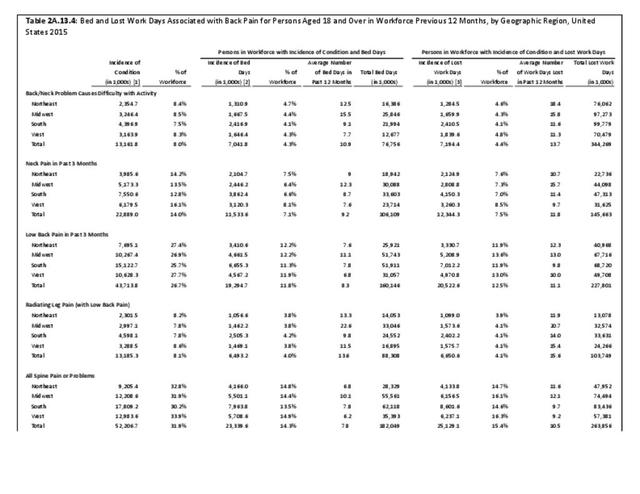
When comparing ethnic groups, Hispanic persons record the highest average number of work days lost due to spine pain (14.1), followed by non-Hispanic whites and non-Hispanic blacks (10.1 days; 9.9 days). No meaningful difference by share of workforce is observed in average number of work days lost due to spine pain according to geographic region, but workers in the Northeast and Midwest regions of the US lose the most days, on average (11.6 and 12.1, respectively). (Reference Table 2A.13.3 PDF CSV and Table 2A.13.4 PDF CSV)
The National Health Care Interview Survey also provides information about the incidence of bed days, days in which a person was in bed for a half day or more due to injury or illness, during 2015. The average number of bed days per worker for all spine pain or problems was 7.8 days. On average, males reported taking 8.5 bed days compared to 7.3 bed days taken by females. The percent of people in the workforce reporting bed days due to spine pain or problems is higher in the 18 to 44 years and 45 to 64 years age groups (13.8% and 15.3%, respectively) than for those age 65 and over. This is likely due to the health status of older workers, who tend to be healthy if they are still in the workforce. Between these two age groups, persons 45 to 64 take approximately 3 more bed days than persons 18 to 44 (9.0 vs 6.2). Persons in the 65-year and older age group have the highest average bed days lost per worker due to spine pain or problems (14.9) however, a smaller proportion (11.8%) of this already small workforce reported having bed days from spine pain. Non-Hispanic white and non-Hispanic black persons recorded more bed days due to spine pain or problems (8.2; 8.7) than Hispanic persons (6.3). Comparing geographic regions, patients in the Midwest report the most bed days for spine pain (10.1), more than all other regions. (Reference Table 2A.13.1 PDF CSV; Table 2A.13.2 PDF CSV; Table 2A.13.3 PDF CSV; and Table 2A.13.4 PDF CSV)

In total, 52.2 million adults in the US workforce spent more than 182 million days in bed in 2015 because of back pain, and during the same time period, almost 264 million work days were lost. The corresponding numbers of days in bed and work days lost in 2012 were 171 million and 291 million, respectively. Approximately one-third of the total workforce (31.9%) reported bed or lost work days due to back pain, but accounted for more than half of total bed days (54%0 and nearly half of total lost work days (47%). The 111.4 million workers not reporting back pain as the cause had 152.9 million bed days and 299.5 million lost work days in 2015. (Reference Table 2A.13.1 PDF CSV)


Edition:
- Fourth Edition