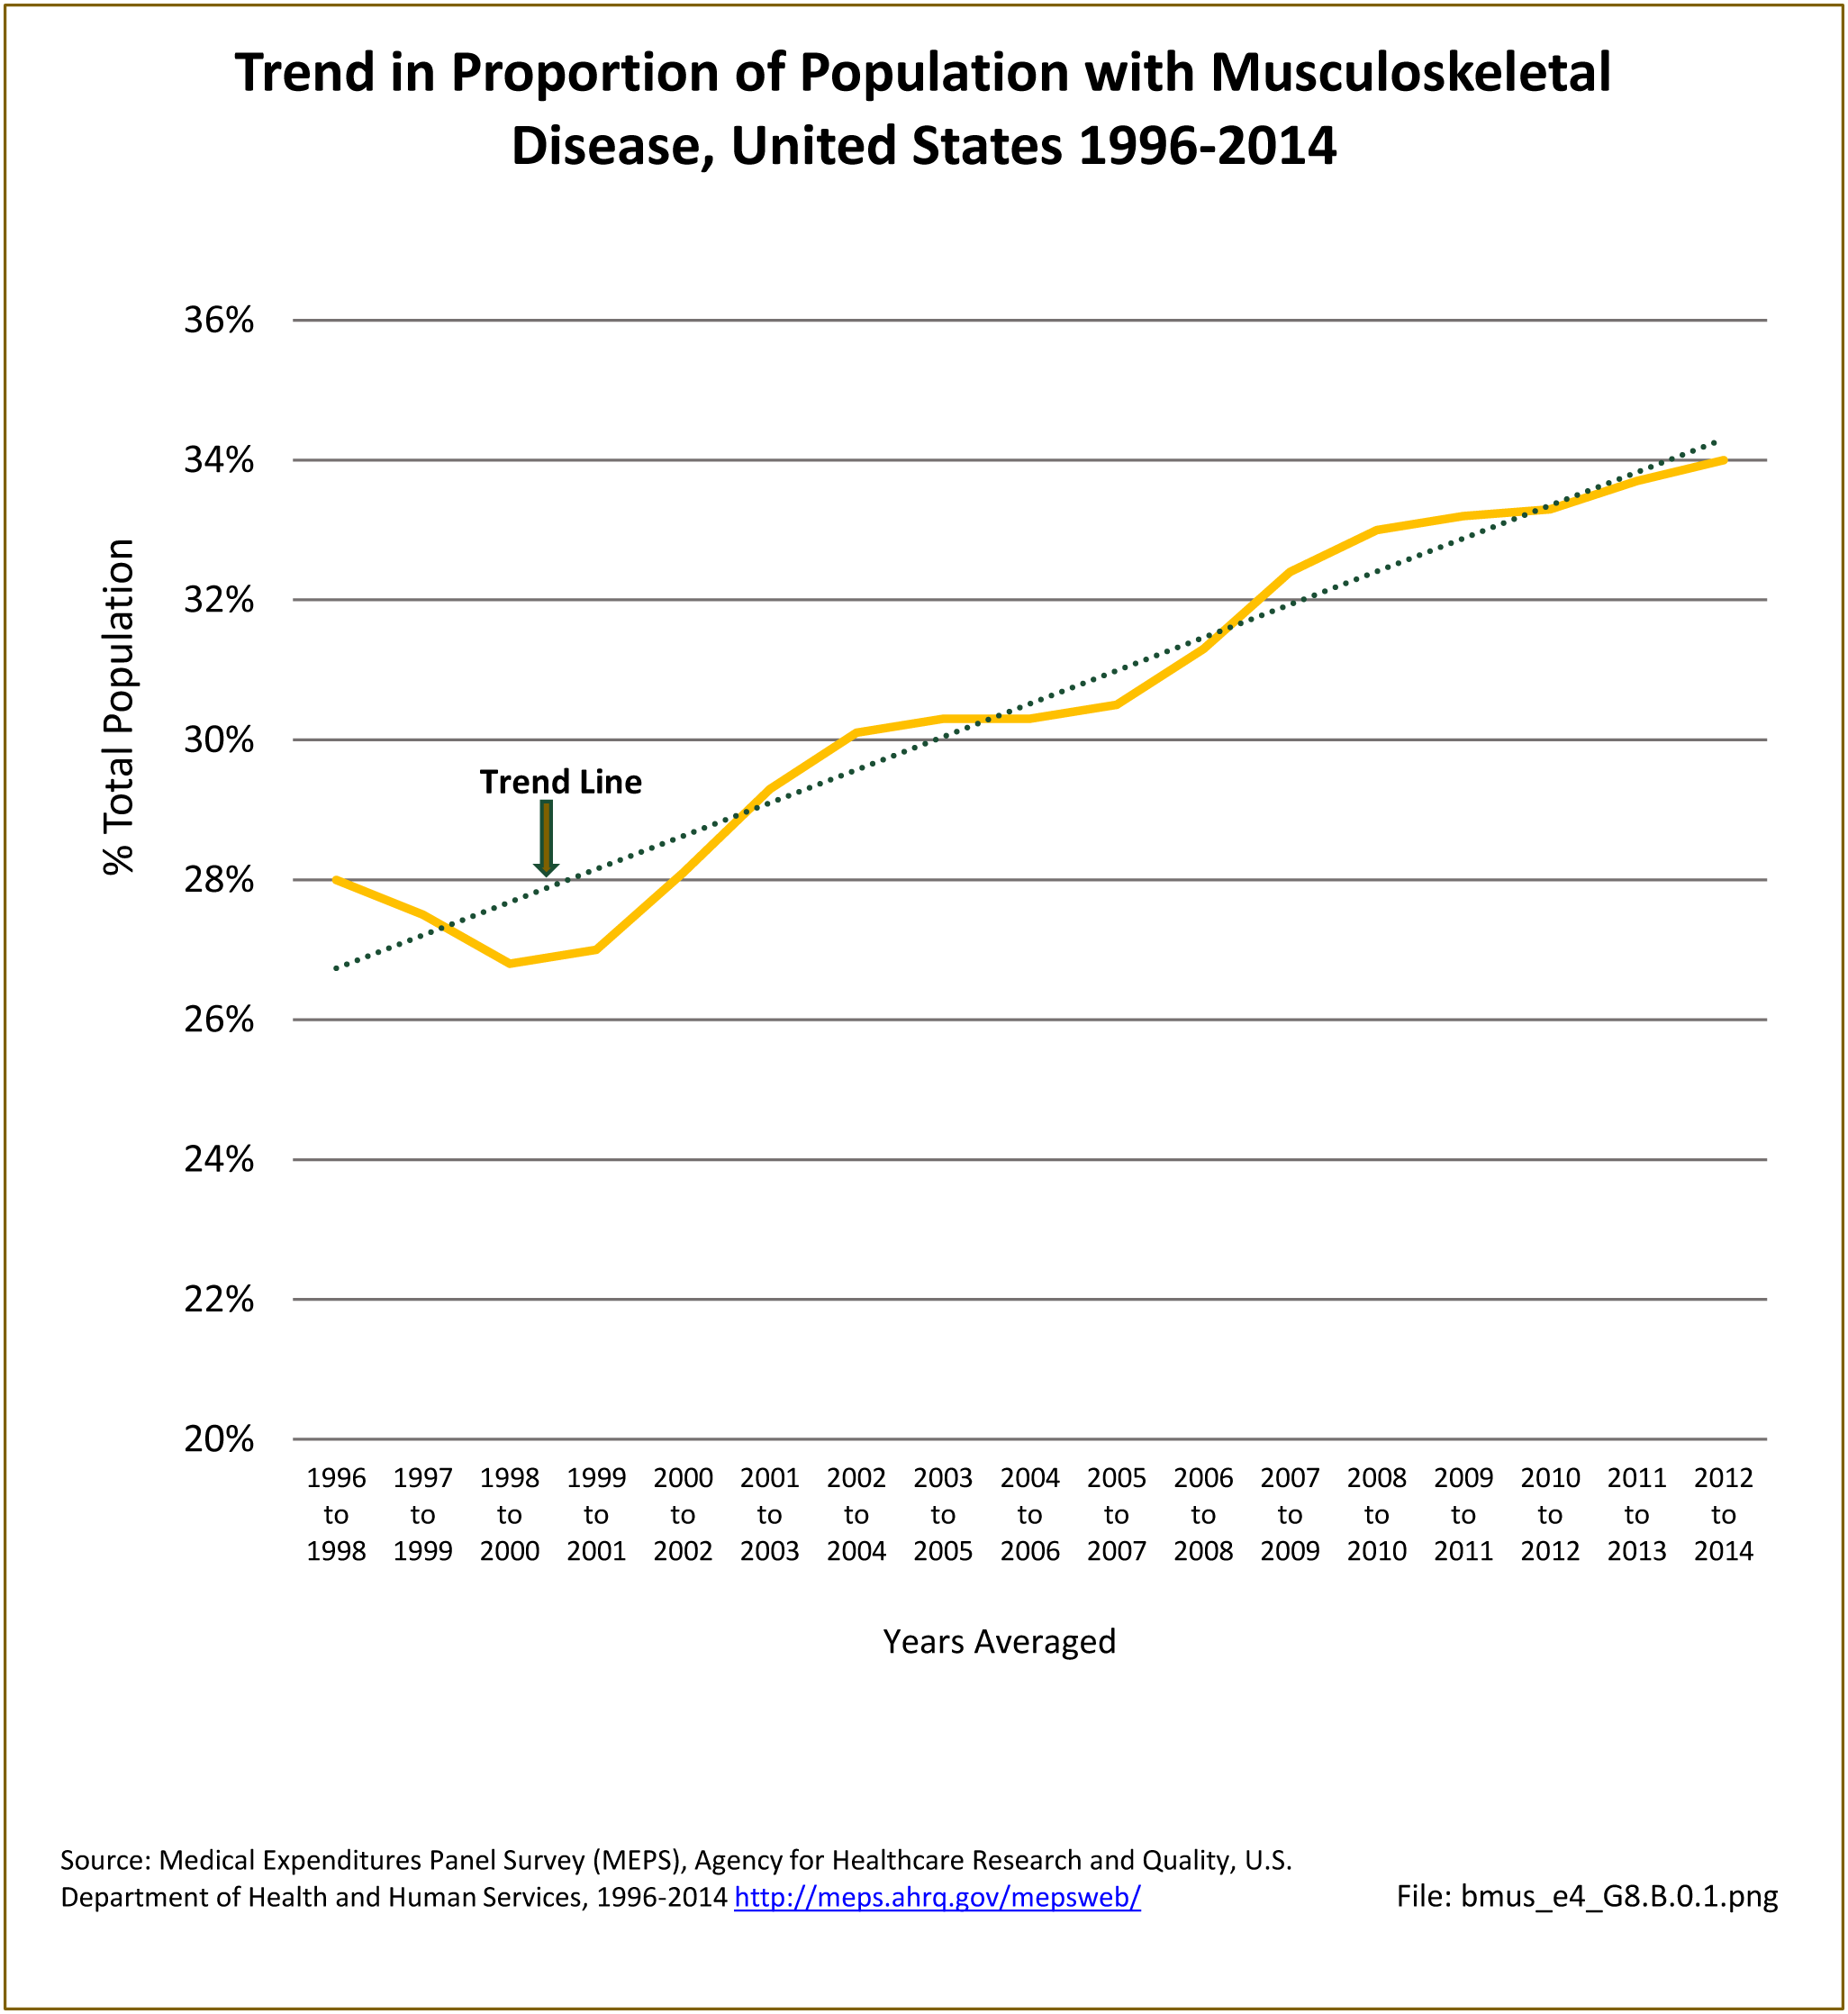
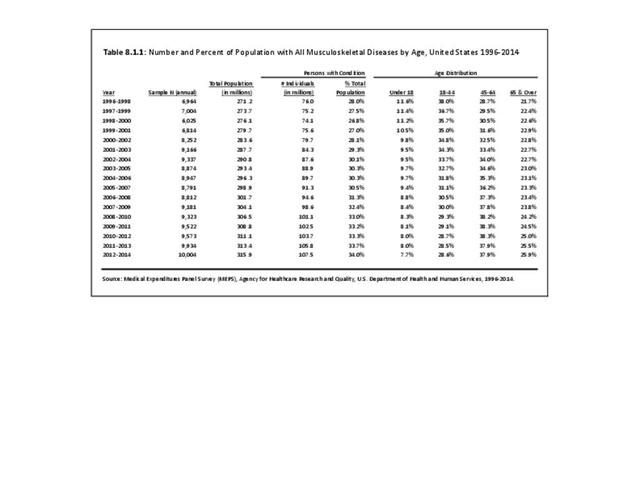
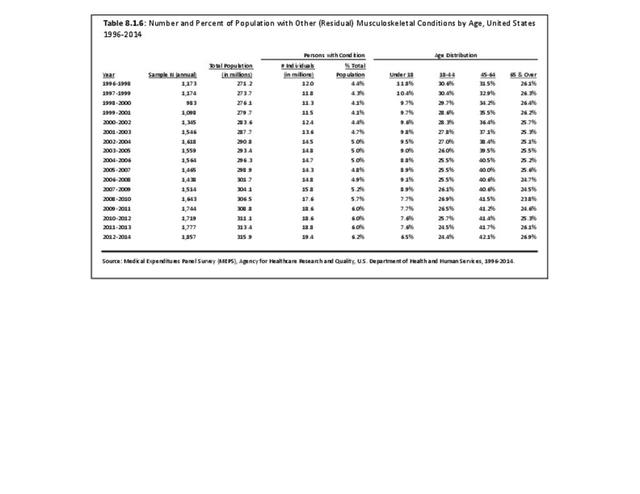
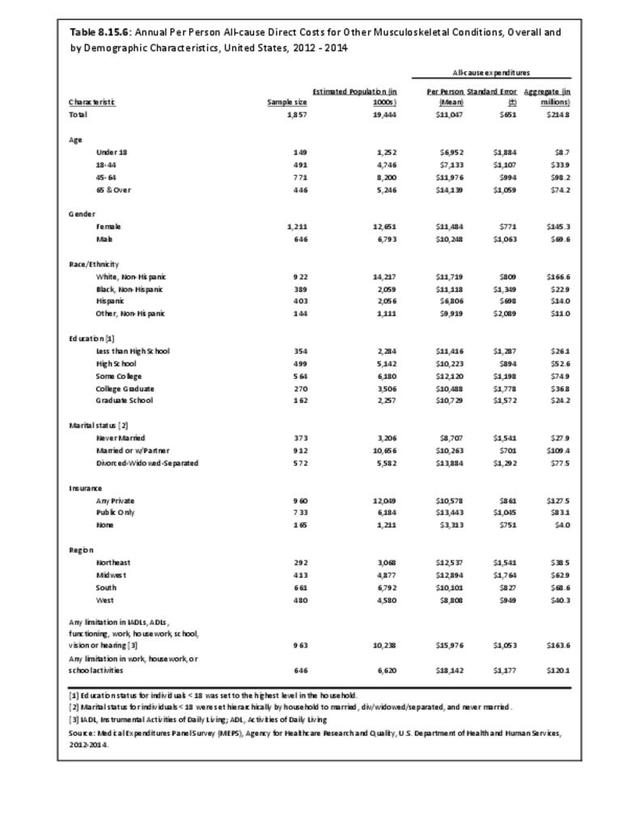
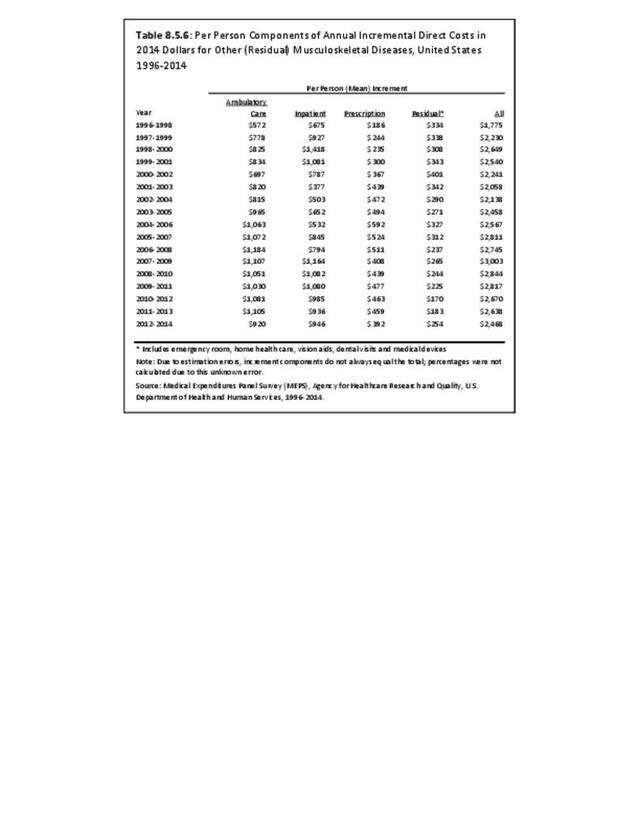
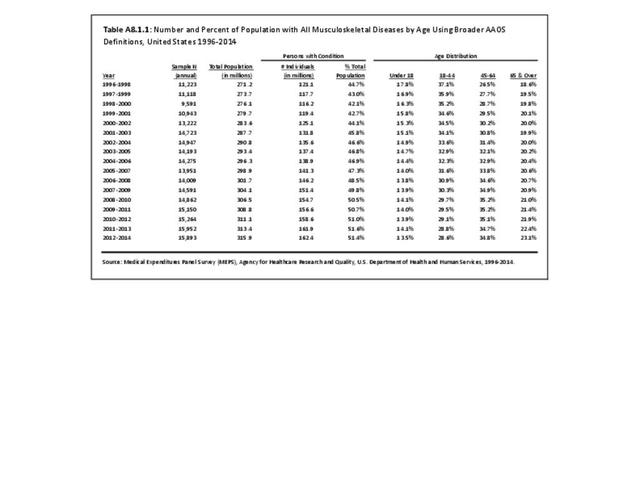
The overall increase in the prevalence rate of musculoskeletal diseases, from 28.0/100 persons in 1996-1998 to 34.0/100 in 2012-2014, masks different rates of change for specific musculoskeletal conditions. The prevalence rate of arthritis and joint pain almost doubled during this time, from 10.7 to 20.8/100 and the prevalence rate of osteoporosis increased by about 50%, from 1.2 to 1.8/100. However, there was relatively little change in the prevalence rate of spine conditions (10.1/100 in 1996-1998 and 11.0/100 in 2012-2014) and of injuries (8.6 and 8.3/100 in the two periods, respectively). Although the prevalence rate of the residual category, “Other Musculoskeletal Conditions” appeared to increase, from 4.4 in 1996-1998 to 6.2/100 in 2012-2014, this may be due to changes in detection and coding conventions.

Spine Diseases
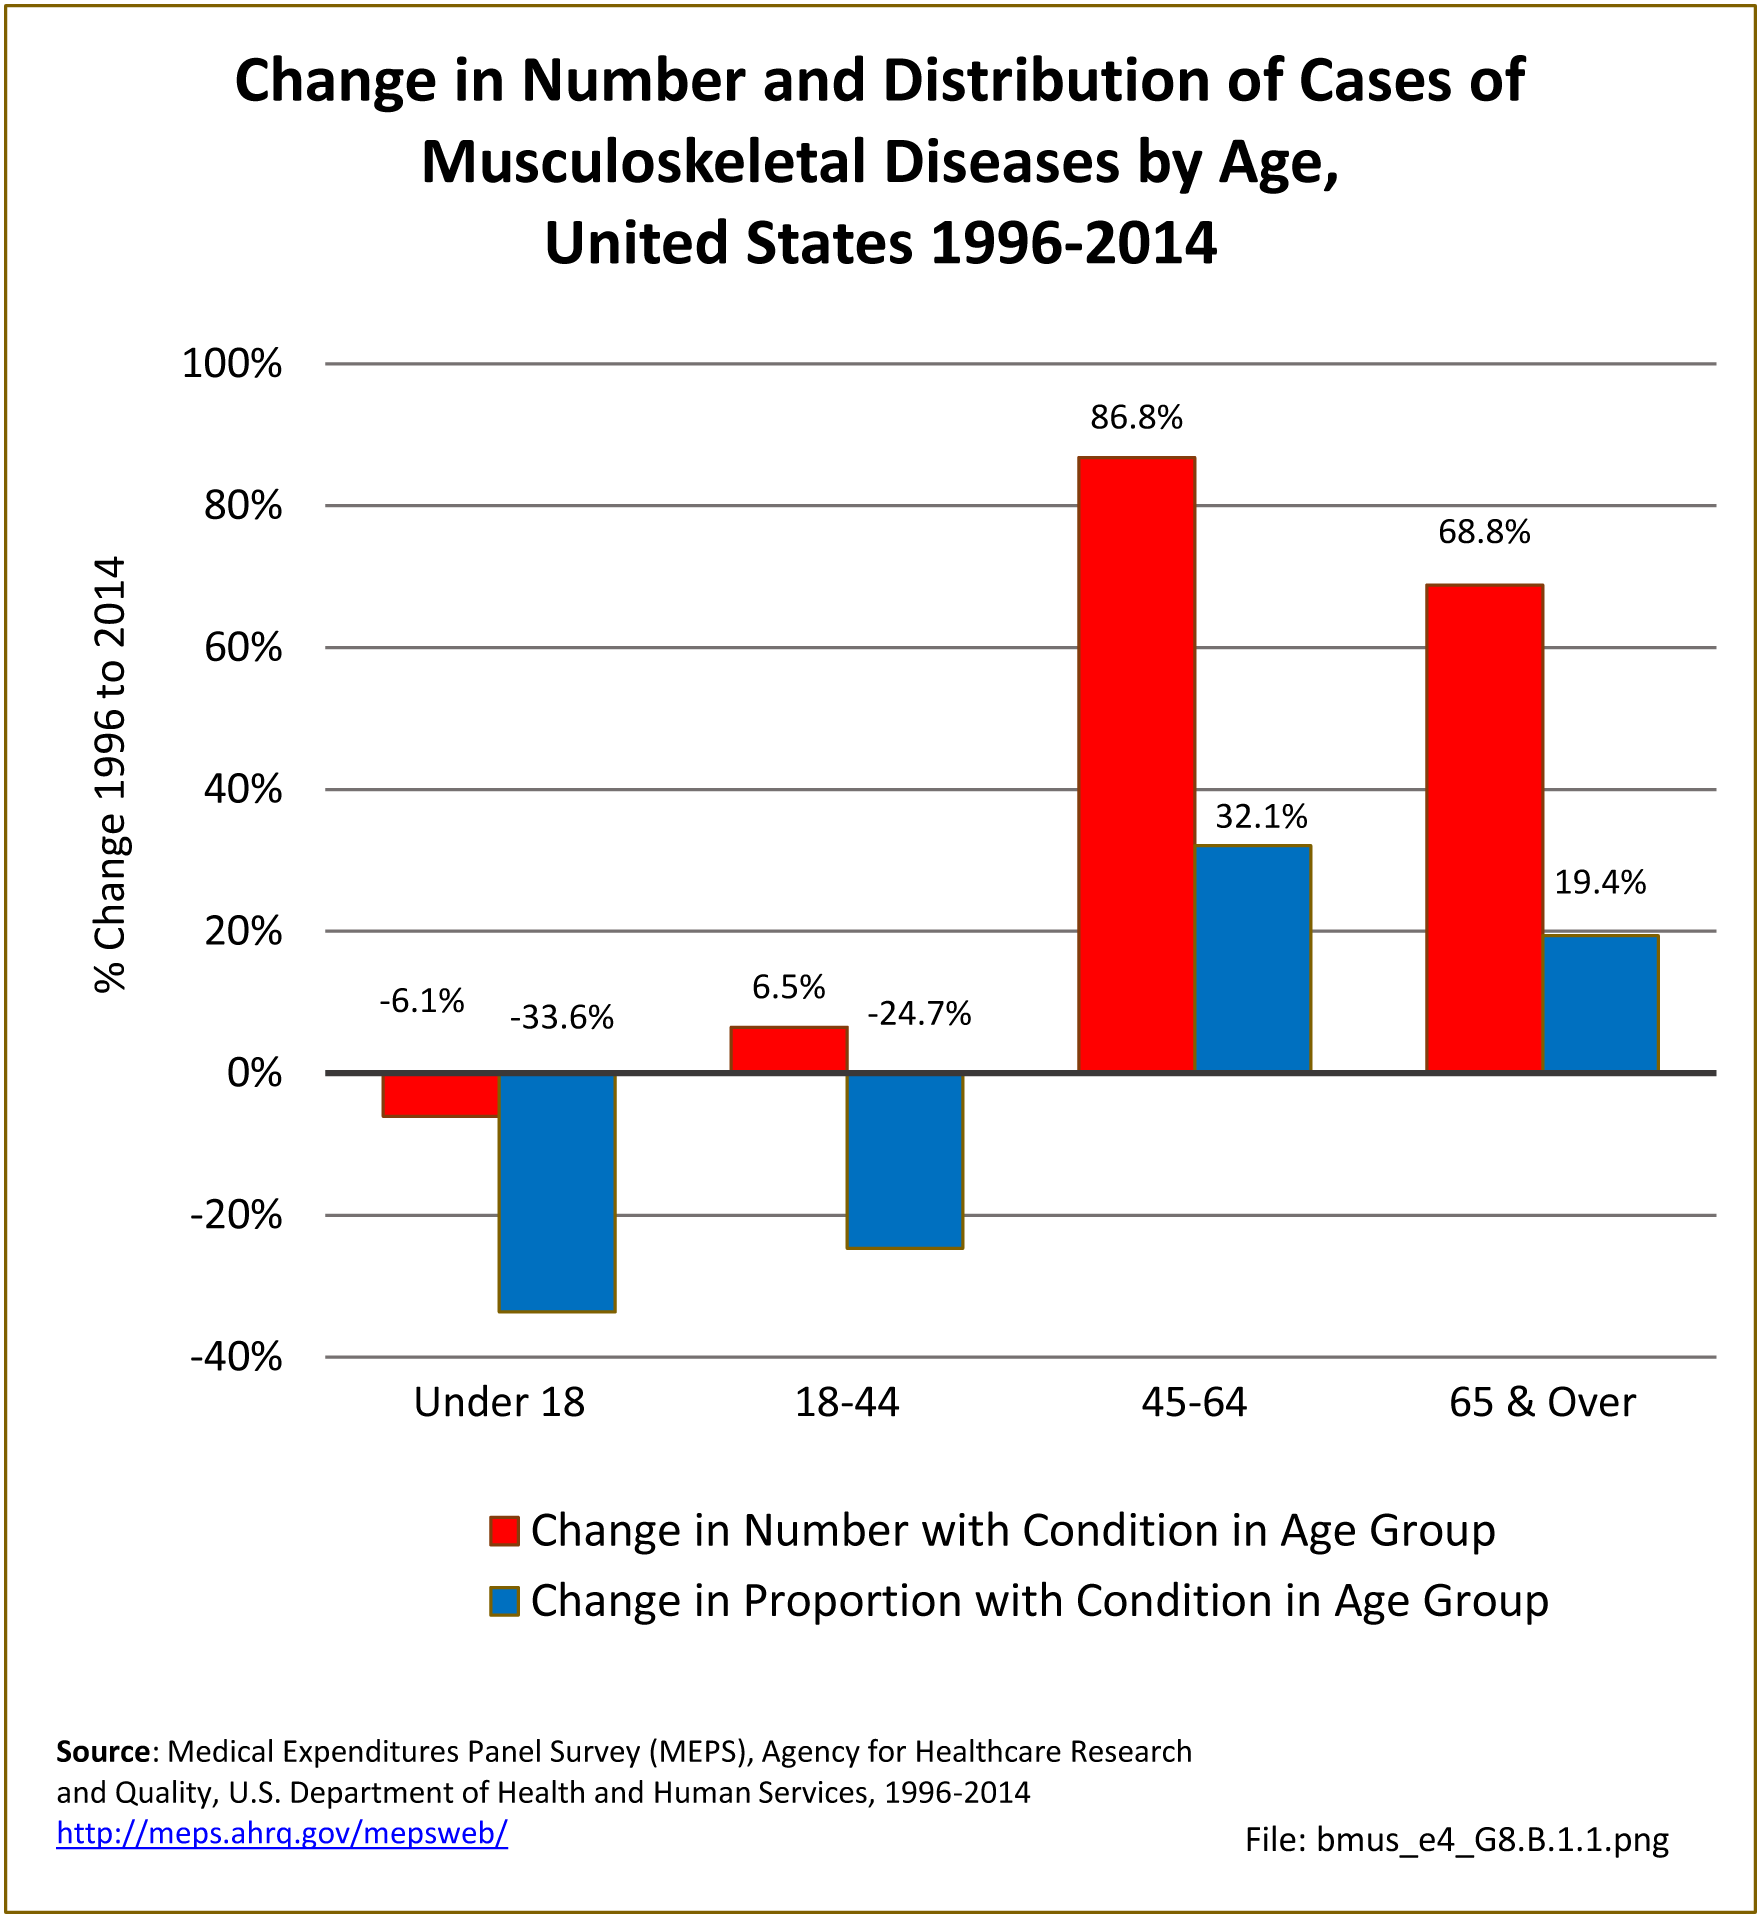
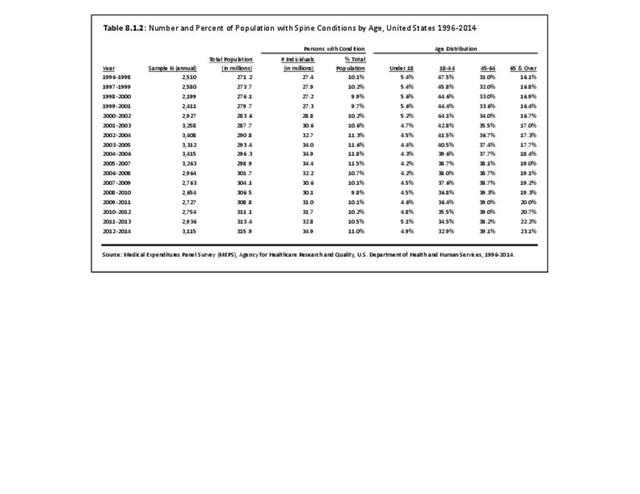
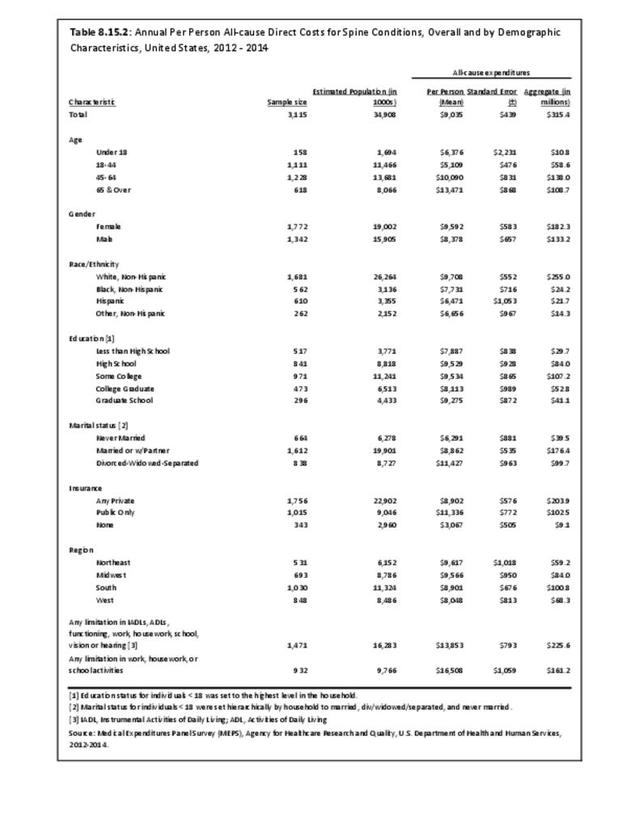
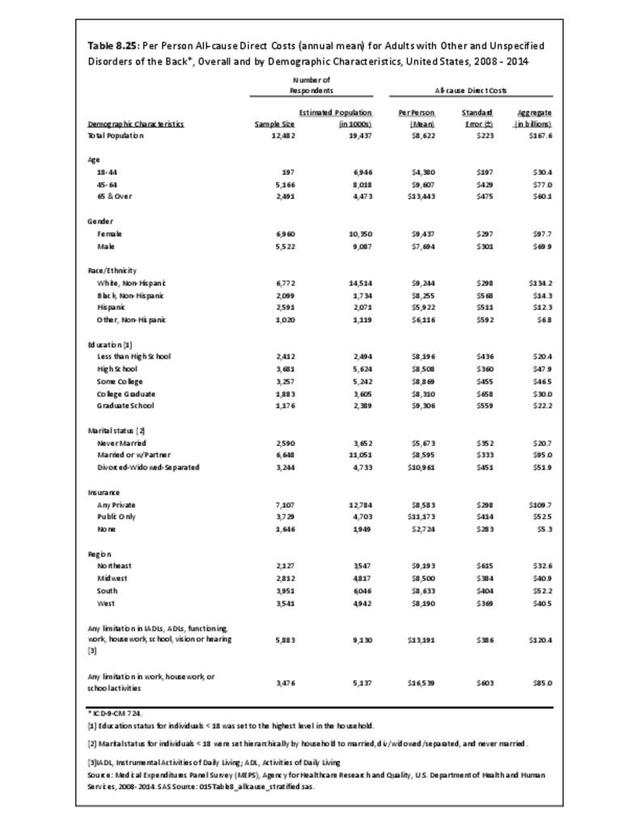
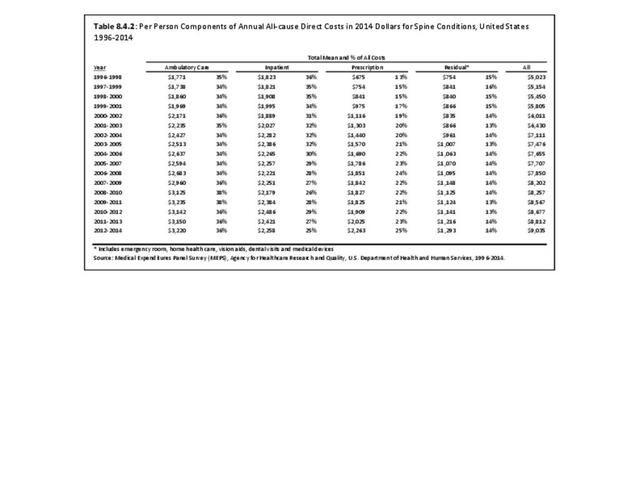
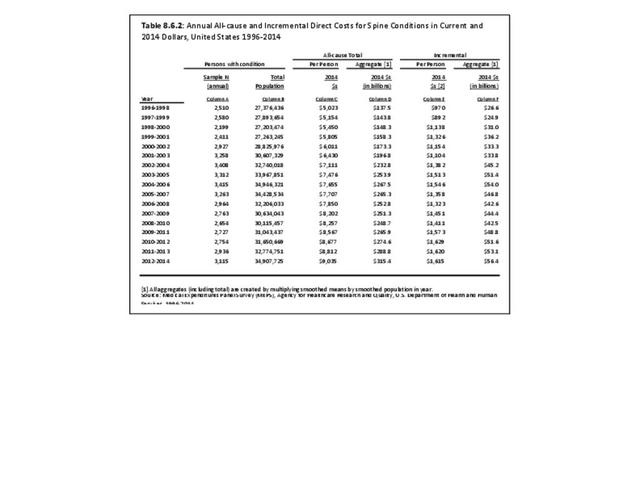
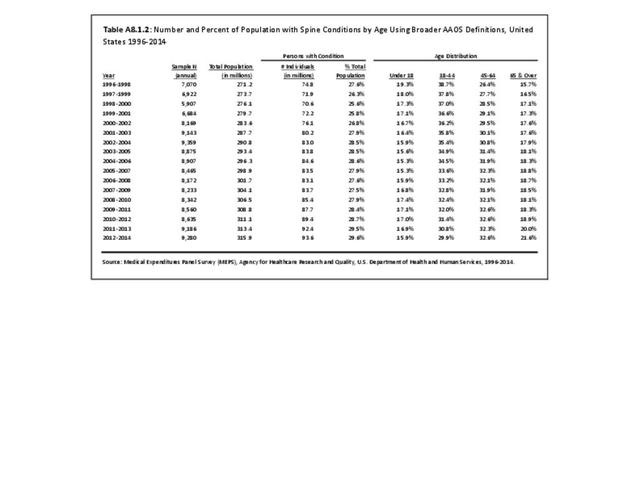
As noted above, the overall prevalence of spine conditions changed little between 1996-1998 and 2012-2014; however, the number of persons reporting the conditions increased from 27.4 million in the earlier period to 34.9 million in the latter due to population growth. Nearly three-fourths of spine conditions occur in the working-age population, with just under a third reported by those aged 18-44 in 2012-2014 while another 39.1% reported by those 45-64 during this time frame. The high prevalence in these working-age groups explains the high rate of workers’ compensation and disability cases associated with spine conditions. Nevertheless, a significant share of spine conditions was reported by those 65 and older in 2012-2014 (23.1%), the prevalence rate among persons this age group rising from 16.1/100 in 1996-1998, or by more than 40% in relative terms. (Reference Table 8.1.2 PDF CSV)
Arthritis and Joint Pain
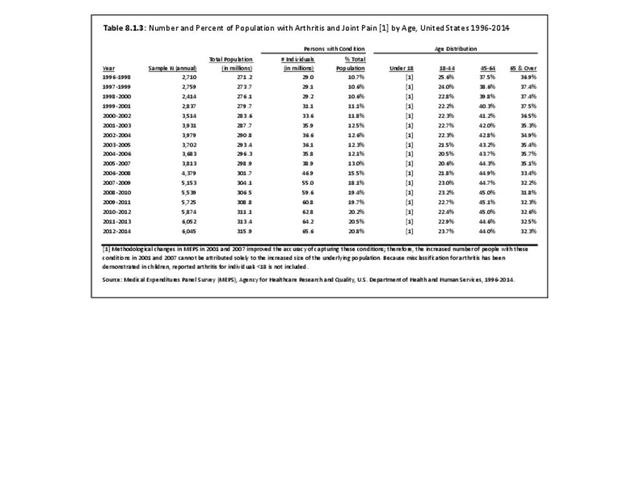
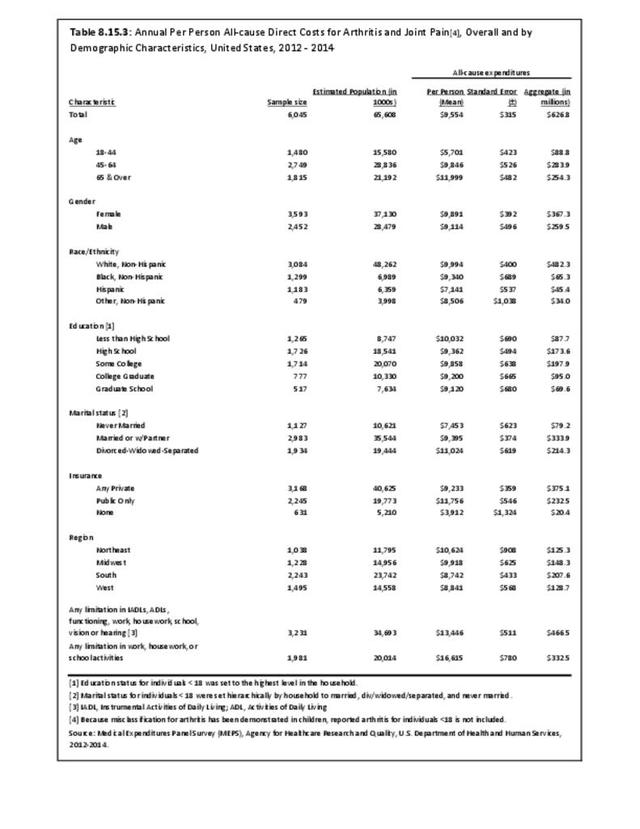
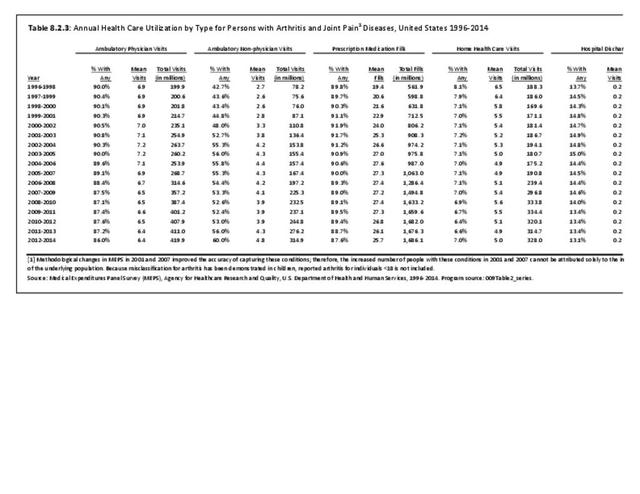
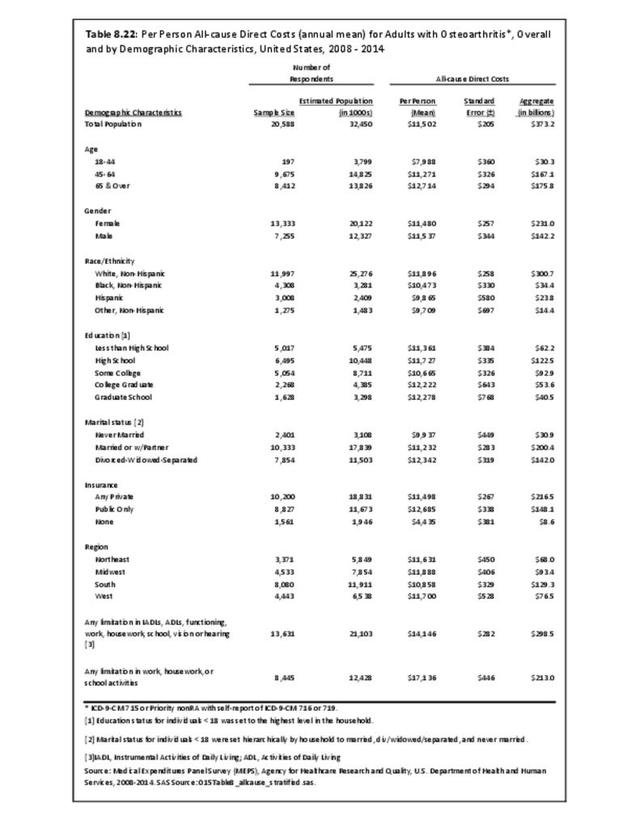
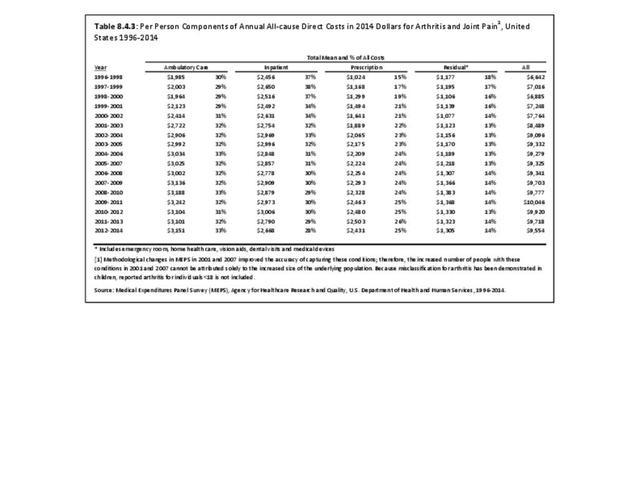
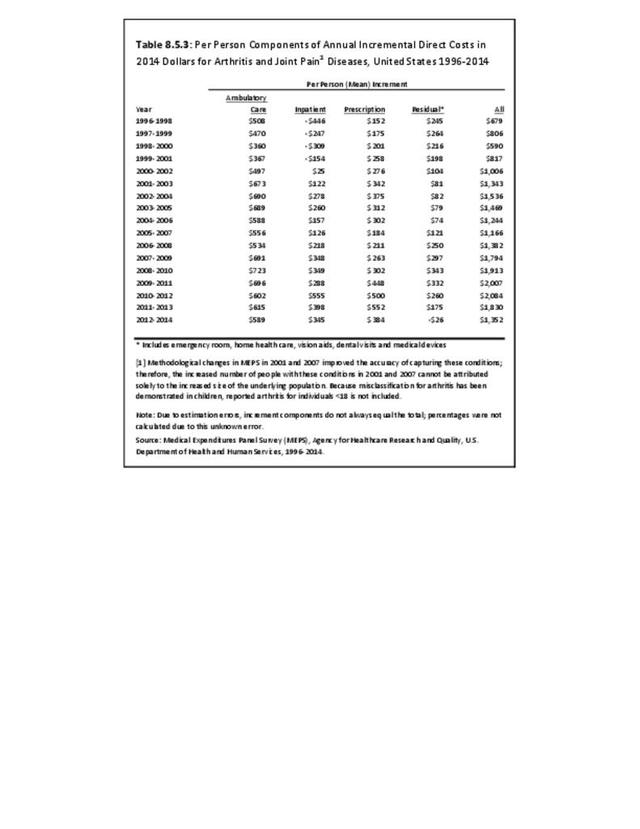
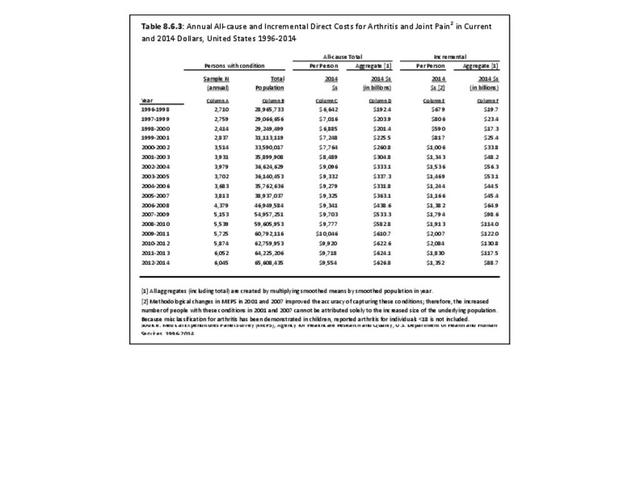
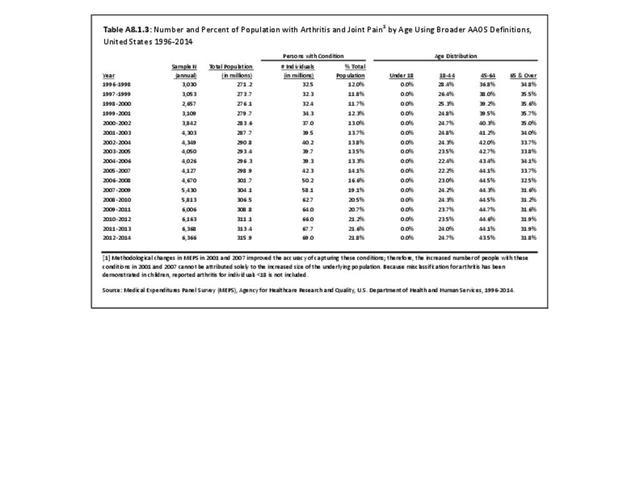
Among the major subgroups of musculoskeletal diseases, arthritis and joint pain have the highest prevalence. In 1996 to 1998, 29.0 million persons (10.7%) reported one or more conditions related to arthritis and joint pain; by 2012-2014, 65.6 million persons (20.8%) reported one or more such conditions. However, the increased number of people with these conditions between 1996-1998 and 2012-2014 cannot be attributed solely to the increased size of the underlying population as methodological changes in MEPS over time improved the accuracy of capturing these conditions. The aging effect of the baby-boom generation has resulted in an increase in the proportion of arthritis cases among those age 45 to 64 years as they reach the typical onset age for arthritis. As the baby boomers continue to age, the proportion of persons with arthritis in the 65-year and older age group will increase as well. In 1996-1998, 25.6% of persons reporting arthritis were age 18 to 44 years and 37.5% were age 45 to 64 years. By 2012-2014, the proportion of persons aged 18-44 years reporting arthritis had declined slightly to 23.7% while the proportion among those aged 45-64 had increased to 44.0%. (Reference Table 8.1.3 PDF CSV)
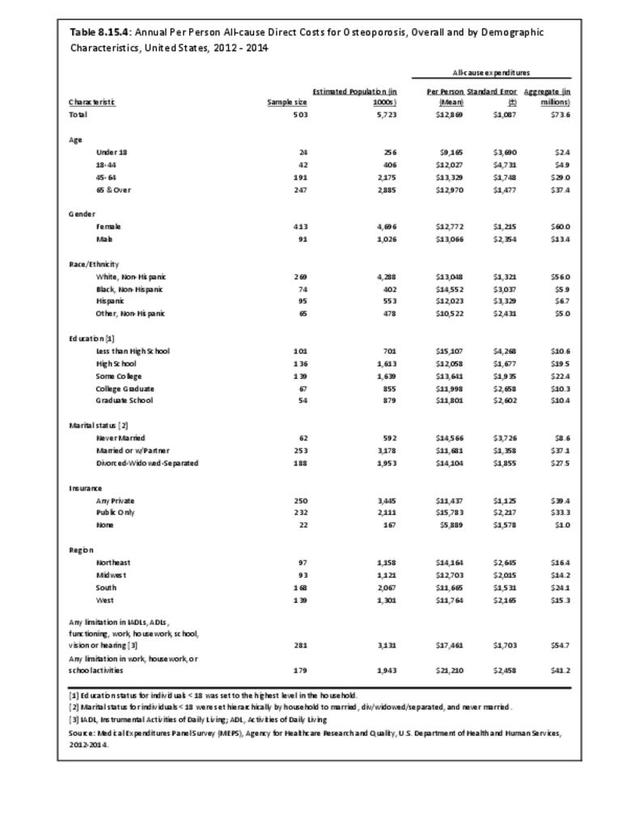
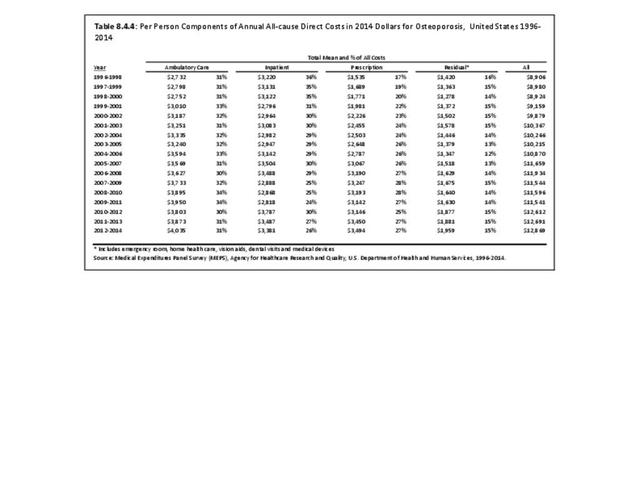
Osteoporosis
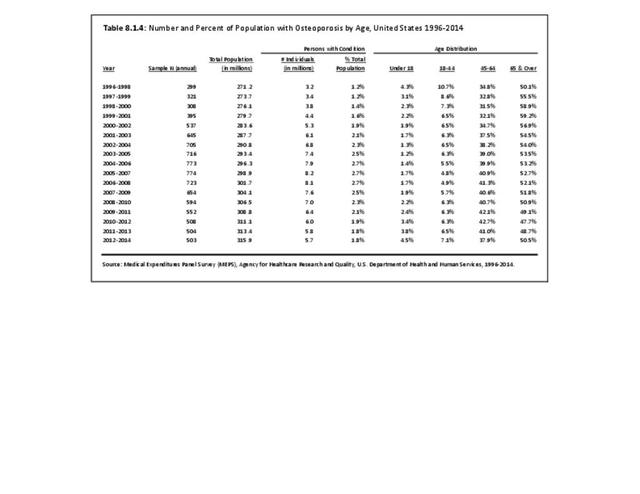
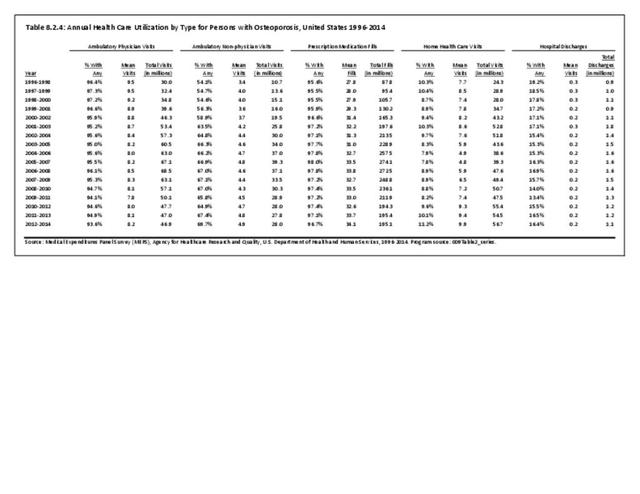
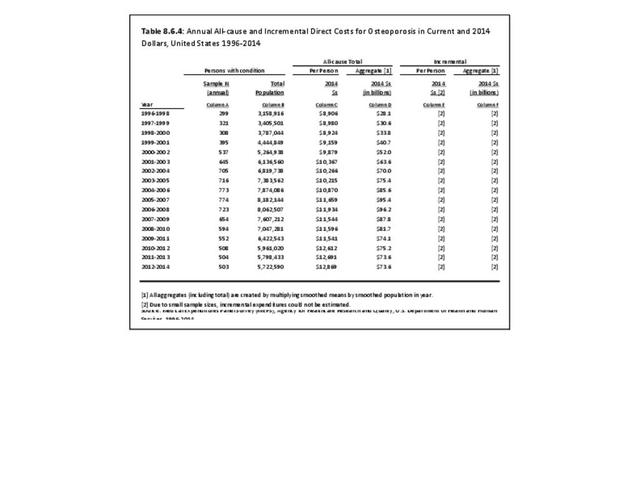
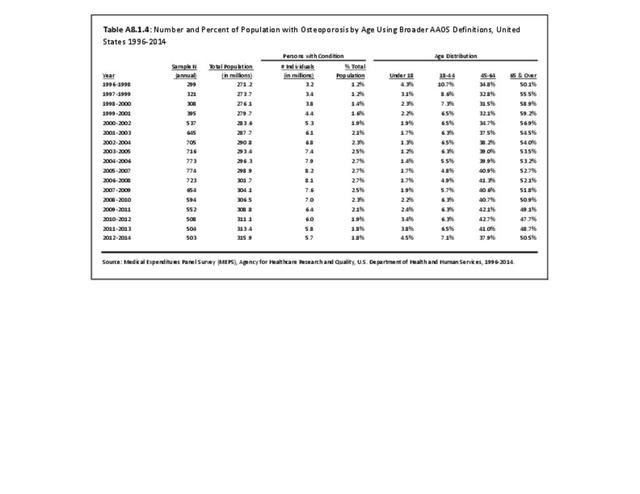
Population aging has also led to a dramatic increase in the number of individuals with osteoporosis. In the period from 1996-1998, 3.2 million people (1.2% of the population) indicated they had these conditions, but by 2012-2014, 5.7 million (1.8% of the population) reported having them. However, the prevalence rate in MEPS has declined from a high of 2.7% in 2004-2006, 2005-2007, and 2006-2007 to the current rate, 1.8%. The prevalence as reported in MEPS is substantially lower than numbers reported in other sources, even though the category in this chapter is not limited to osteoporosis-related conditions. Estimates of the number of persons with osteoporosis and low bone mass, the precursor to osteoporosis, were 53.6 million in 2010, and projected to increase to 71.4 million by 2030.1
About 38% of persons in the MEPS reporting these conditions are age 45 to 64 years, increasing the likelihood that these individuals will suffer from falls and fractures for the relatively long future they can expect to live with this condition. A greater number (50.5%) are age 65 or over and already at risk for falls and fractures. (Reference Table 8.1.4 PDF CSV)
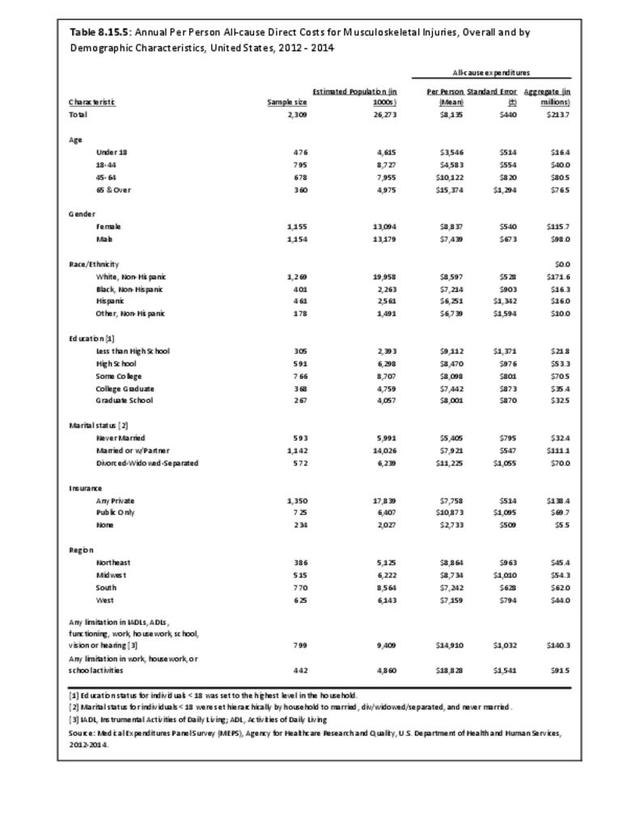
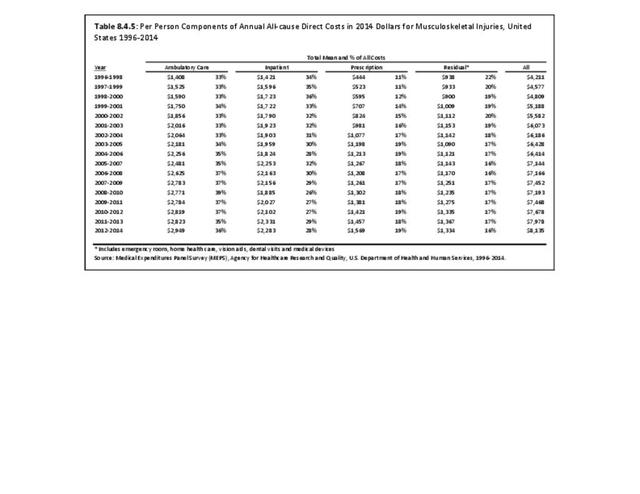
Injuries
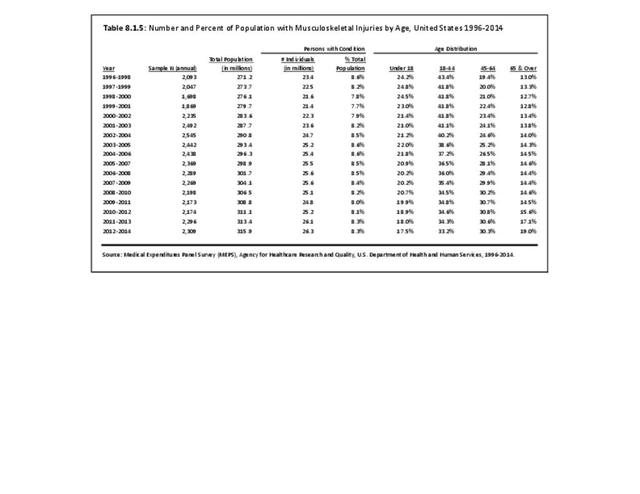
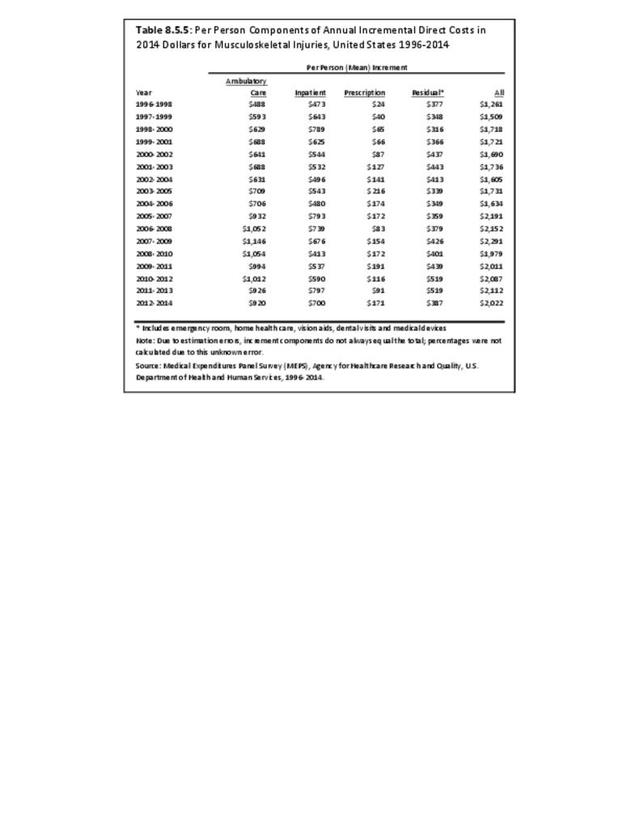
In 1996-1998, 23.4 million persons reported a musculoskeletal injury, while 26.3 million reported such an injury in 2012-2014. The prevalence of musculoskeletal injuries remained relatively constant at 8.6% and 8.3% of the population in the two three-year periods, respectively. Age distribution of injuries may explain why the prevalence has not increased. About half of injuries occur among persons younger than 45 years, a population segment growing more slowly than those who are older. It is possible improvements in the safety of automobiles and other public health prevention activities have also played a role. Although the MEPS reporting of musculoskeletal injury trends supports trend data previously reported, the overall prevalence is substantially lower than the 40.8 million injury treatment episodes reported in the Injuries section of this report. Injury treatment episodes include total cases treated in doctors' offices, outpatient clinics, emergency rooms, and inpatient admissions in 2010. (Reference Table 8.1.5 PDF CSV)
Expansive Definition by Condition
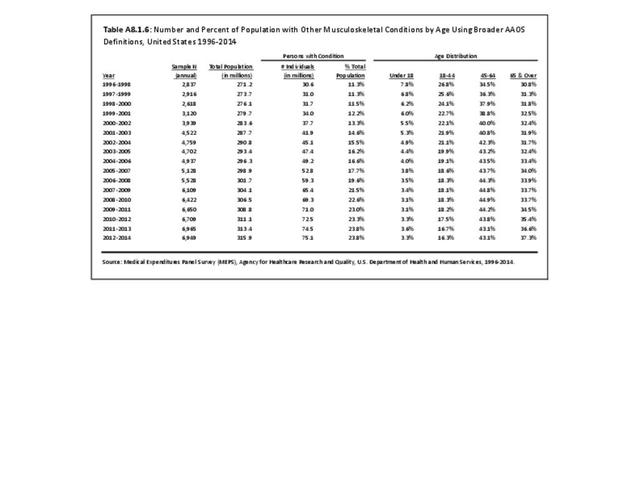
Using the more expansive definition of musculoskeletal diseases, in 2012-2014, 93.6 million persons (versus 34.9 million using the more conservative definition) reported one or more spine conditions and 69.0 million (versus 65.6 million) reported arthritis and joint pain. The base and expansive definitions for osteoporosis are identical, so the number of cases for both definitions are also identical, but substantially lower than reported in the Osteoporosis section of this report, as previously noted. The number reporting musculoskeletal injuries was slightly higher than in the more conservative definition (30.3 versus 26.3 million). The increased prevalence in the “other” musculoskeletal diseases category was also substantial, with 75.1 million in the expansive definition versus 19.4 million. (Reference Table A8.1.2 PDF CSV; Table A8.1.3 PDF CSV; Table A8.1.4 PDF CSV; Table A8.1.5 PDF CSV; and Table A8.1.6 PDF CSV)
- 1. Wright NC, Looker AC, Saag KG, et al.: The recent prevalence of osteoporosis and low bone mass in the United States based on bone mineral density at the femoral neck or lumbar spine. JBMR 2014;29(11):2520-2526. doi: 10.1002/jbmr.2269.
Edition:
- Fourth Edition