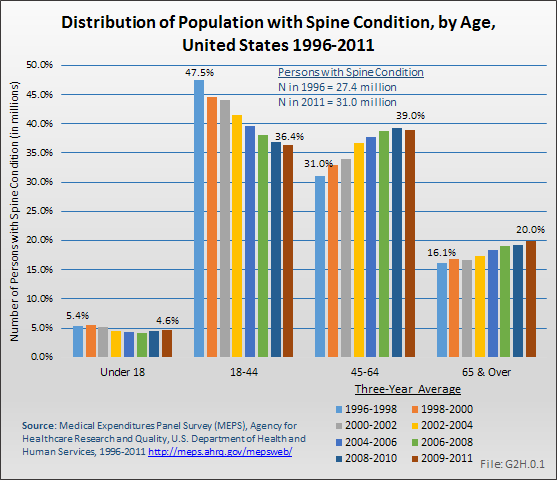
Between the years 1996 to 1998 and 2009 to 2011, the number of persons in the population reporting a spine condition rose from 27.4 million to 31.0 million, but the proportion of total population with a spine condition (10.1%) remained the same in both time periods. However, the distribution of the population with a spine condition, by age group, showed a consistent shift upward as the population ages, reflecting the overall aging of the US population. (Reference Table 10.1 PDF CSV)
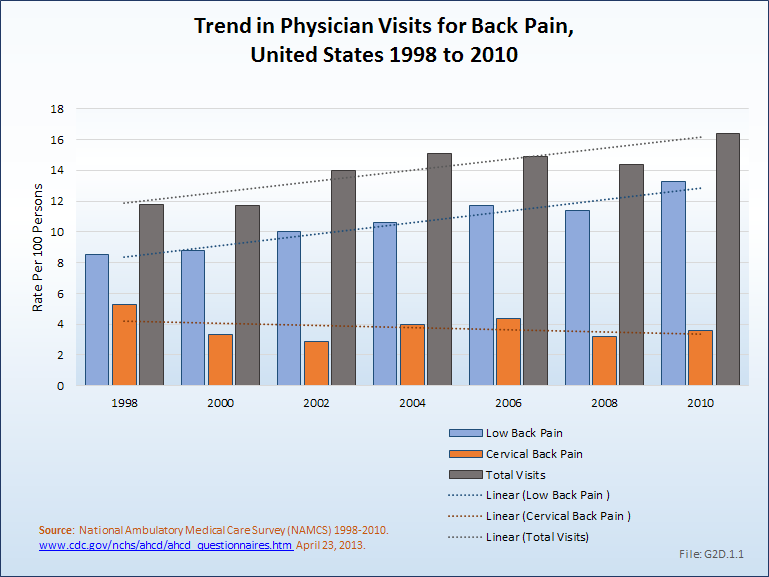
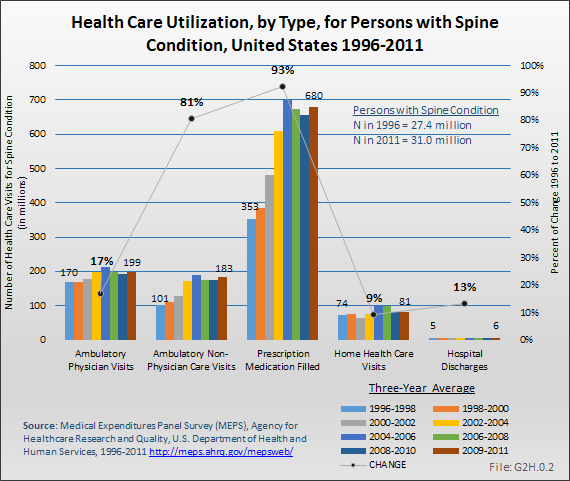
Health care treatments and visits contribute to the burden of spine conditions. Ambulatory physician visits, home health care visits, and hospital discharges all rose by 17%, 9%, and 13%, respectively, between the years 1996 to 1998 and 2009 to 2011. While still accounting for a relatively small number of visits, ambulatory nonphysician care visits rose from 101 million in the earlier time frame to 183 million in the most recent years, an increase of 83%. However, prescription medications for spine conditions show the most dramatic rise, jumping from 353 million prescriptions to 680 million over the two time frames, an increase of 93%. (Reference Table 10.2 PDF CSV) 
Edition:
- 2014


 Download as CSV