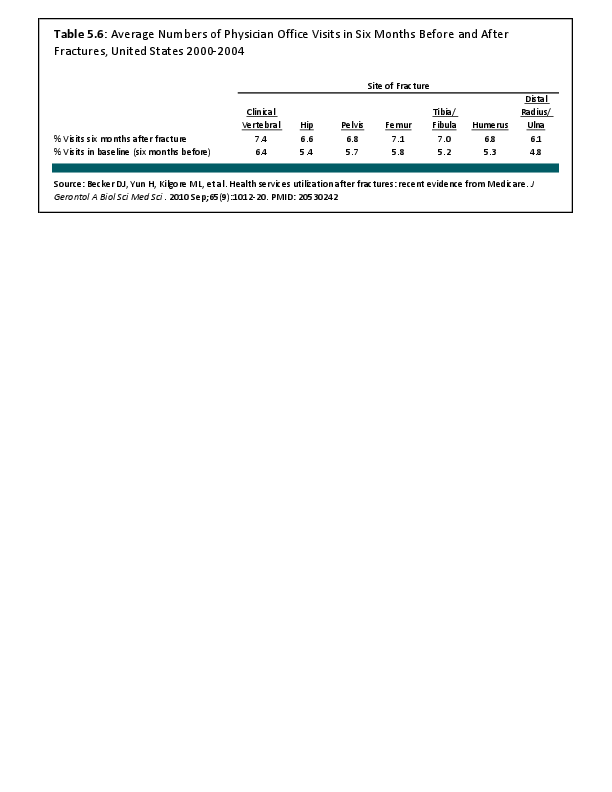
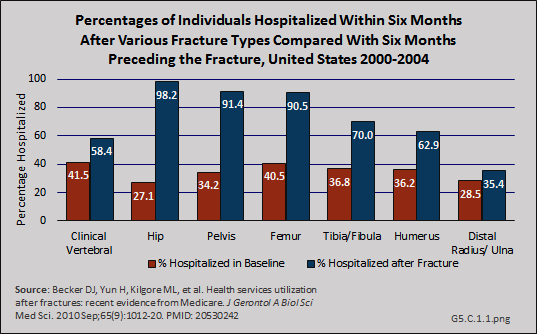
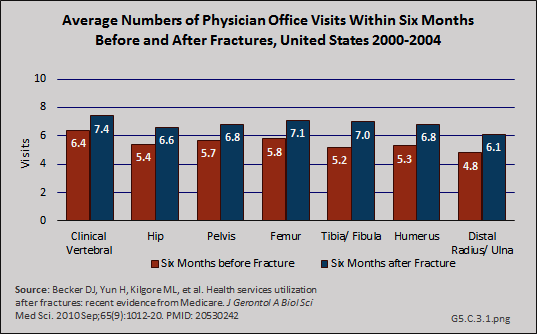
In a recent study, the effect of fracture on physician office visits using a baseline of visits six months before fracture and comparing it to six months after fracture, was less than for hospitalization, but still substantial.1 Fractures of the tibia/fibula had the greatest increase in physician office visits (35% increase in probability of a visit), but this could be because of higher rates of transfer to nursing home care for hip, pelvis, and femur fractures shown in studies discussed previously. (Reference Table 5.6 PDF CSV)

Following fractures, utilization of physical and occupational therapy services increased by similar proportions.1
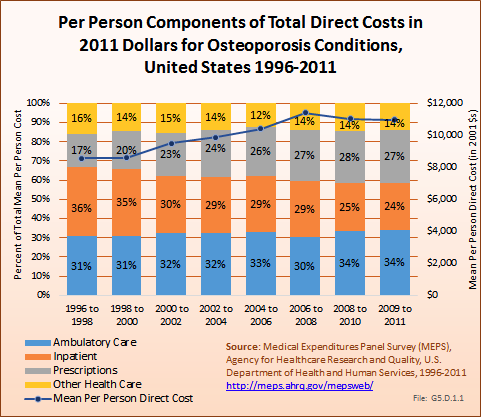
Although the mean number of ambulatory physician visits for osteoporosis care from the MEPS study, the data upon which estimated cost burden from osteoporosis is based, declined between 1996 and 1998 and between 2009 and 2011, the total number of visits over this timeframe increased by 67% because of the larger number of people with osteoporosis. Because the MEPS data is based on only an osteoporosis diagnosis rather than a fracture diagnosis, the actual numbers may be larger than reported.
Again, using the MEPS, the mean number of home health visits for osteoporosis between 1996 and 1998 was 7.7; from 2009 to 2011 it was 7.4. However, the total number of visits rose from 24.3 million to 47.5 million due to the rise in reported prevalence of osteoporosis. Ambulatory nonphysician health care visits nearly tripled, increasing from 10.7 million to 28.9 million, due to an increase in both mean number of visits and the share of persons with reported osteoporosis who made at least one such visit. (Reference Table 10.2 PDF CSV)
Edition:
- 2014
 Download as CSV