Scholastic sports has seen an 80% increase in participation between 1971 and 2005. These high school athletes experience an estimated 2,000,000 injuries, 500,000 doctor visits, and 30,000 hospitalizations per year.
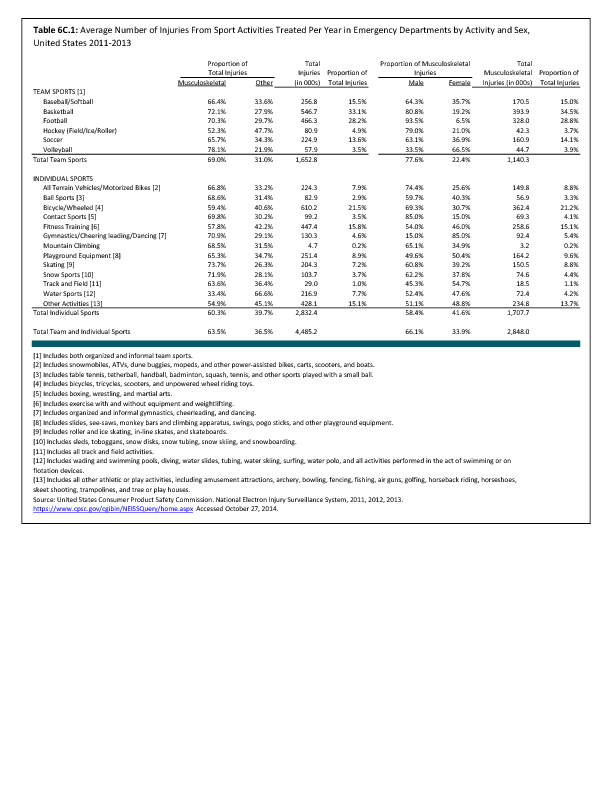
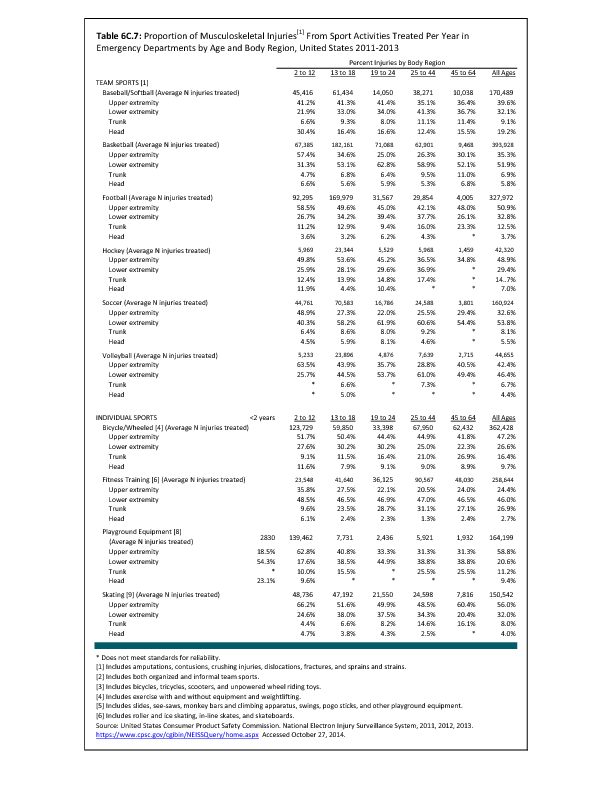
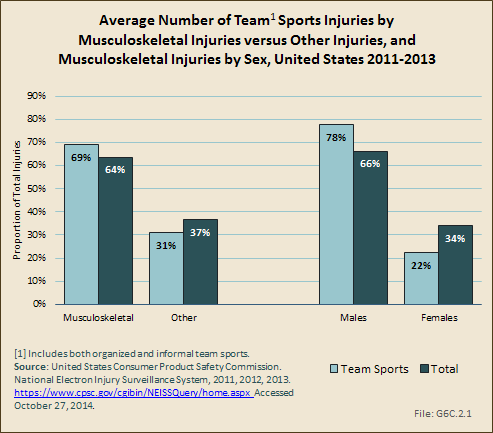
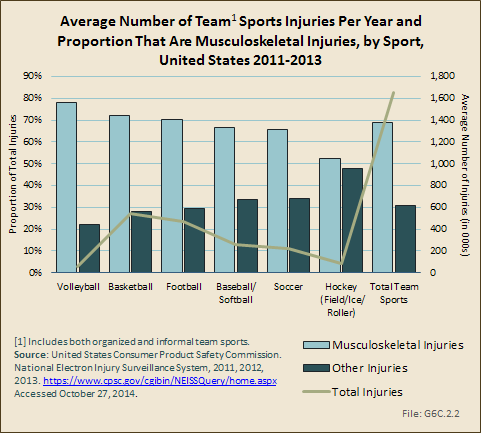
Using the NEISS dataset, more than 1.6 million injuries occurring as the result of team sports were reported in EDs in the United States annually in the three years studied. Musculoskeletal injuries comprised 69% of team sport injuries seen in the ED. The team sports causing the most injuries are basketball and football, which comprise 33% and 28%, respectively, of all injuries seen. (Reference T6C.1 PDF CSV)
Volleyball has the highest proportion of musculoskeletal injuries among the team sports, but accounts for a small number of total injuries. Hockey sports injuries, including field, ice, and roller hockey, are split about evenly between musculoskeletal injuries and other types of injuries. (Reference T6C.1 PDF CSV)
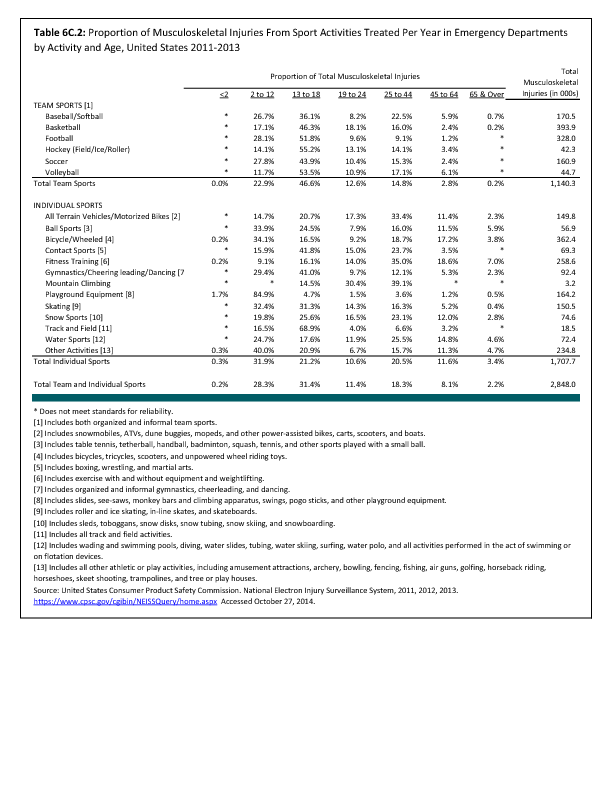
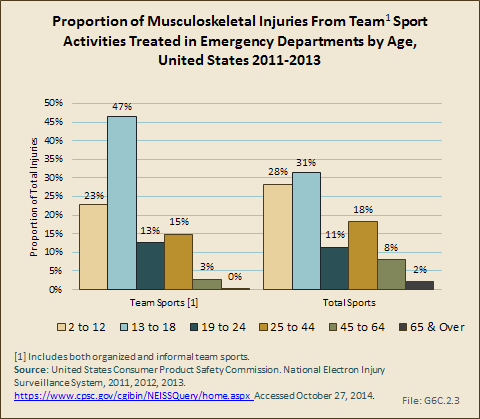
Musculoskeletal injuries seen in emergency departments occur most frequently (47%) within team sports in children between the ages of 13 and 18 years, the age at which many are participating in Little League and high school sports. Injuries from volleyball are more likely in this age group than other sports, but all team sports show about one-half of injuries seen in the ED within this age group. (Reference T6C.2 PDF CSV)
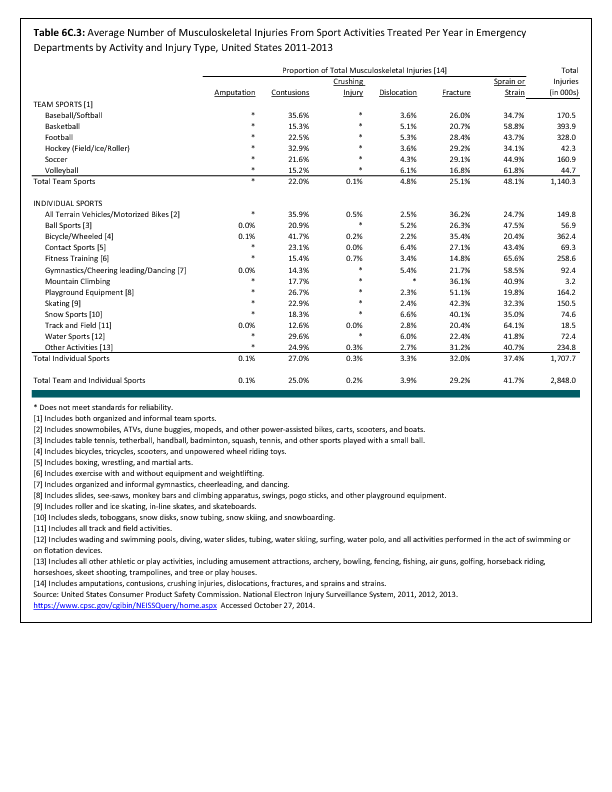
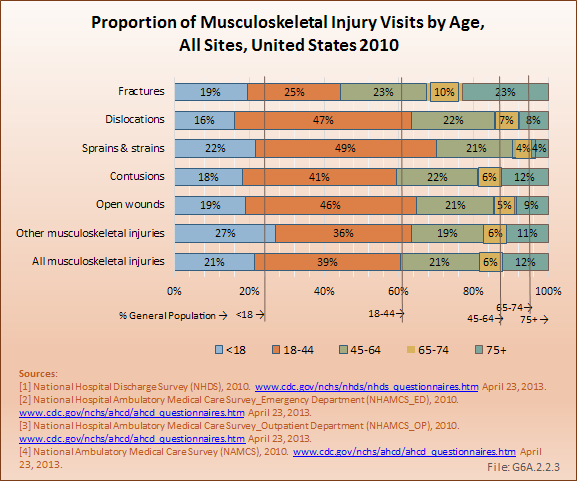
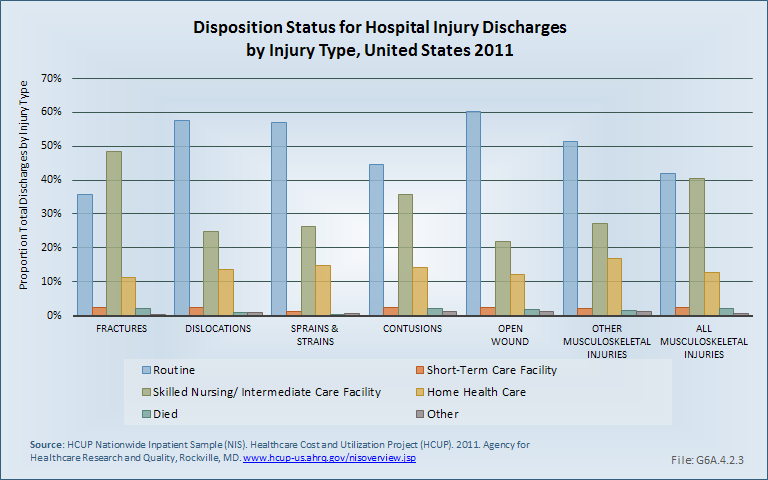
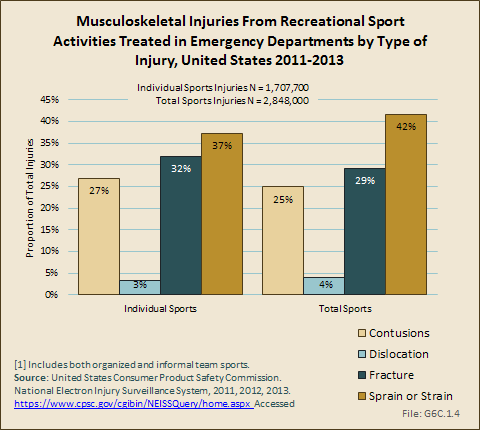
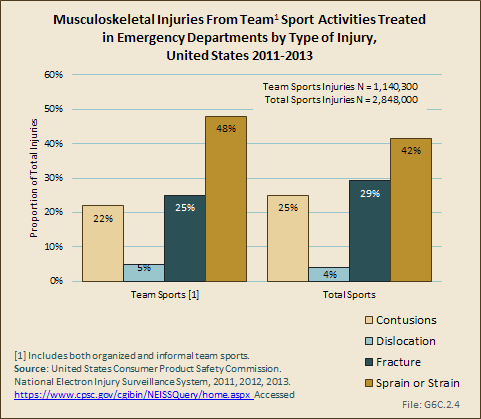
Nearly one-half (48%) of musculoskeletal injuries occurring while participating in team sports result in sprains or strains. Fractures occur in one in four injuries (25%), while contusions result in 22% of cases. (Reference Table 6C.3 PDF CSV)
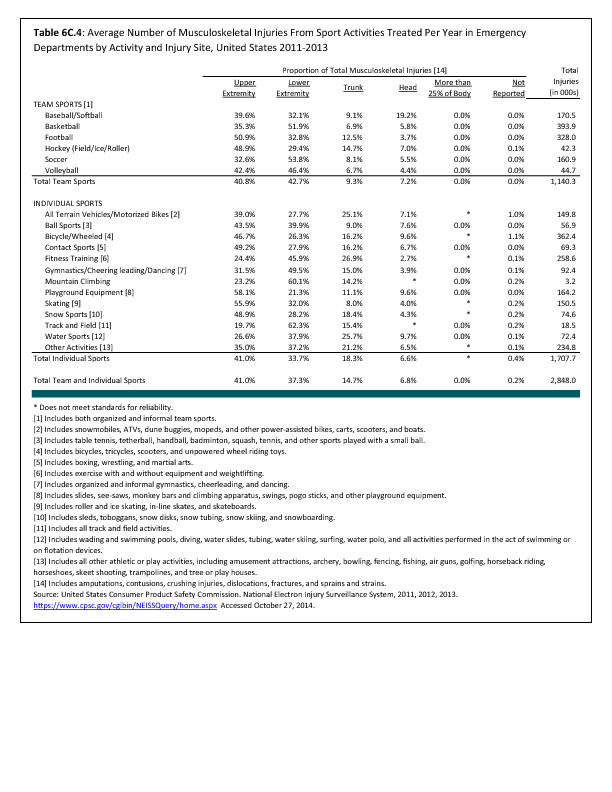
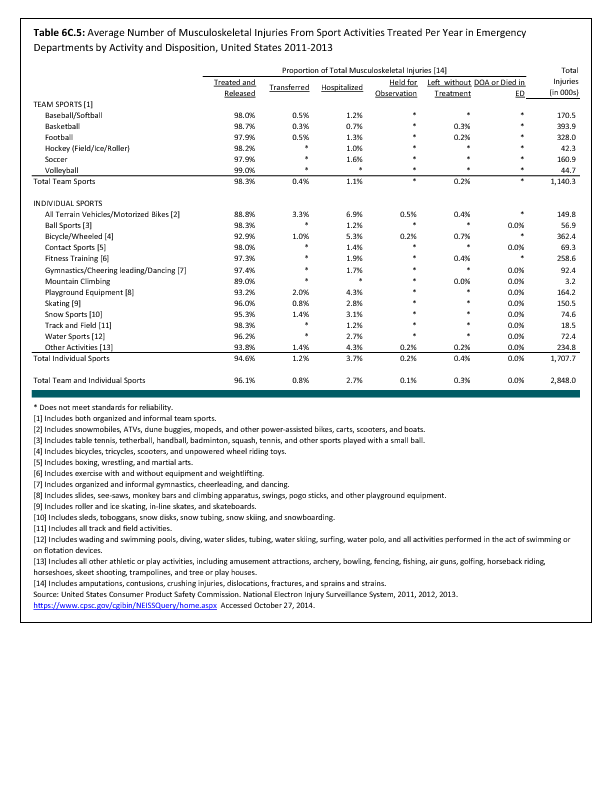
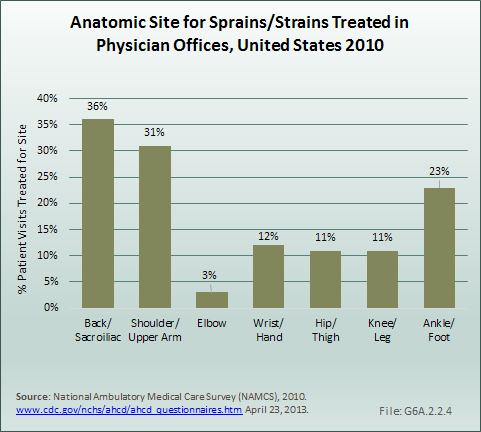
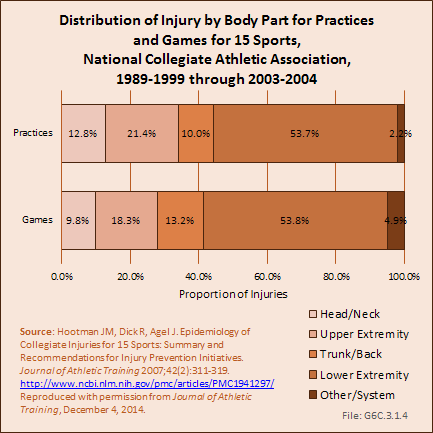
The majority of team injuries (84%) occur to the extremities. (Reference Table 6C.4 PDF CSV) Only 1% of team sport injuries results in hospitalization, with soccer injuries the most likely a cause for hospitalization (1.6%). (Reference Table 6C.5 PDF CSV)
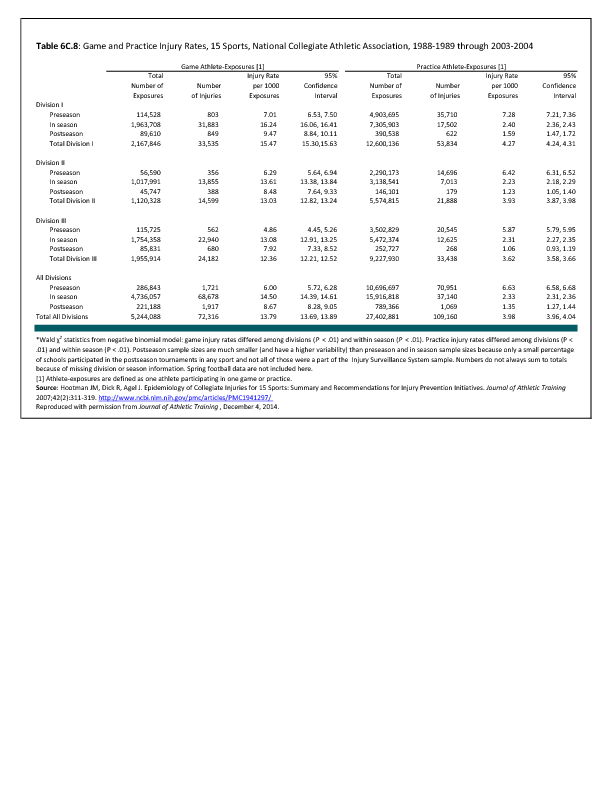
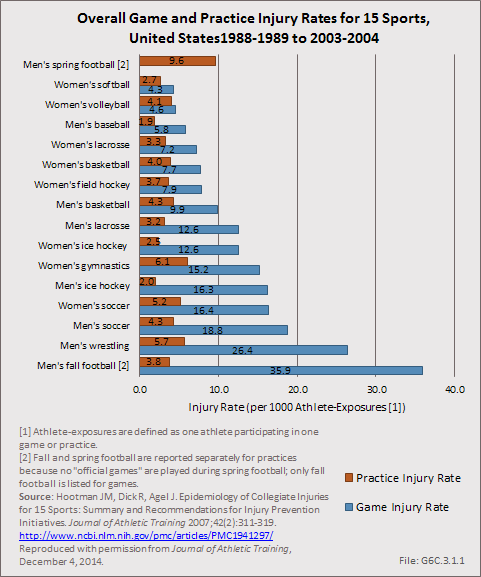
Another dataset created in 2004 to track scholastic sports injuries, the Reporting Information Online (RIOTM), also provides quality epidemiologic information entered by athletic trainers associated with participating schools. Data from the 2005–2006 academic year suggests that injuries resulting from competition were 2.7 times higher than from practice, with boys’ football having the highest injury rates, both in practice as well as games.1
While less data on long-term health impact is available on scholastic athletes, one such study by McLeod and colleagues offers insight into the significant impact of athletic injury in this large population.2 They studied a convenience sample of 160 uninjured and 45 injured scholastic athletes with health-related quality-of-life measures. They found significantly lower scores among the injured athletes for the following subscores of the Quality of Life Short Form Questionnaire (SF-36)3: physical functioning, limitations due to health problems, bodily pain, social functioning, and the physical composite score. These findings suggest that physical injuries in our young athletes affect not only their physical function and risk for future musculoskeletal disability, but also extend beyond the physical aspects of overall health.
- 1. Rechel JA, Yard EE, Comstock RD: An epidemiologic comparison of high school sports injuries sustained in practice and competition. J Athl Train 2008 Apr-Jun;43(2):197-204.
- 2. Valovich McLeod TC, Ba y RC, Parsons JT, Sauers EL, Snyder AR: Recent injury and health-related quality of life in adolescent athletes. J Athl Train 2009 Nov-Dec;44(6):603-610.
- 3. The SF-36 is a widely used measurement in health to determine quality of life based on eight scales: physical functioning, role-physical, bodily pain, general health, vitality, social functioning, role-emotional, and mental health. Two summary measurements, physical health and mental health, are also calculated.
Edition:
- 2014


 Download as CSV