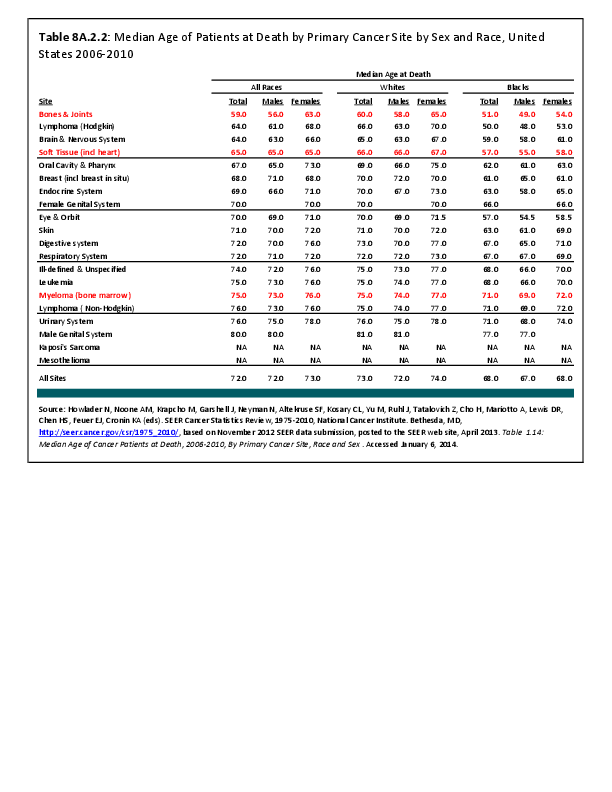
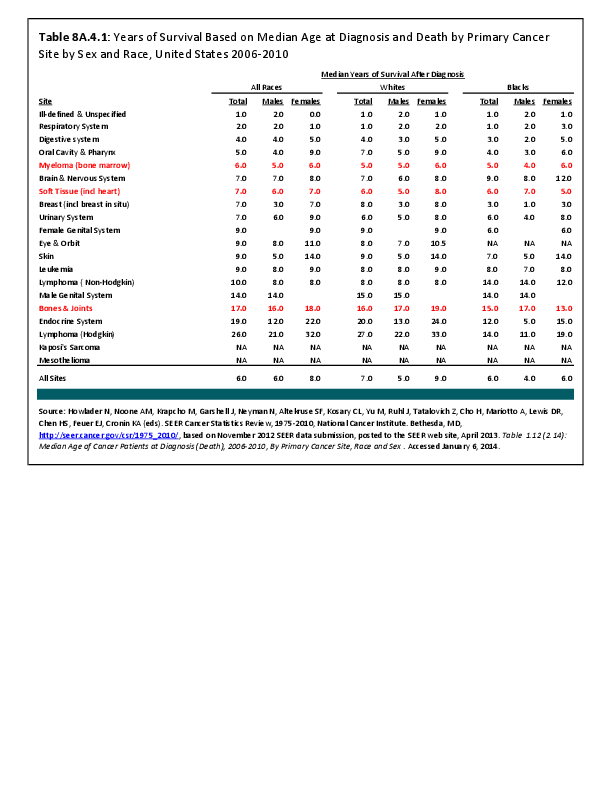
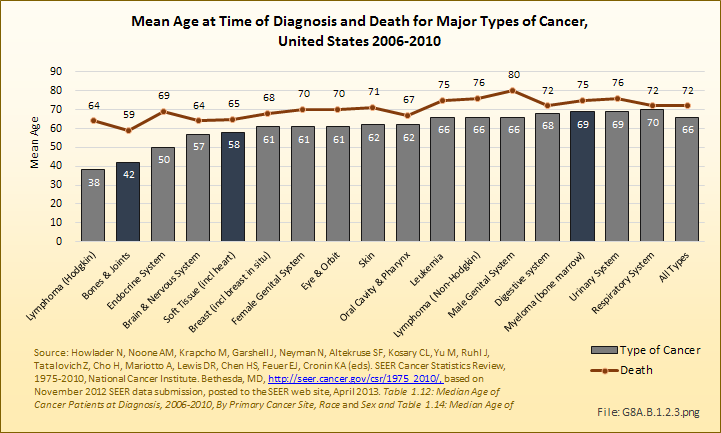
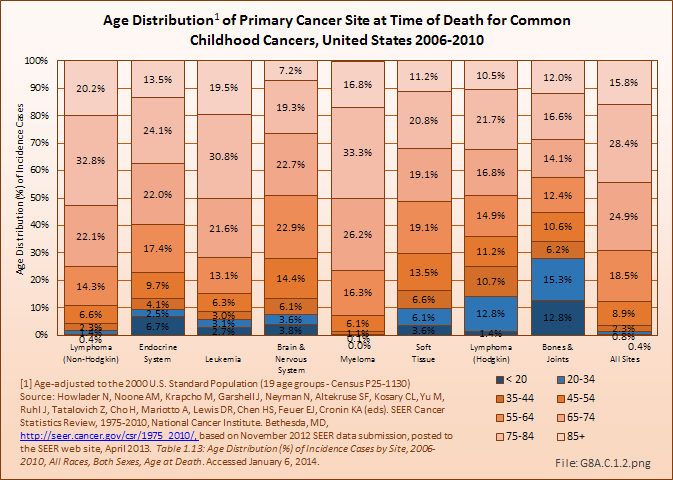
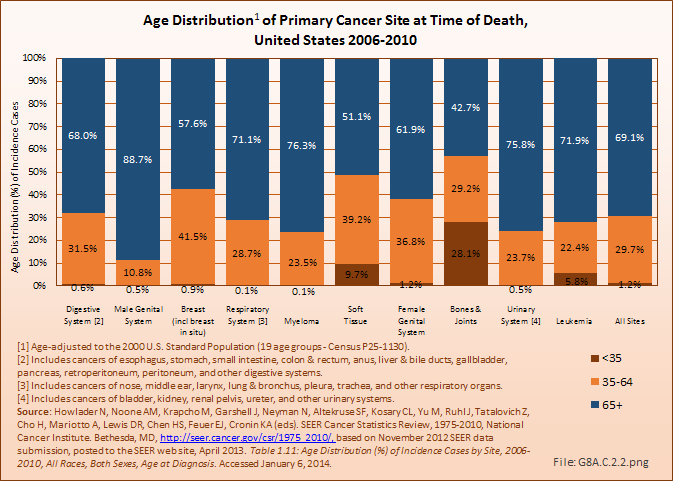
Death from bone and joint cancer, at a median age of 59 years, occurs at a younger age than any other type of cancer. (Reference Table 8A.2.2 PDF CSV)
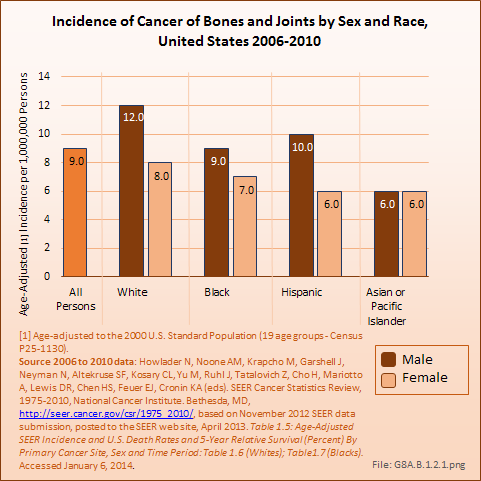
Annual population-based mortality rates due to cancers of bones and joints are low, averaging four deaths per one million people since the early 1990s.1 While the mortality rate from bone and joint cancer dropped by approximately 50% from that of the late 1970s, no significant improvement in this rate has been observed over the past 20 years.2 Males have a higher mortality rate than females for all races. (Reference Table 8A.4.3 PDF CSV)

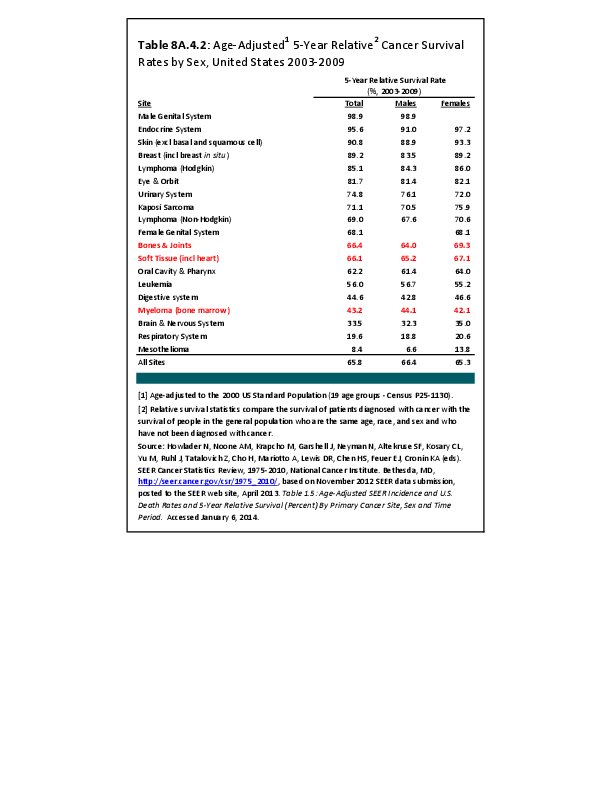
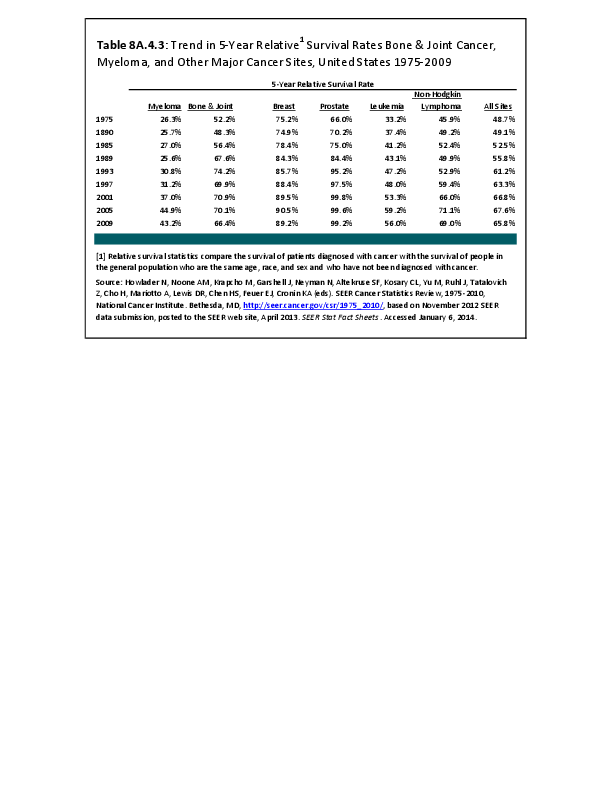
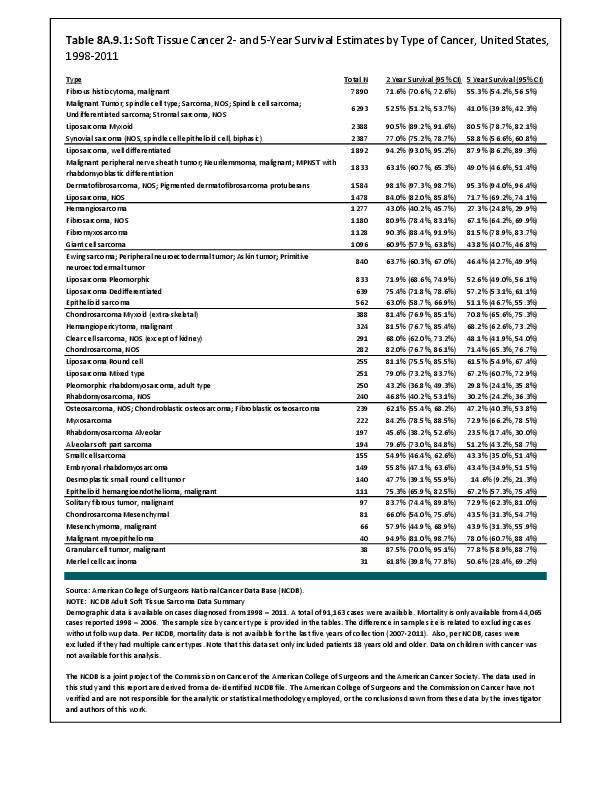
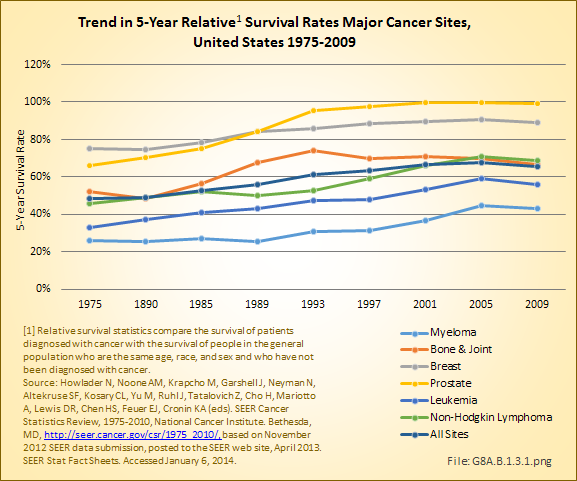
The overall 5-year survival rate in 2006–2010 for bone and joint cancers was 66%, placing it roughly in the middle of all cancers for 5-year survival and comparable to a number of more common cancers such as non-Hodgkin lymphoma, urinary, cervical/ovarian, and soft tissue cancers. This is an increase of 14% since 1975, when the 5-year survival rate was 52%. The median number of years of survival after diagnosis is 17, with males averaging 16 years and females 18 years.
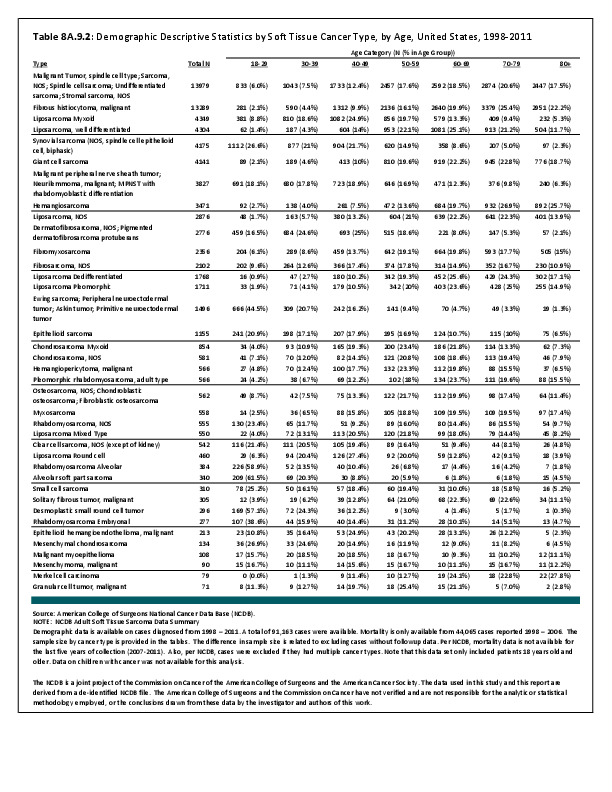
The overall 5-year survival rate for the primary types of bone and joint cancers is 54% for osteosarcoma, 75% for chondrosarcoma, and 51% for Ewing sarcoma. The osteosarcoma survival rate varies with age: The 5-year survival was 70% for children and youth under the age of 20 years,3 60% for people under 30 years of age, 50% for those aged 30 years to 49 years, and 30% for those 50 years old and older.2 If Ewing sarcoma is found before it metastasizes, the 5-year survival rate for children and youth is about 70%. However, if already metastasized when found, the 5-year survival rate drops to 15% to 30%.4 (Reference Table 8A.4.1 PDF CSV, Table 8A.4.2 PDF CSV, and Table 8A.4.3 PDF CSV)
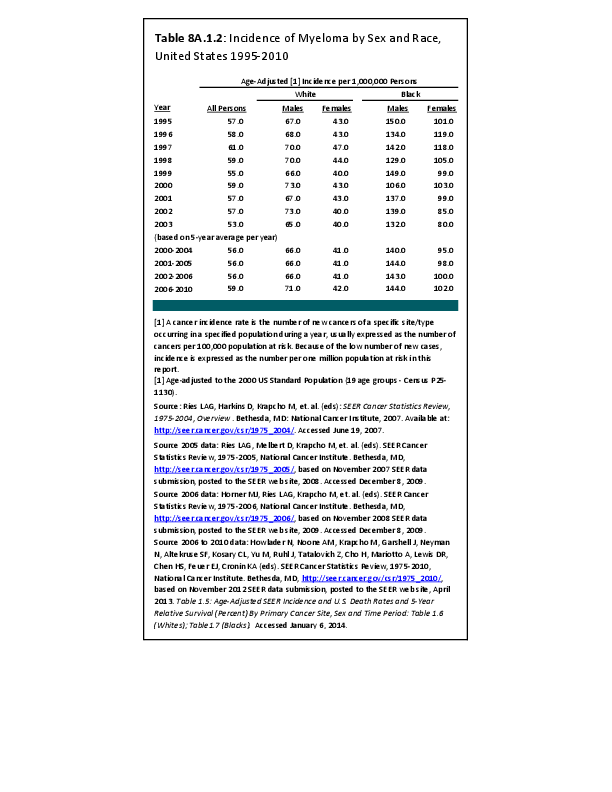
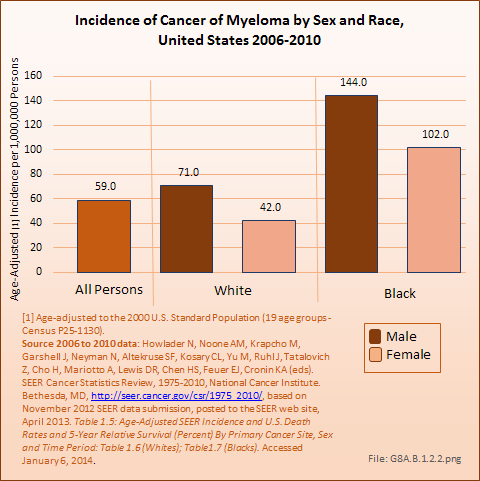
The annual population-based mortality rate of myeloma was an average of 34 persons per one million population between 2006 and 2010.5 The mortality rate from myeloma has remained relatively constant since the mid-1970s. The 5-year survival rate for myeloma, 43%, is one of the lowest for all cancers; however, due to being primarily a cancer of older persons, this age-relatedness may well affect survival regardless of the presence or absence of myeloma. The median survival after diagnosis of myeloma is only 6 years. (Reference Table 8A.4.1 PDF CSV, Table 8A.4.2 PDF CSV, and Table 8A.4.3 PDF CSV)
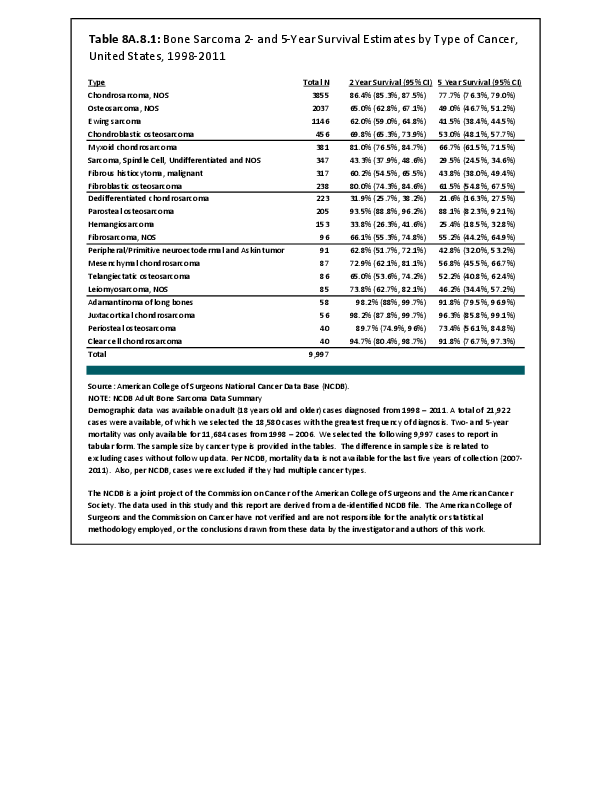
Within the NCDB, no change in the overall survival rates for patients diagnosed and treated in the years 1985 to 1988 compared to patients between 1994 and 1998 was found. There have been no substantial changes in therapies utilized for osteosarcoma since 1998 and the overall 1998–2010 NCDB data reveals no significant improvement, with an approximate 50% five-year overall survival. However, the survival rate varies greatly with the histologic subtype of sarcoma. For instance, the 5-year relative survival rate is 53% for classic high-grade osteosarcoma, 87% for parosteal osteosarcoma and 18% for osteosarcoma associated with Paget's disease of the bone. (Reference Table 8A.8.1 PDF CSV)
- 1. National Cancer Institute, Surveillance, Epidemiology, and End Results Program: SEER Stat Fact Sheets: Bone and Joint Cancer. Available at: http://seer.cancer.gov/statfacts/html/bones.html. Accessed February 10, 2015.
- 2. a. b. Damron TA, Ward WG, Stewart A: Osteosarcoma, chondrosarcoma, and Ewing sarcoma: National Cancer Center Data Base Report. Clin Orthop Relat Res 2007;459:40-47.
- 3. Cancer.net: Osteosarcoma–Childhood: Statistics. Available at: http://www.cancer.net/cancer-types/osteosarcoma-childhood/statistics. Accessed February 10, 2015.
- 4. Cancer.net: Ewing Sarcoma-Childhood: Statistics. Available at: http://www.cancer.net/cancer-types/ewing-sarcoma-childhood/statistics Accessed February 10, 2015.
- 5. National Cancer Institute, Surveillance, Epidemiology, and End Results Program: SEER Stat Fact Sheets: Myeloma. Available at: http://seer.cancer.gov/statfacts/more.html. Accessed March 4, 2014.
Edition:
- 2014
 Download as CSV