Economic burden in The Burden of Musculoskeletal Diseases (BMUS) is based on data from the AHRQ Medical Expenditure Panel Survey (MEPS). The MEPS, which began in 1996, is a set of large-scale surveys of families and individuals, their medical providers (doctors, hospitals, pharmacies, etc.), and employers across the United States. MEPS collects data on the specific health services that Americans use, how frequently they use them, the cost of these services, and how they are paid for, as well as data on the cost, scope, and breadth of health insurance held by and available to US workers. Data reported in BMUS is based on three-year averages for each sequence of years.
Between the years 1996 to 1998 and 2012 to 2014, the number of persons in the population reporting a spine condition rose from 27.4 million to 34.9 million, but the proportion of total population with a spine condition (10.1% vs 11.0%) increased only slightly over the nearly two decades. However, distribution of the population with a spine condition, by age group, showed a consistent shift upward as the population ages, reflecting the overall aging of the US population. (Reference Table 8.12 PDF CSV)

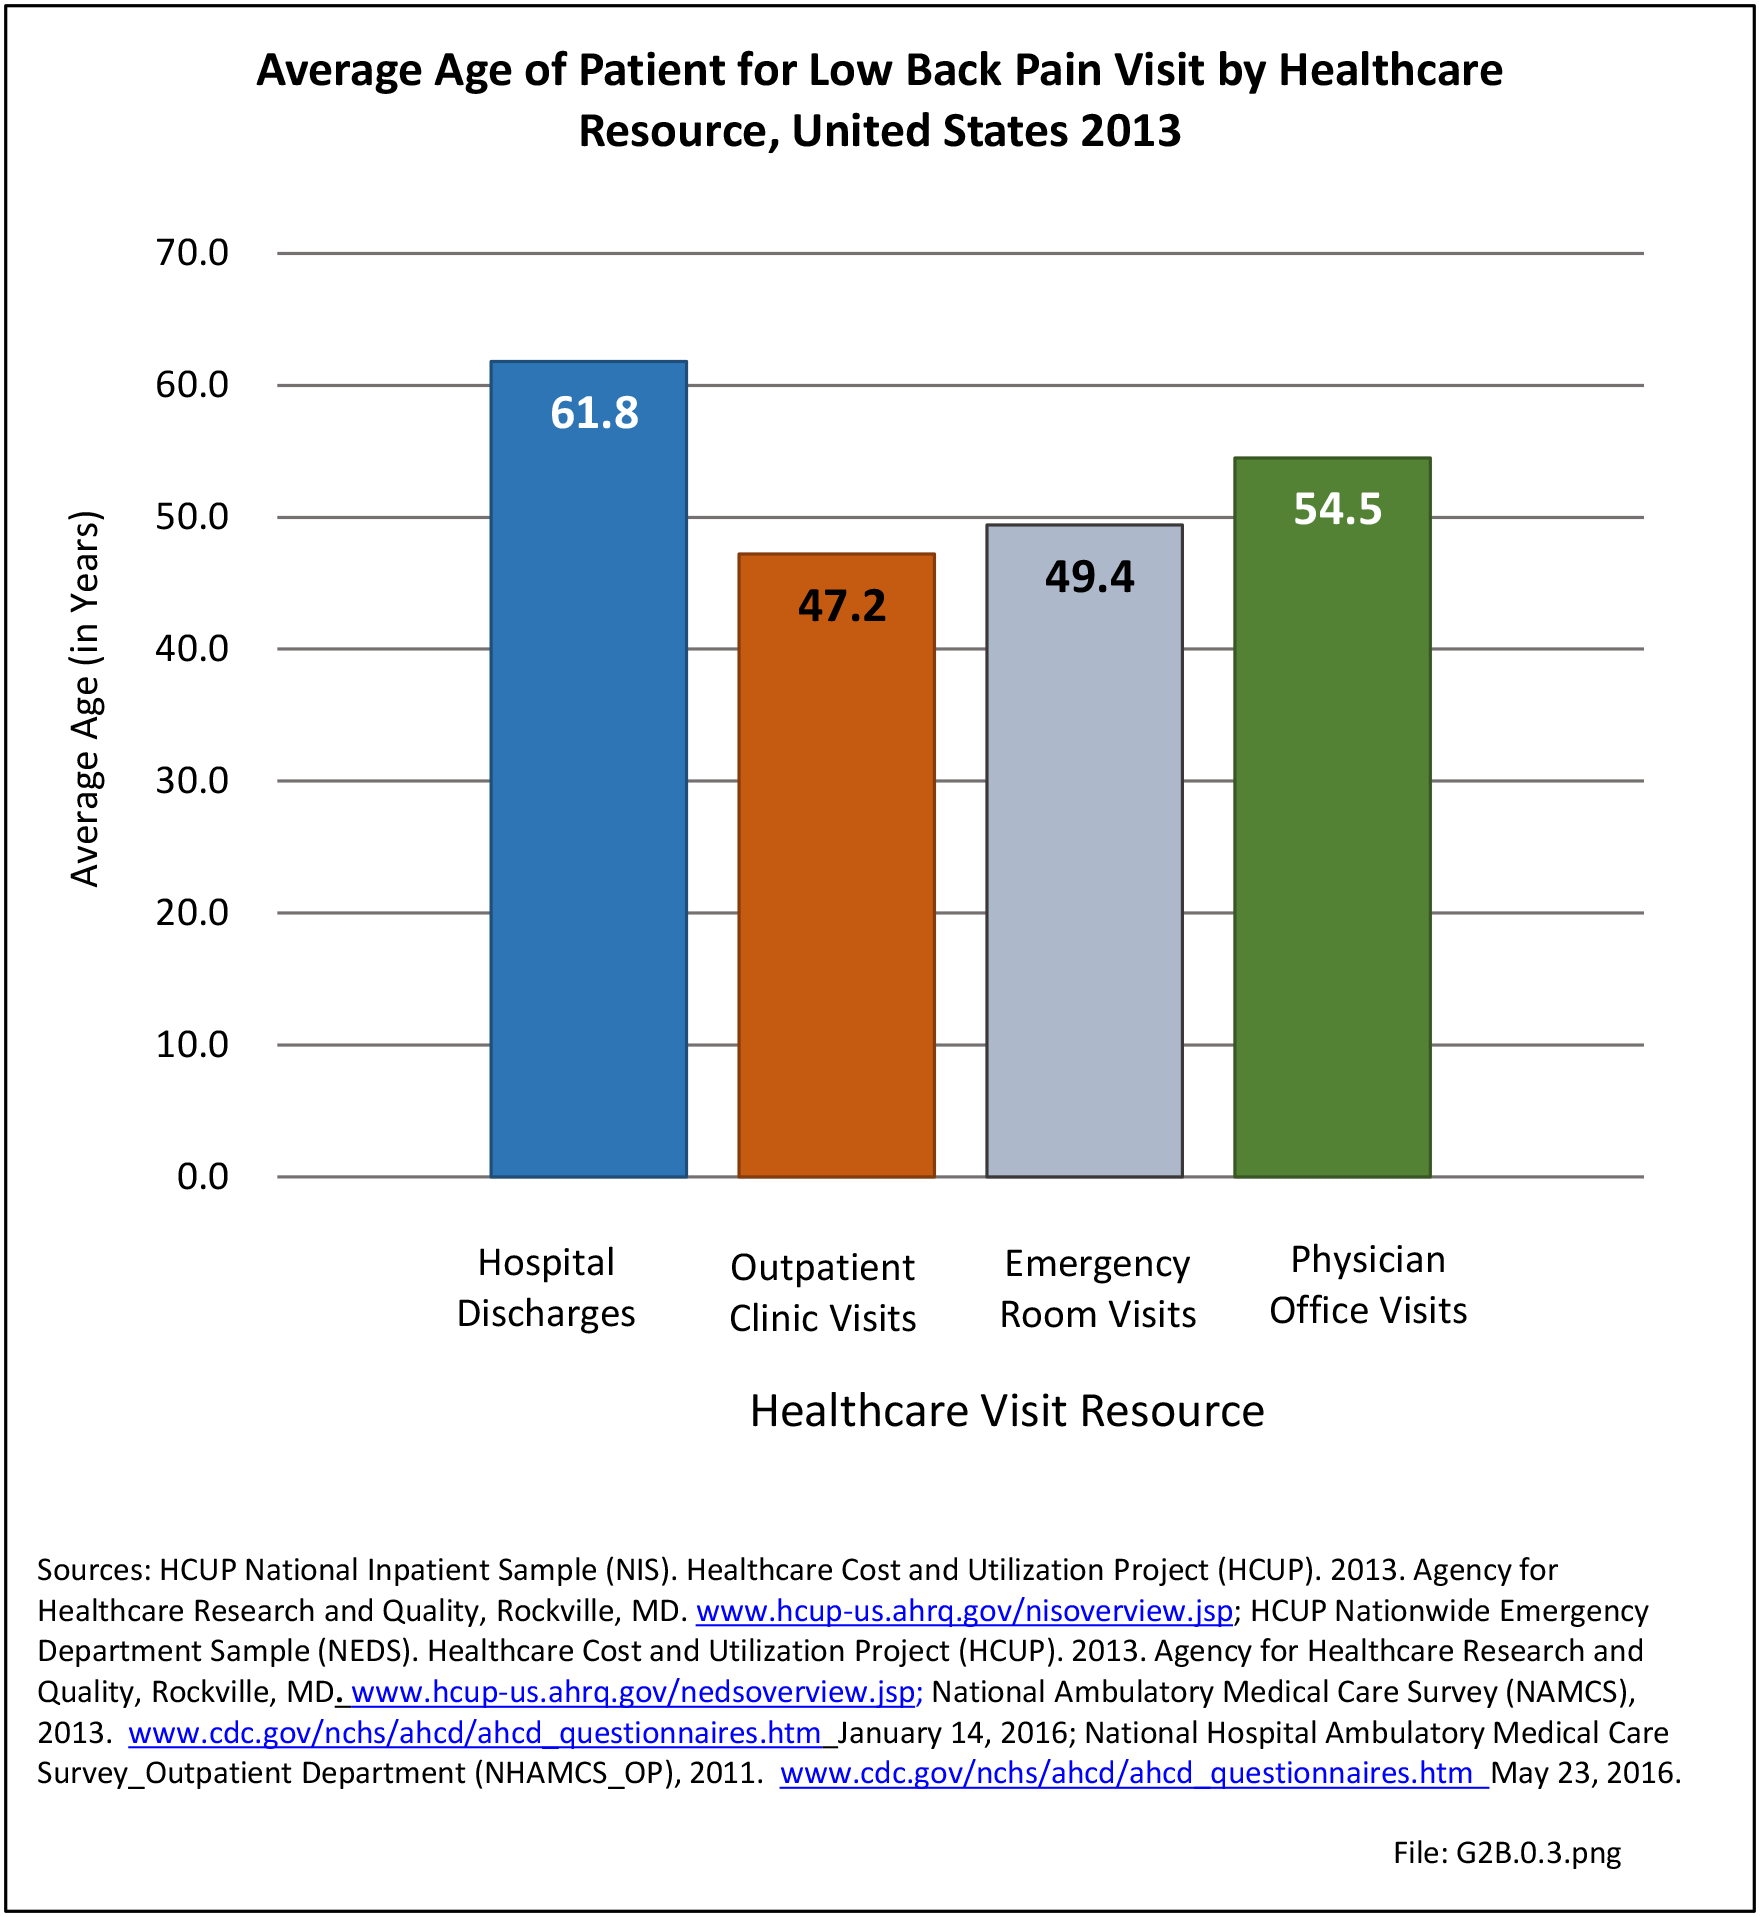
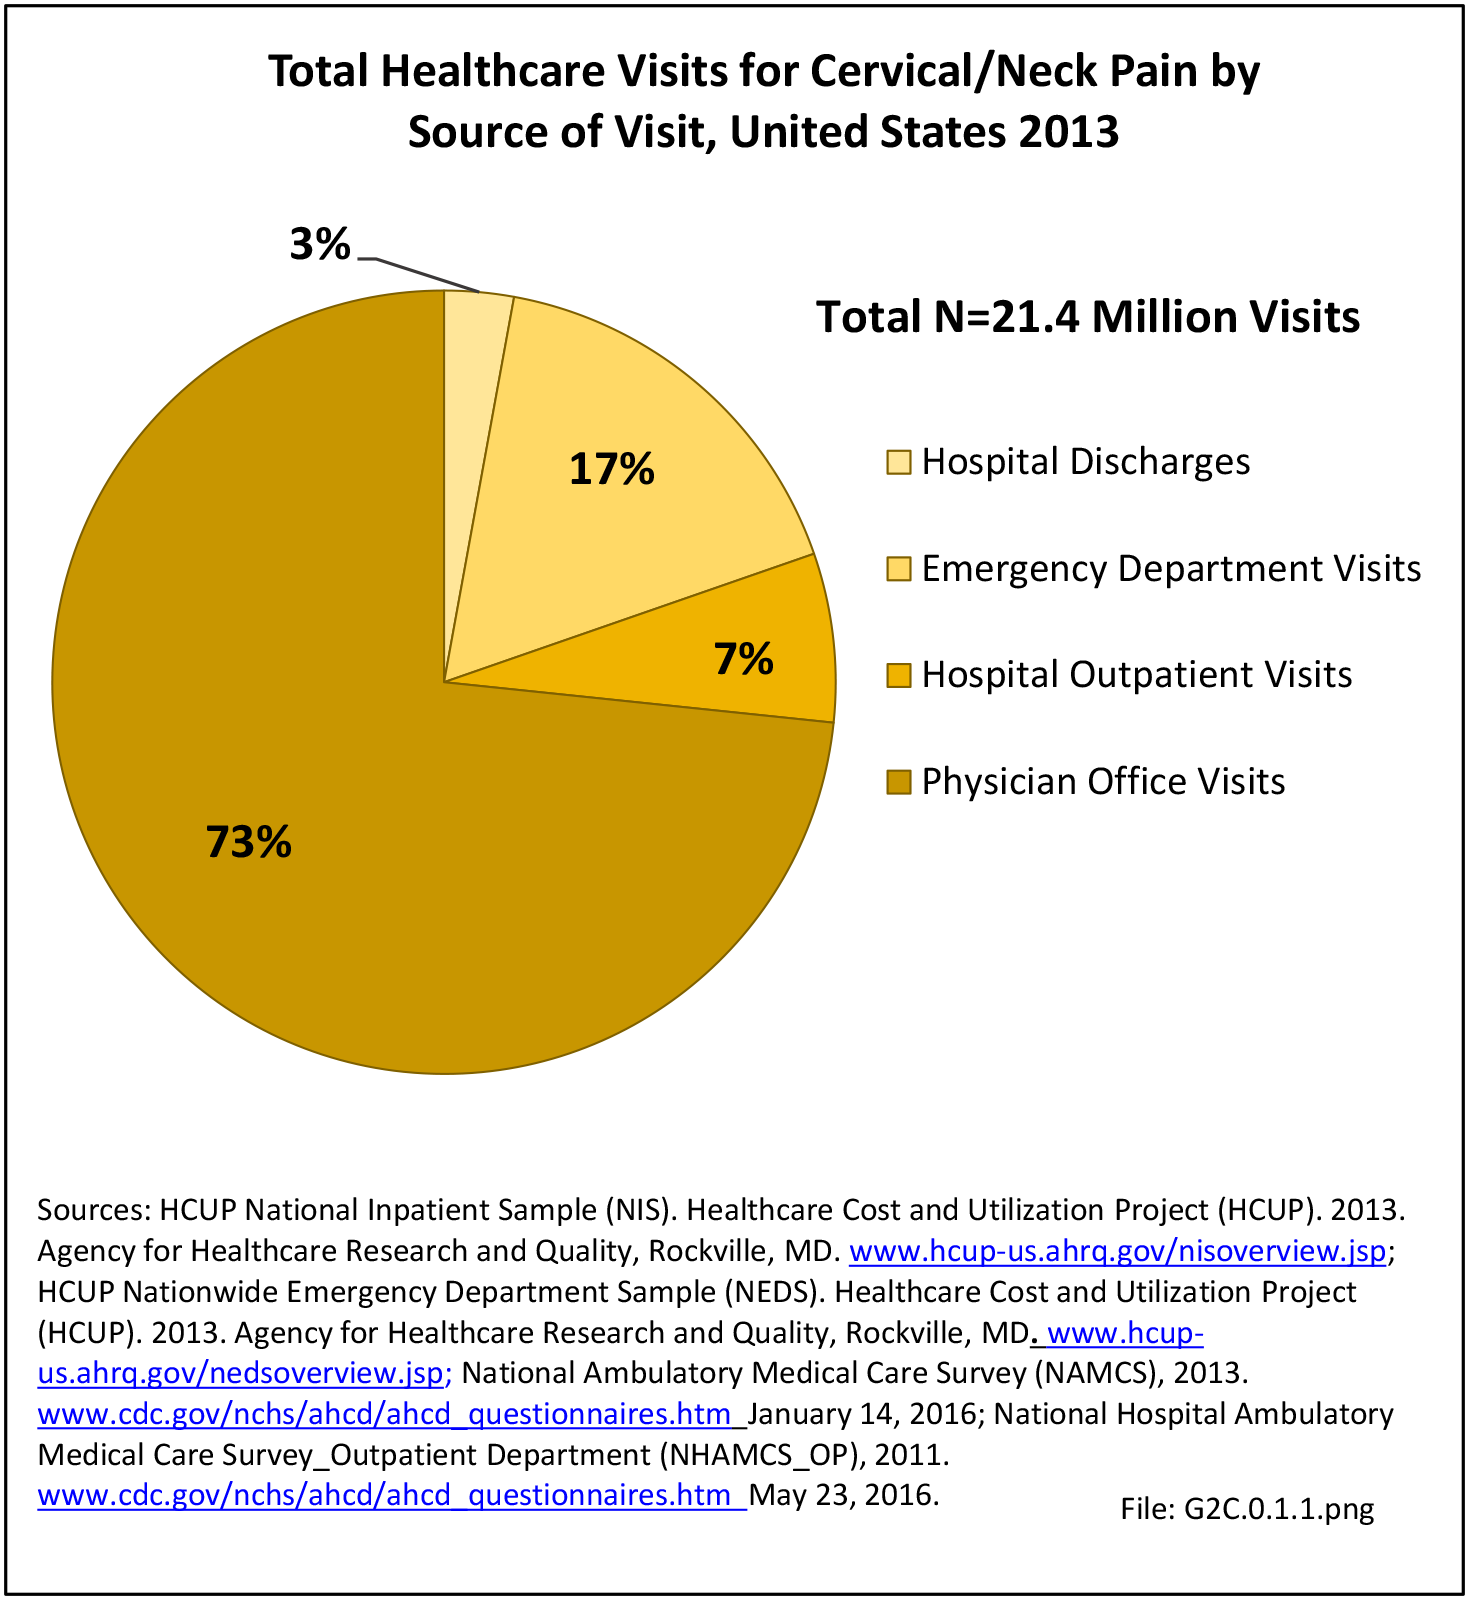
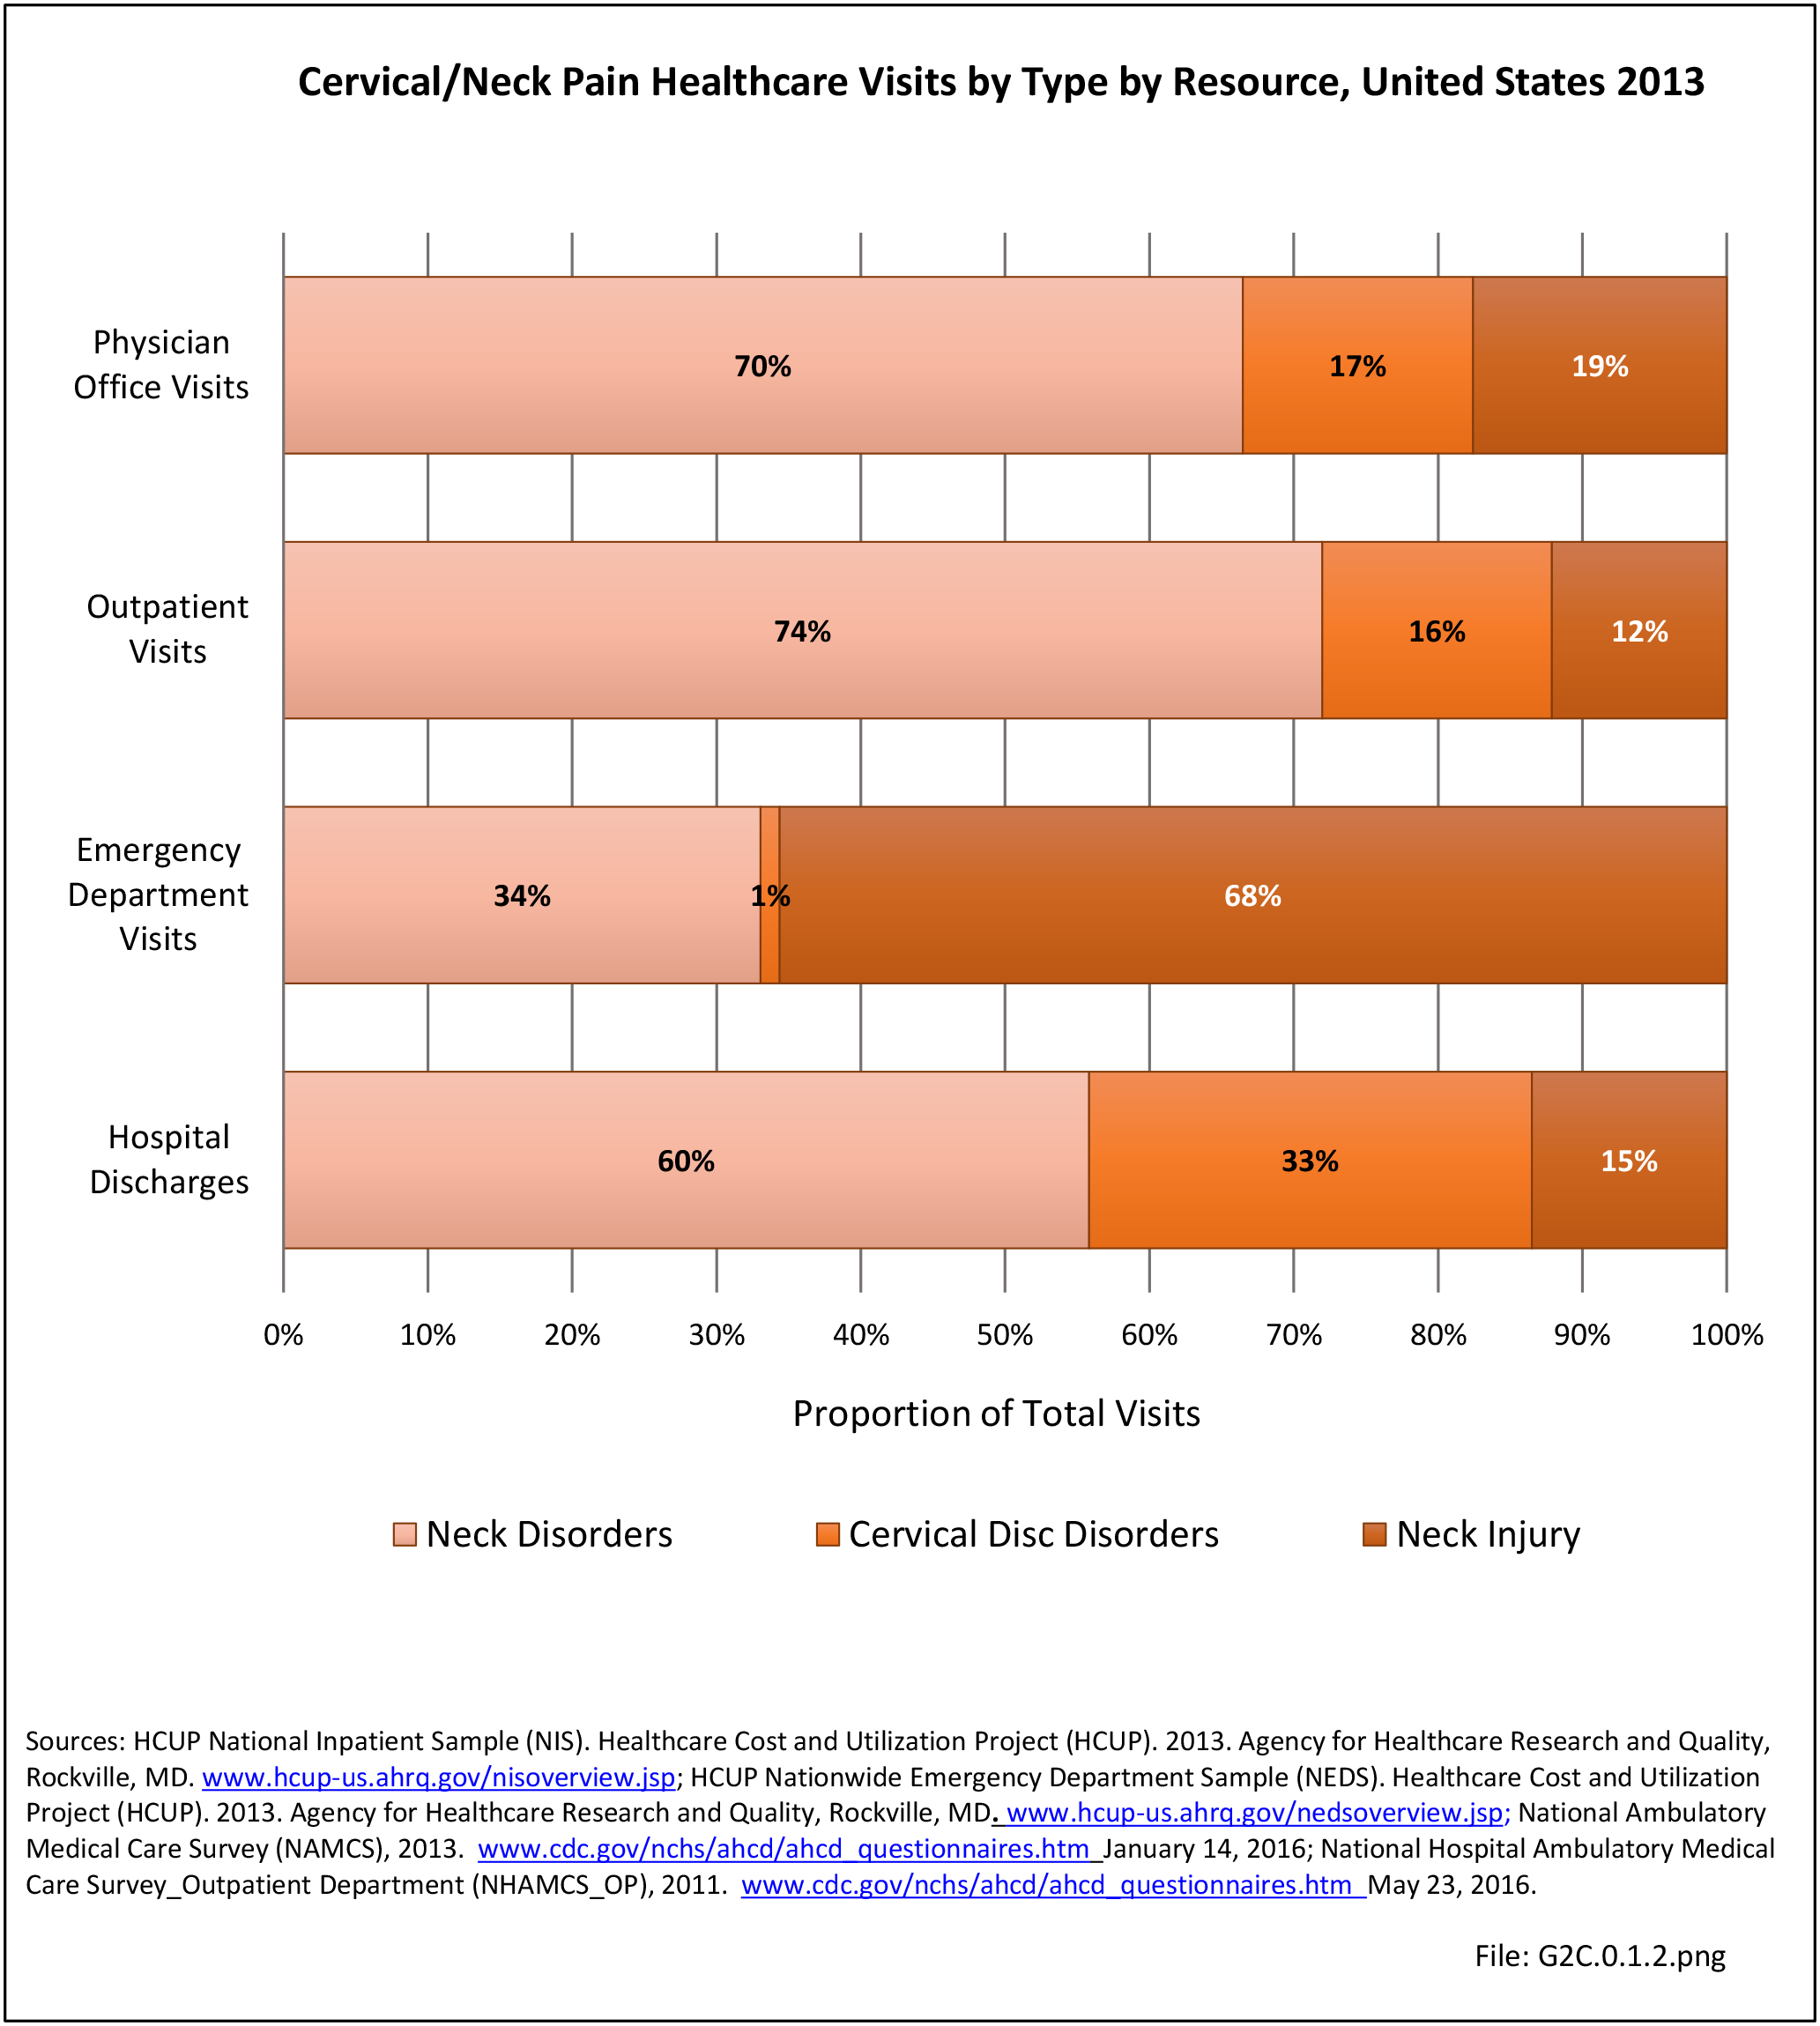
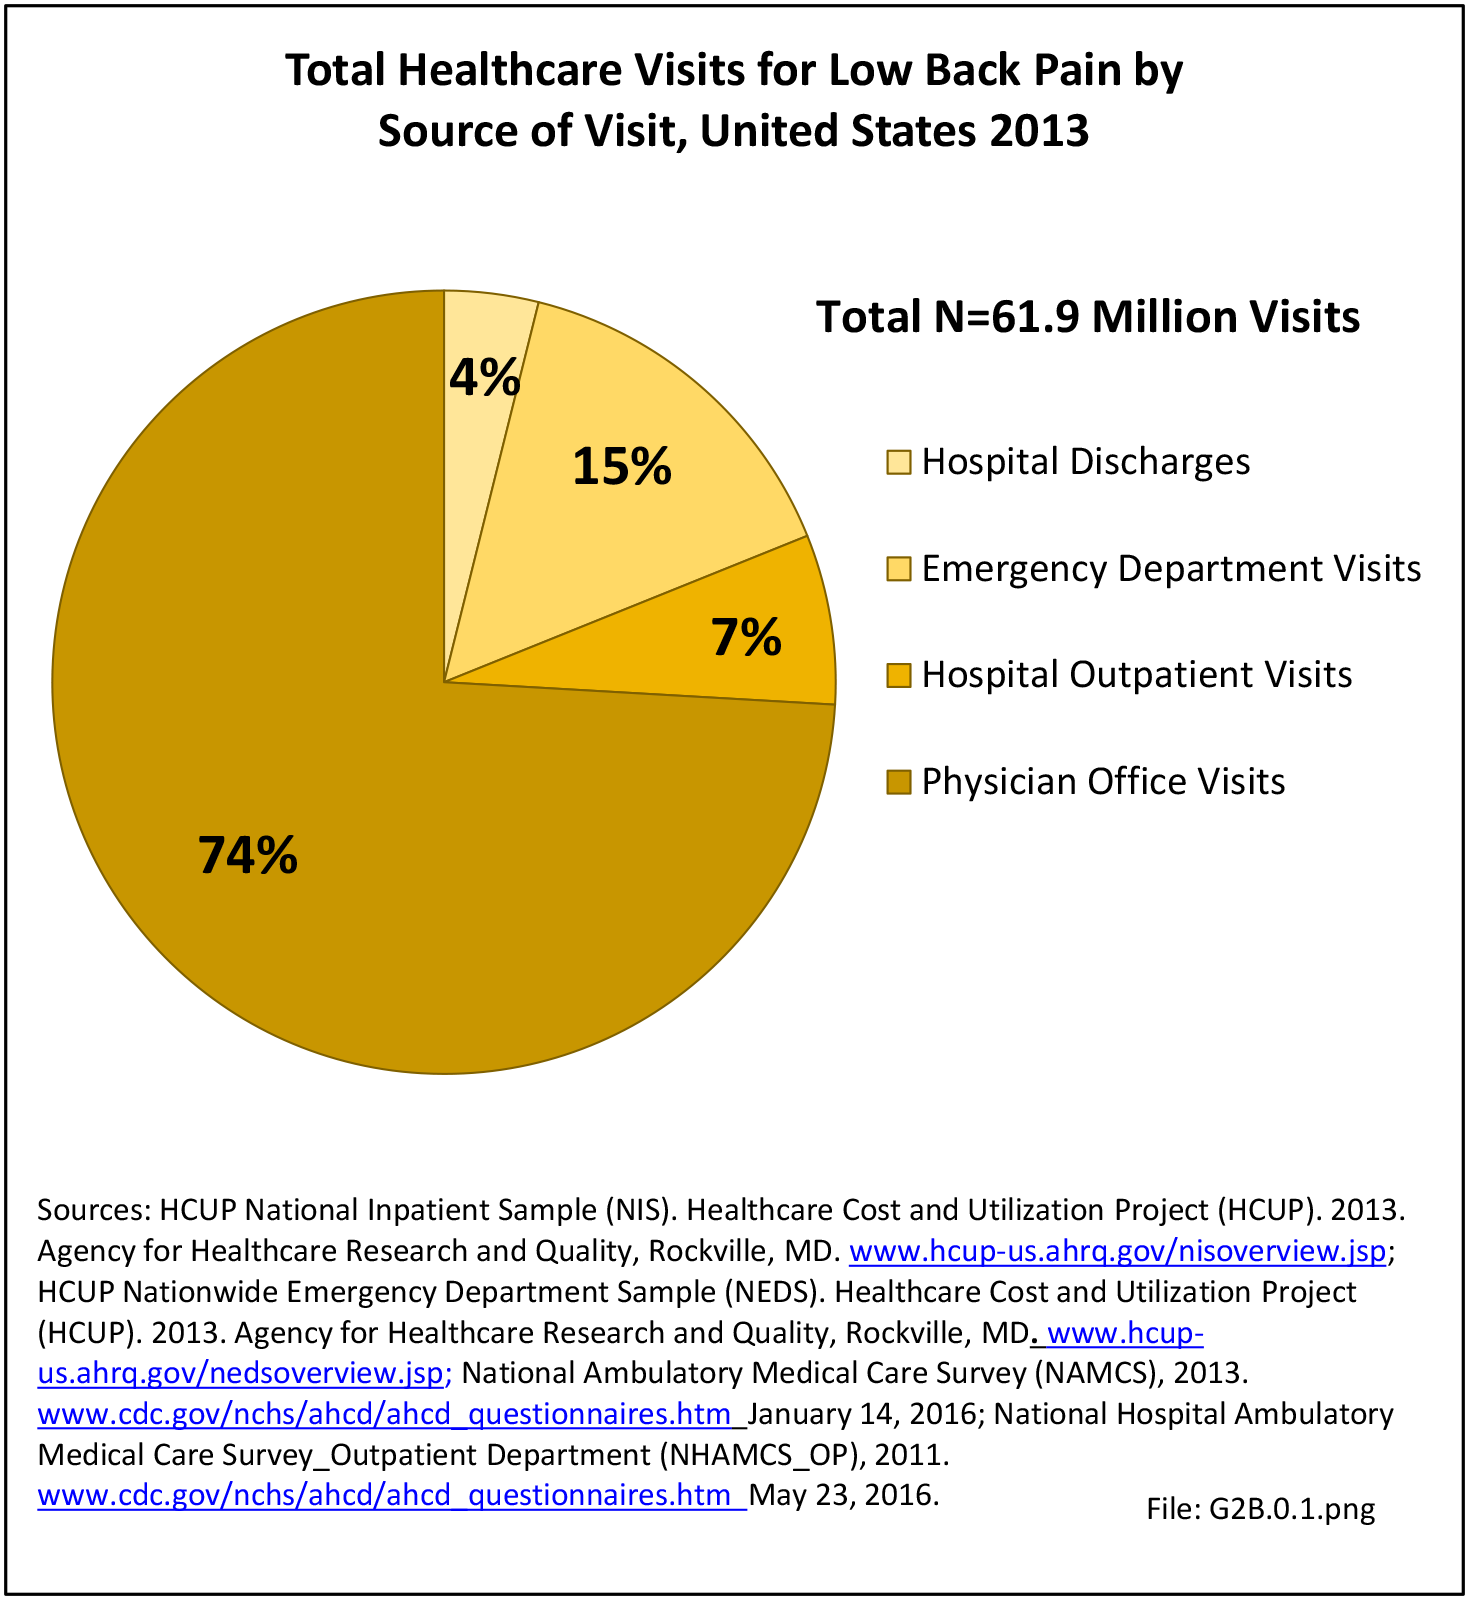
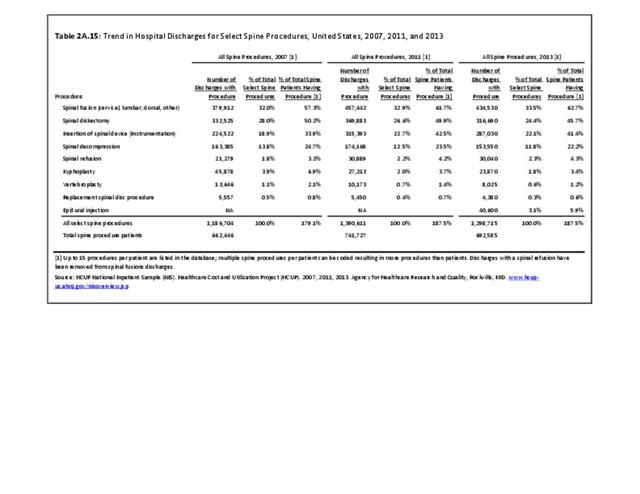
Healthcare treatments and visits contribute to the burden of spine conditions. Ambulatory physician visits, home health care visits, and hospital discharges all rose by 34%, 46%, and 28%, respectively, between the years 1996 to 1998 and 2012 to 2014. Mean visits for these three healthcare providers and share of spine patients using them remained relatively steady, indicating the primary reason for the increase is population growth. While still accounting for a relatively small number of visits, ambulatory non-physician care visits rose from 101 million in the earlier time frame to 220 million in the most recent years, an increase of 117%, due to both an increase of spine patients using this resource and a jump in mean visits.
However, prescription medications for spine conditions show the most dramatic rise, jumping from 353 million prescription fills to 789 million between the time frames, an average increase per year of 7.3% with a total increase of 123%. This increase was due primarily to the increase in mean number of refills per person, from 12.0 to 22.6, rather than the share of persons with a spine condition obtaining prescriptions, an increased share of only 3.5%. (Reference Table 8.2.2 PDF CSV)

Direct Medical Costs
Overall, ambulatory care visits (physician office visits, non-physician visits, and home health care visits) accounted for the largest share of per person direct cost for persons with a spine condition. At an average cost of $3,220 per person between 2012 and 2014, an increase of 82% from 1996 to 1998 in 2014 dollars, ambulatory care accounted for 36% of per person direct cost between 2012 and 2014. While the share of mean per person cost for inpatient care dropped from 36% to 25% between 1996 and 1998 and 2012 and 2014, the mean cost rose from $1,823 to $2,258 in 2014 dollars, an increase of 24%. At the same time, the average per person cost for prescriptions rose from $675 to $2,263, in 2014 dollars, an increase of 235%. (Reference Table 8.4.2 PDF CSV)

Total direct per person healthcare costs for persons with a spine condition were $9,035, an increase of 80% since 1996 to 1998 based on 2014 dollars. Incremental direct per person costs, those costs most likely attributable to a spine condition, rose from $970 to $1,615, in 2014 dollars, an increase of 66%. (Reference Table 8.6.2 PDF CSV)

Total aggregate direct costs for all persons with a spine condition were $315.4 billion in 2012 to 2014, a rise of 129% from the $13 billion in 1996 to 1998, in 2014 dollars. Incremental aggregate direct costs increased from $26.6 billion in 1996 to 1998 to $56.4 billion in 2012 to 2014, an increase of 112%. (Reference Table 8.6.2 PDF CSV)

Indirect Costs (Society/Employers)
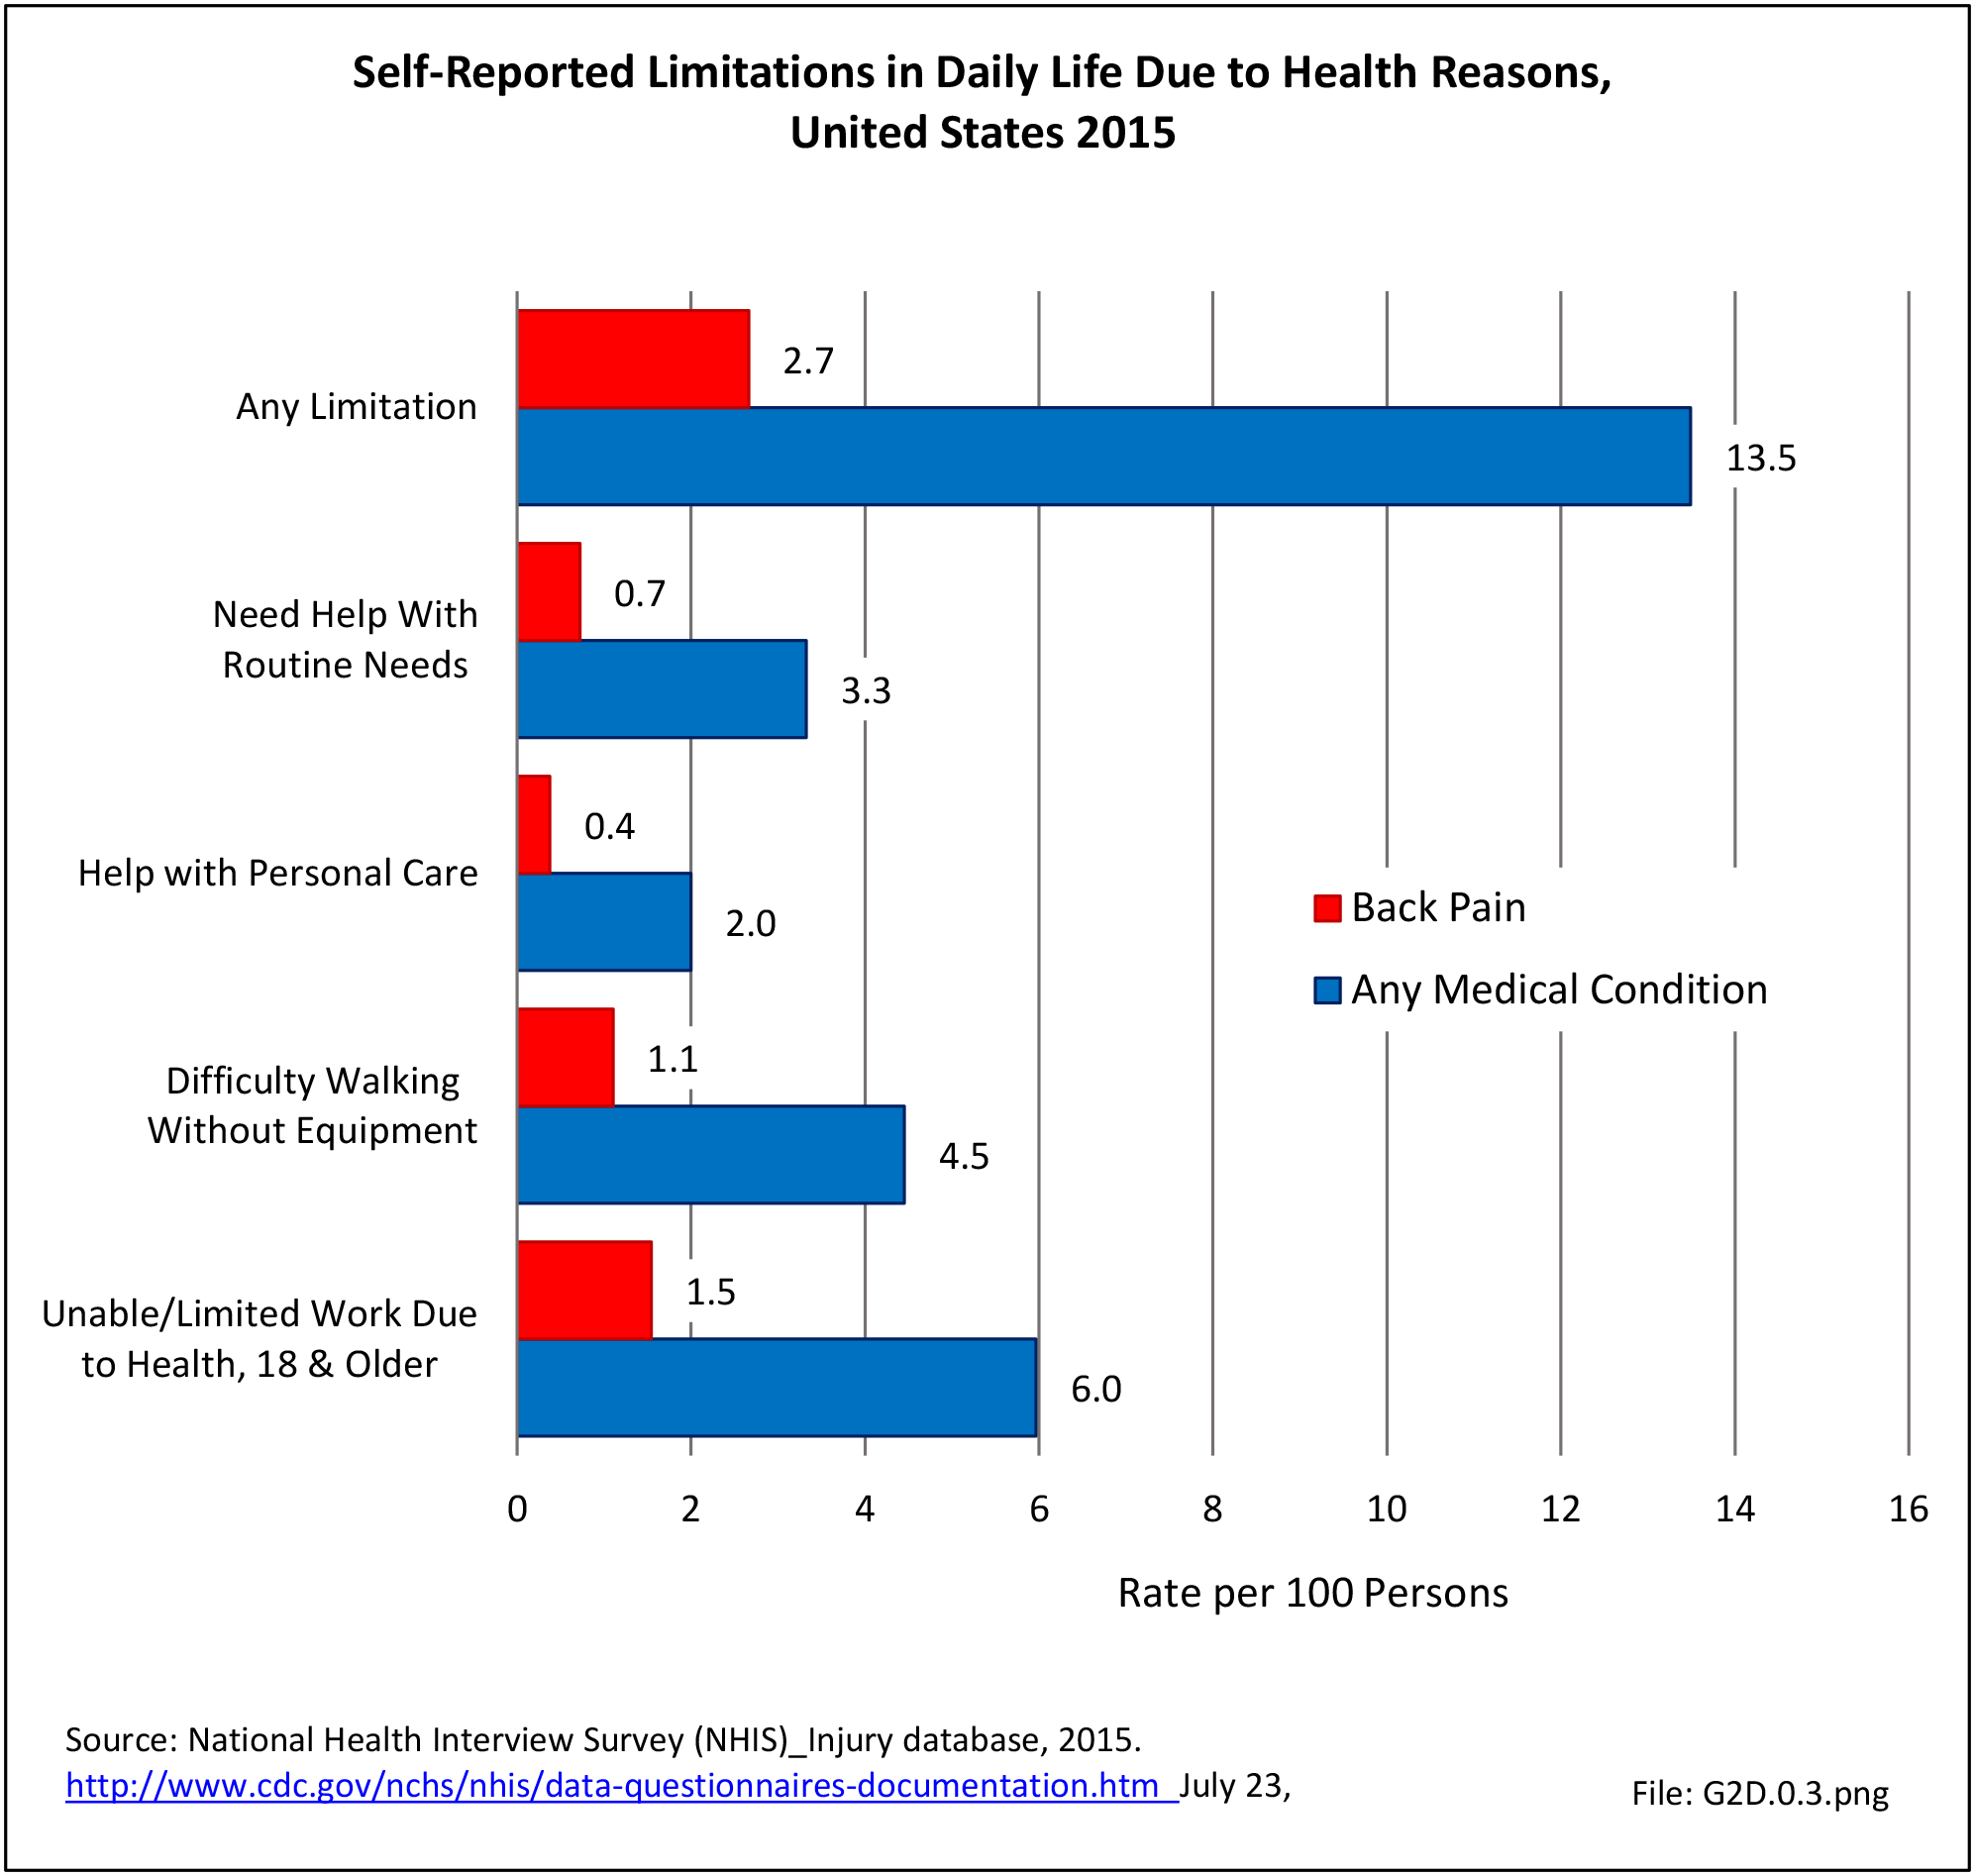
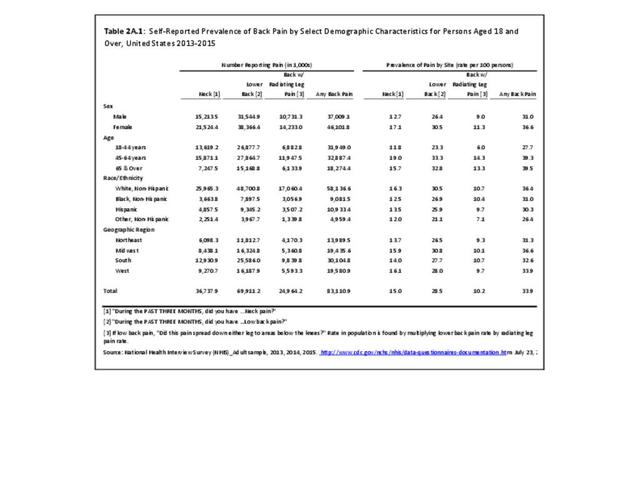
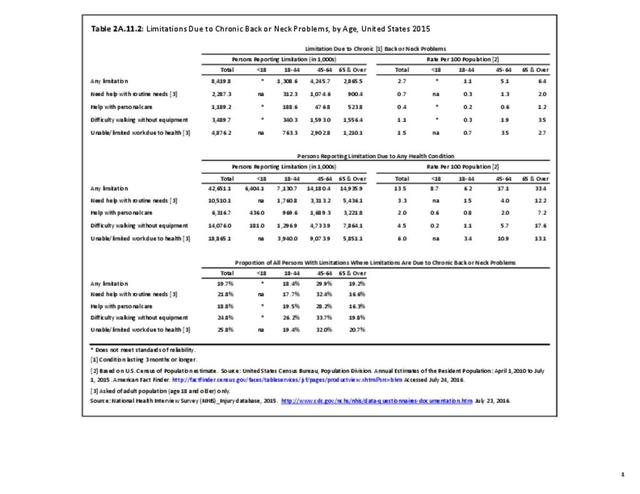
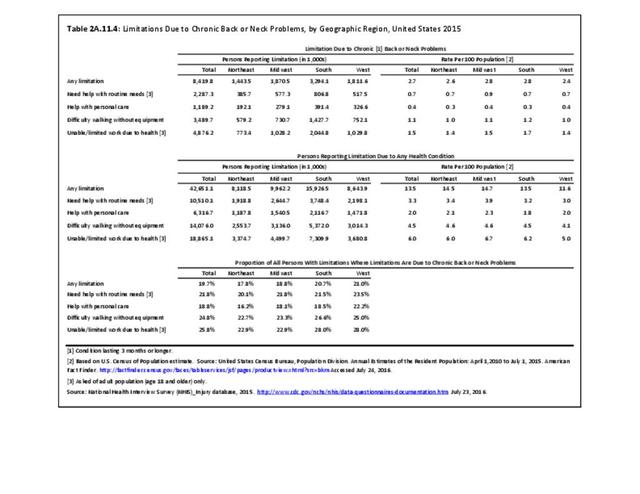
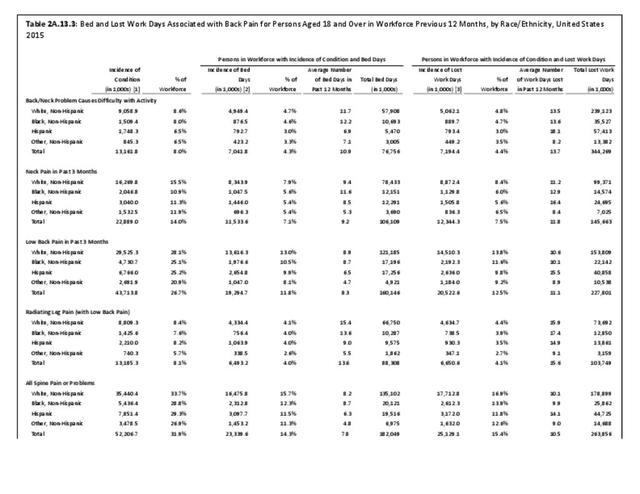
Indirect costs associated with lost wages for persons ages 18 to 64 years are not calculated for persons with a spine condition. However, back pain is often cited as the reason for bed days and lost work days by persons in the labor force. In 2015, 4.9 million persons in the prime working ages of 18 to 64 years reported they are unable or limited in work at the time due to chronic back or neck problems. (Reference Table 2A.11.2 PDF CSV)
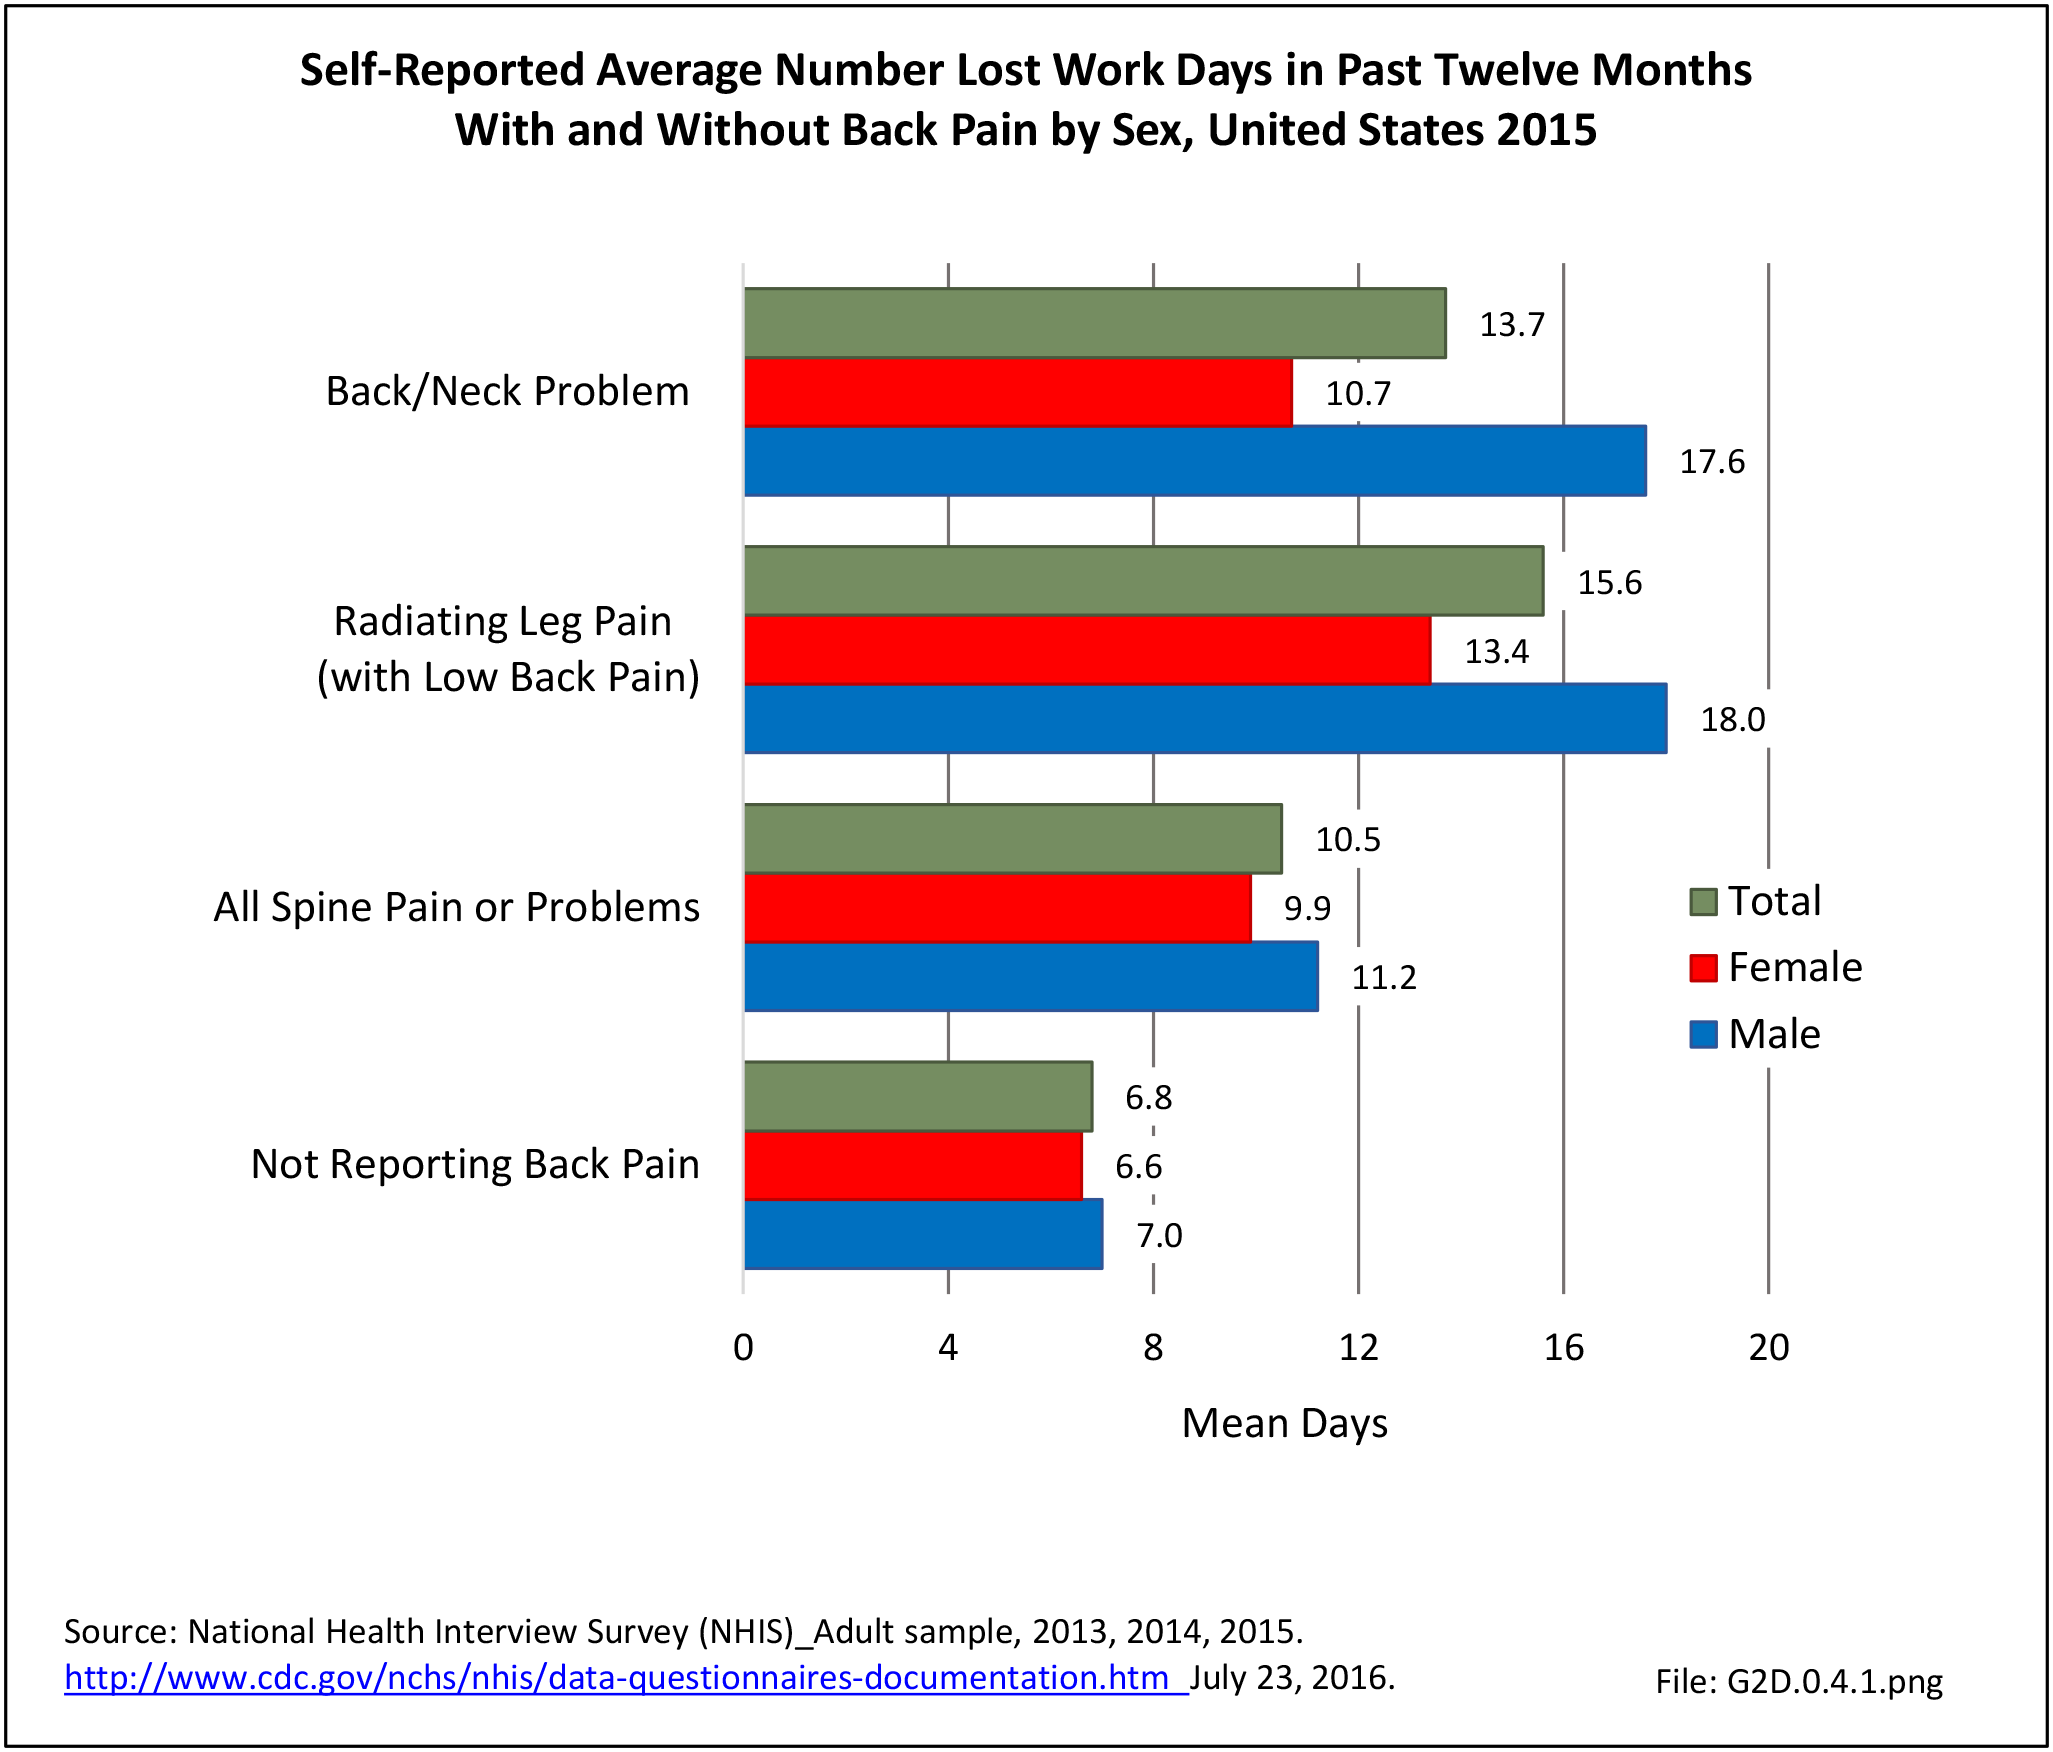
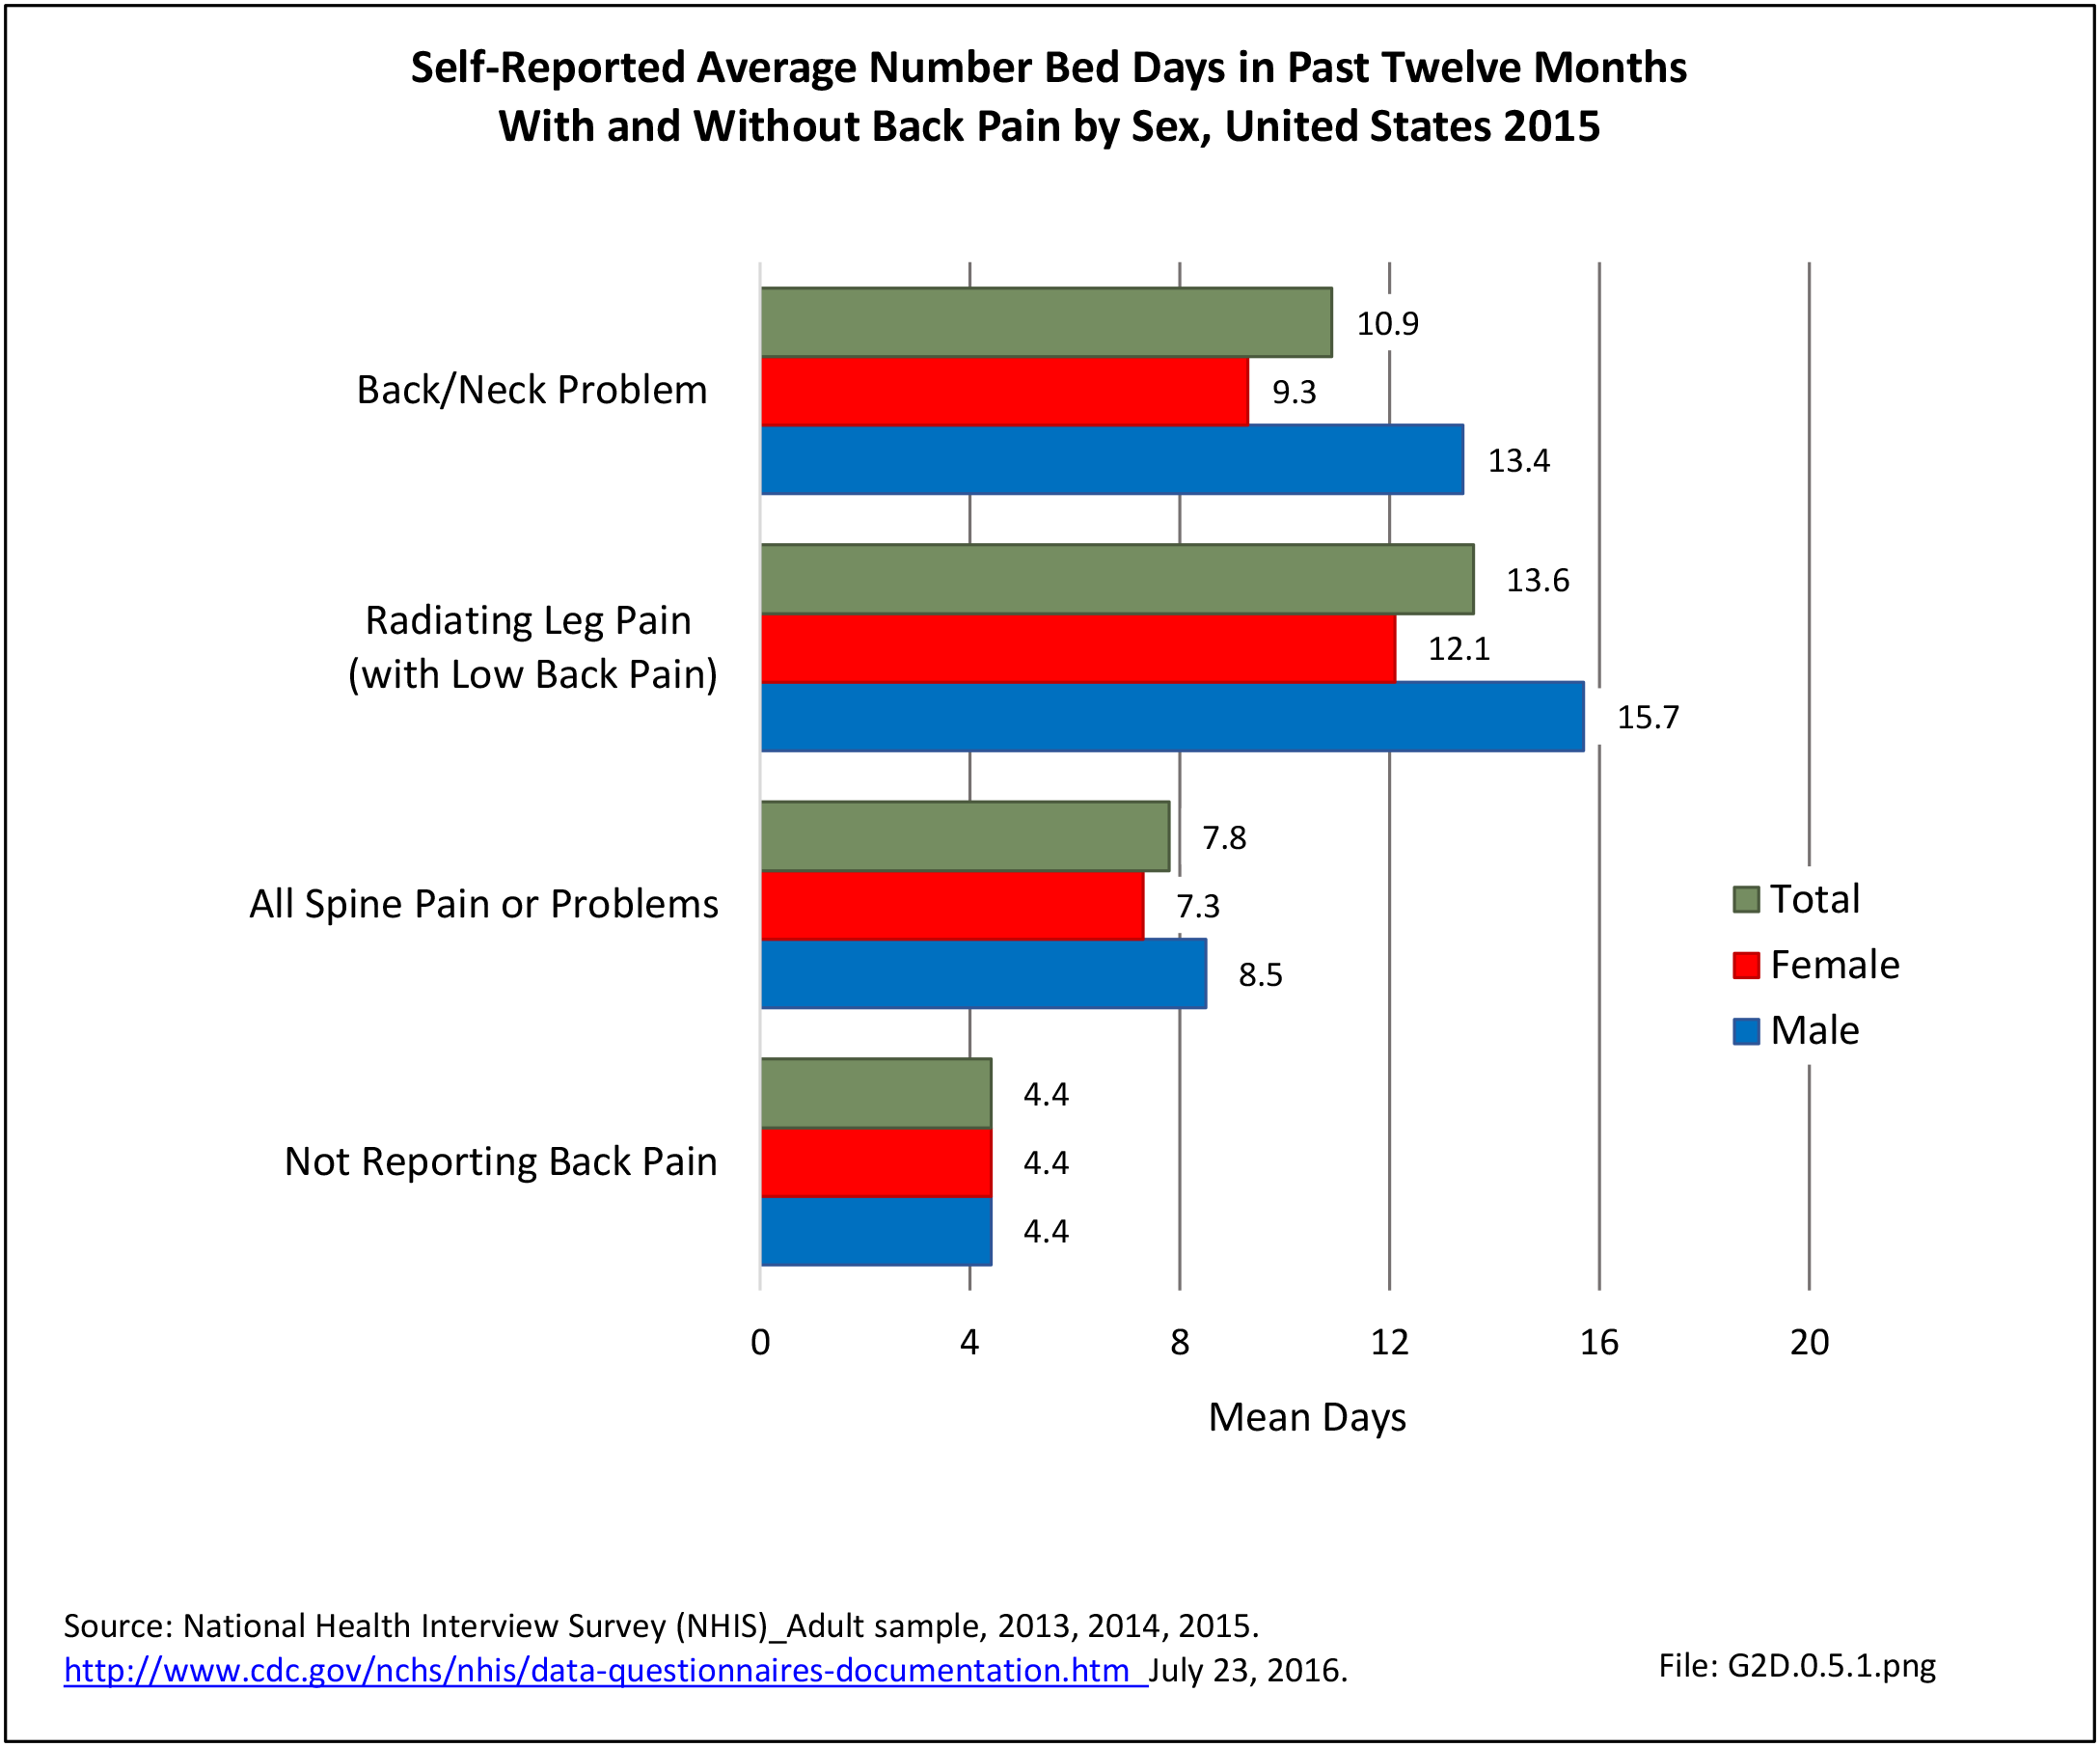
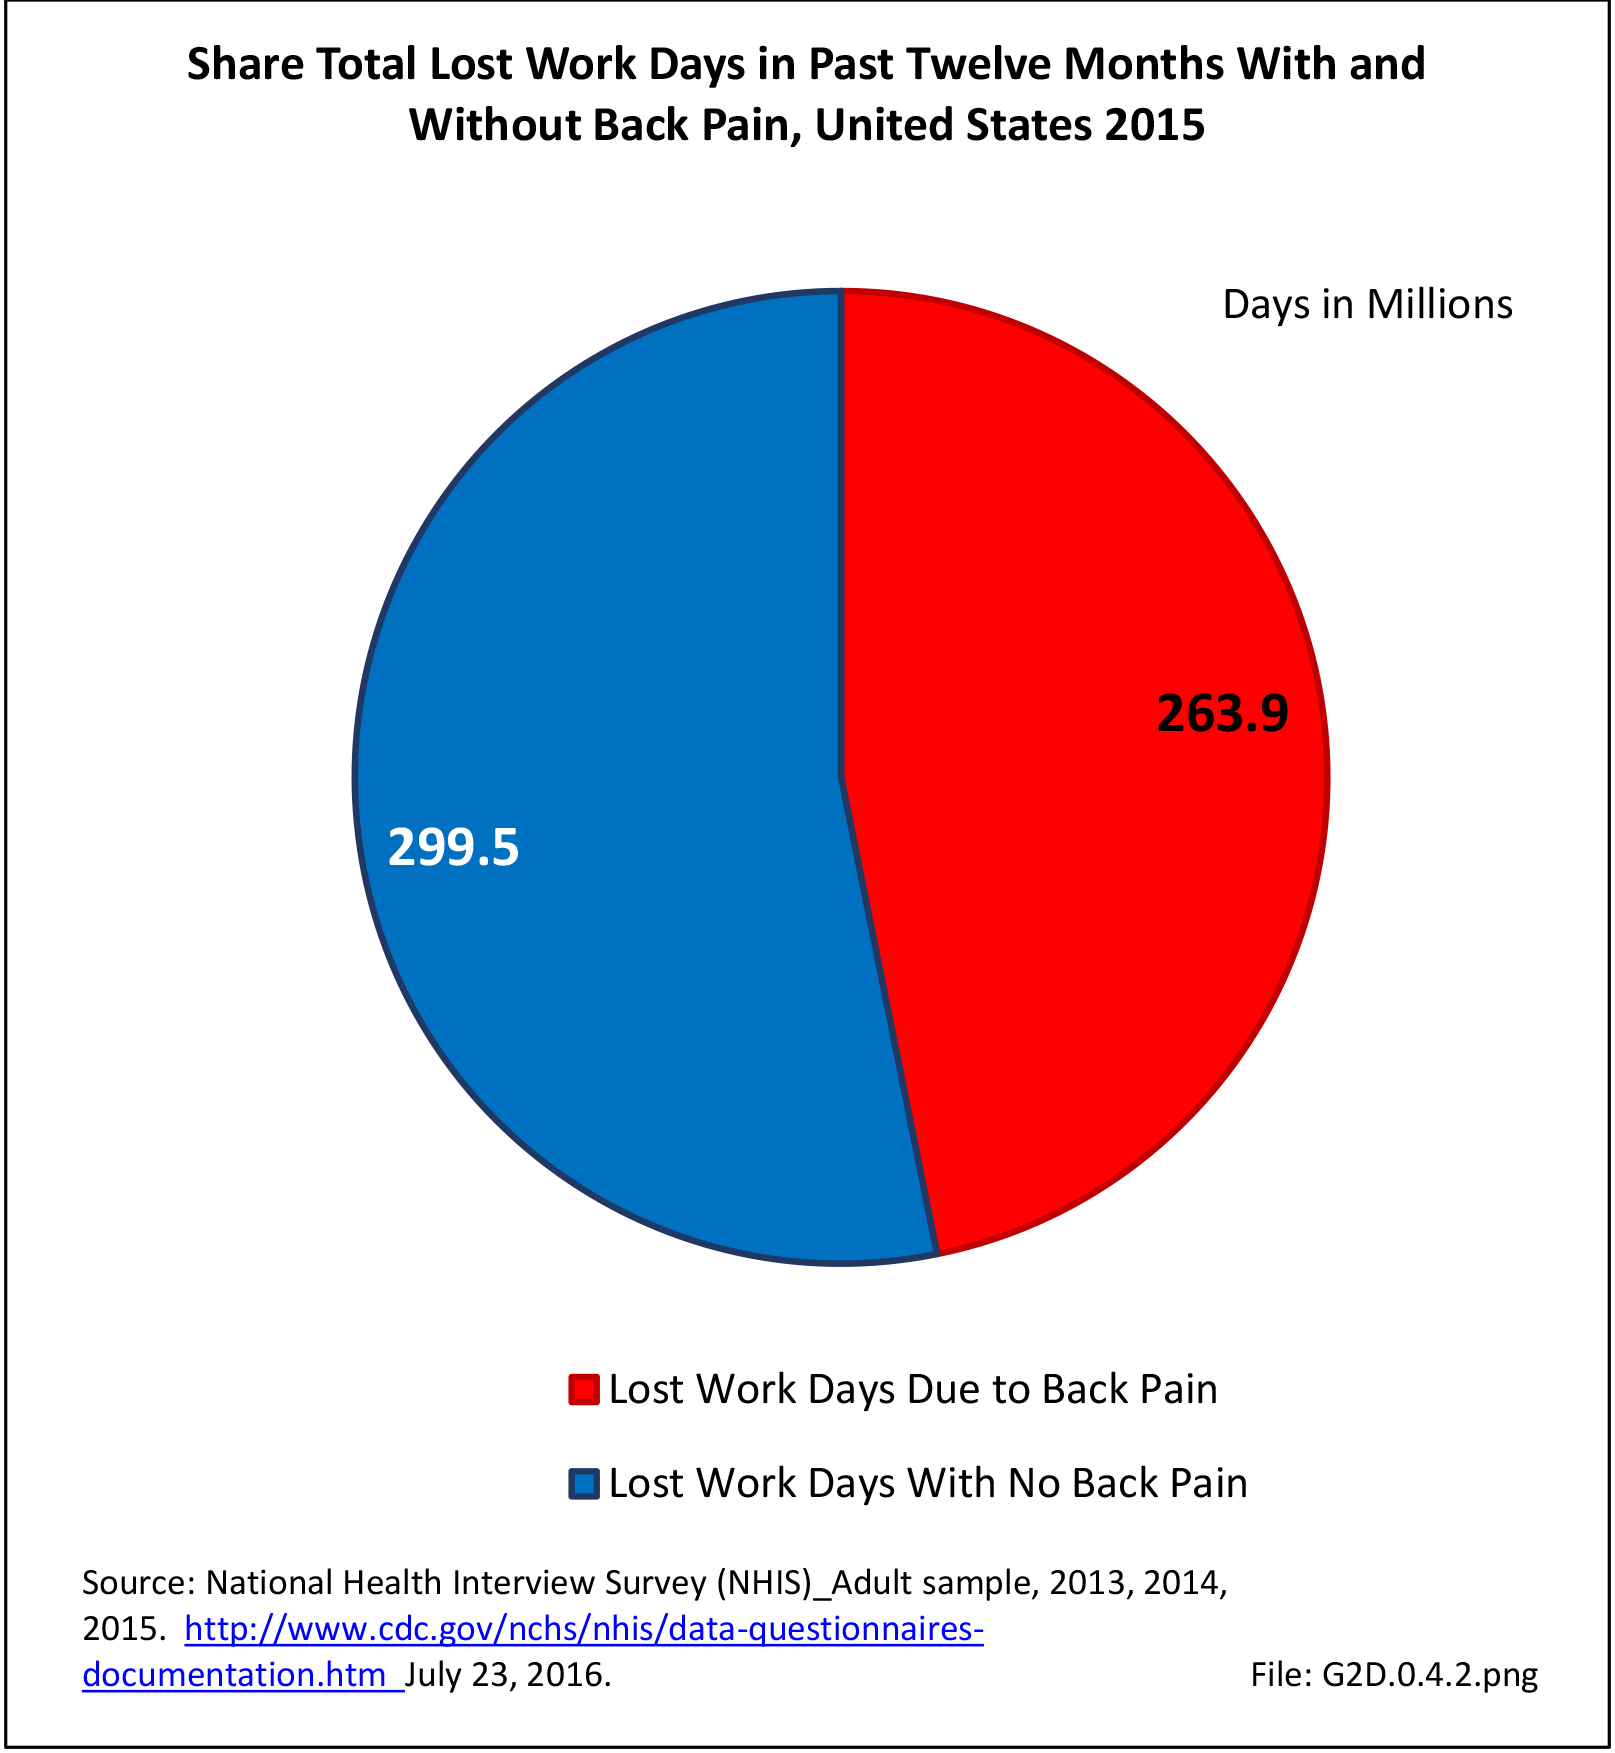
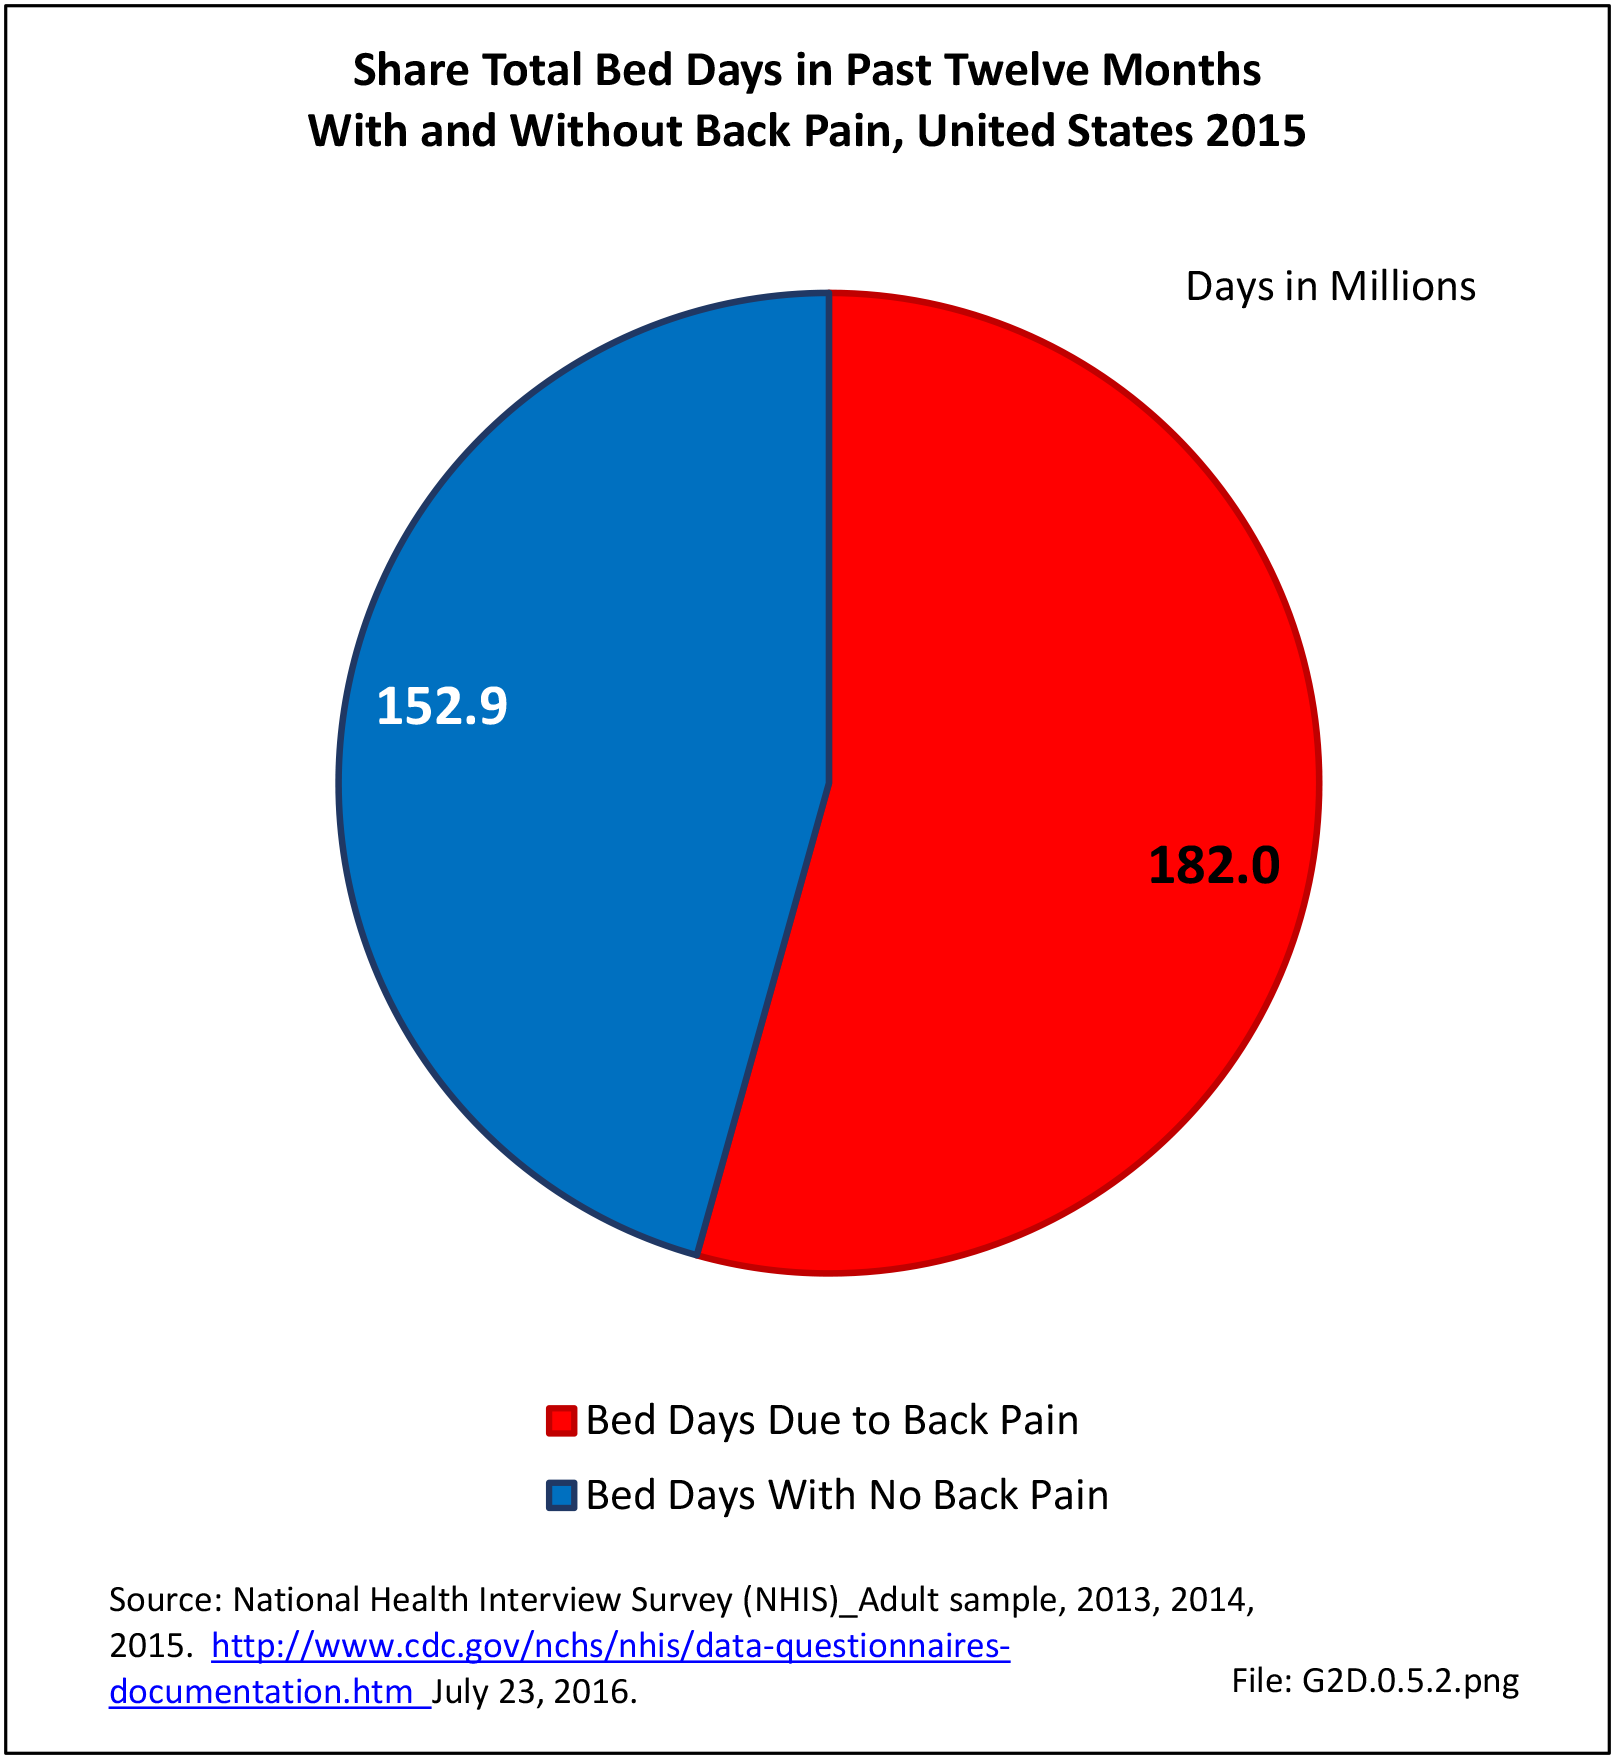
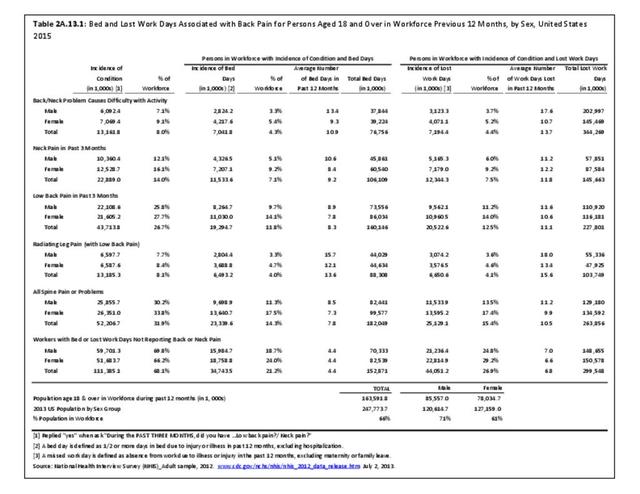
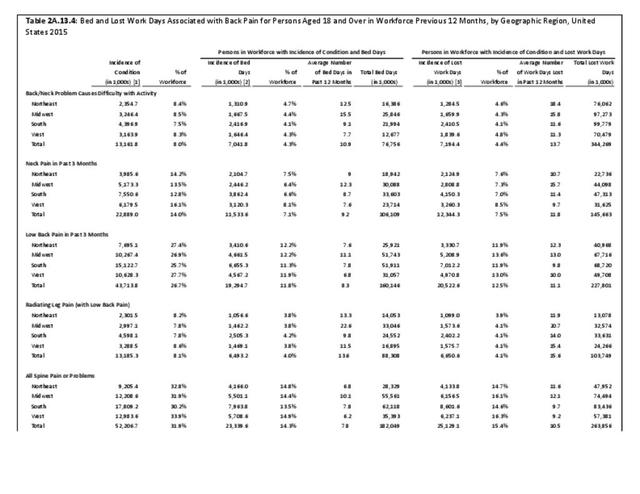
Also, in 2015, 14.3% of the workforce age population reported an average of 7.8 bed days in the previous 12 months, for a total of 182 million bed days, due to chronic back or neck pain. In addition, 15.4% of this same population reported an average of 10.5 lost work days in the previous year due to chronic back or neck pain, or approximately 264 million work days lost due to back pain. (Reference Table 2A.13.1 PDF CSV)
Edition:
- Fourth Edition