Rheumatoid arthritis (RA) is a systemic autoimmune disease that produces inflammatory arthritis (stiff, painful, swollen joints, usually symmetrical). Rheumatoid arthritis is a form of polyarthritis and involves many joints, both large and small; it can also affect the cervical spine. Over time, RA can affect other organs (eg, eyes, lungs) and can lead to increased risk of cardiovascular disease.1
Rheumatoid arthritis is a chronic condition and, while it may occur acutely in some patients, onset is usually gradual. It can take months before a patient seeks medical attention, usually when joint pain (arthralgia) progresses to swelling and tenderness of the joint. As a systemic disease, RA is associated with symptoms such as fatigue, weight loss, and depression. In RA, inflammation of the joint can lead to erosion or damage of cartilage and bone and eventual deformity. The patient with RA characteristically produces autoantibodies called rheumatoid factors and anti-CCP. Anti-CCP (cyclic citrullinated peptide) antibodies are directed to proteins that have a modified amino acid called citrulline. These antibodies occur in approximately 70-80% of patients and are important for diagnosis and early recognition.
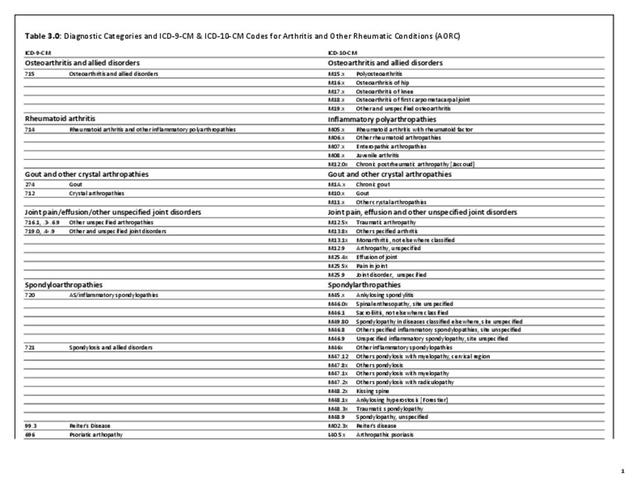
Rheumatoid arthritis was historically categorized based on the American Rheumatism Association Functional Class and Anatomic Stage, both proposed by Dr. Otto Steinbrocker in 1949. The former was updated by the American College of Rheumatology (ACR) in 19922 as follows:
Class I: Patient able to perform usual activities of daily living (self-care [dressing, feeding, bathing, grooming, and toileting], vocational [work, school, or homemaking] and avocational [recreational and/or leisure])
Class II: Able to perform usual self-care and vocational activities, but limited in avocational activities
Class III: Able to perform usual self-care activities but limited in vocational and avocational activities
Class IV: Limited in ability to perform usual self-care, vocational and avocational activities.
The revised classes were validated in a study of 325 patients using the Health Assessment Questionnaire (HAQ): mean HAQ disability index scores were Class I = 0.33, Class II = 1.02, Class III = 1.70 and Class IV = 2.67.
It is currently the usual practice to consider staging RA based on duration of signs and symptoms and the presence of autoantibodies and radiographic erosions. Hence, as currently defined by the ACR, RA is classified as follows:
Early RA = Signs and symptoms of < 6 months duration
Established RA = Signs and symptoms of ≥ 6 months duration or meeting the 1987 classification criteria
Seropositivity = presence of either rheumatoid factor (RF) or anti-citrullinated peptide antibodies (ACPA). Presence of erosions on radiographs of the hands/wrists.
In addition, one considers the level of disease activity at the time of the patient’s visit to inform treatment decisions. Several reliable and valid instruments are available for this purpose; most useful are the Disease Activity Score 28 using either the erythrocyte sedimentation rate or the C-reactive protein marker, the Simplified Disease Activity Index, or the Clinical Disease Activity Index. The latter does not require obtaining any laboratory tests to measure acute phase reactants. The ACR has published recommendations for the management of RA based on the above parameters, especially disease duration and disease activity.3
Although there is no cure for RA, early identification and treatment is important since current therapy can lead to significant improvement and reduce the likelihood for joint damage and progression to deformity. Therapy for RA involves a large group of medications that decrease inflammation and modify the course of disease. These agents are called DMARDS (disease modifying antirheumatic drugs) and have led to important improvement in overall outlook.
Prevalence of Rheumatoid Arthritis
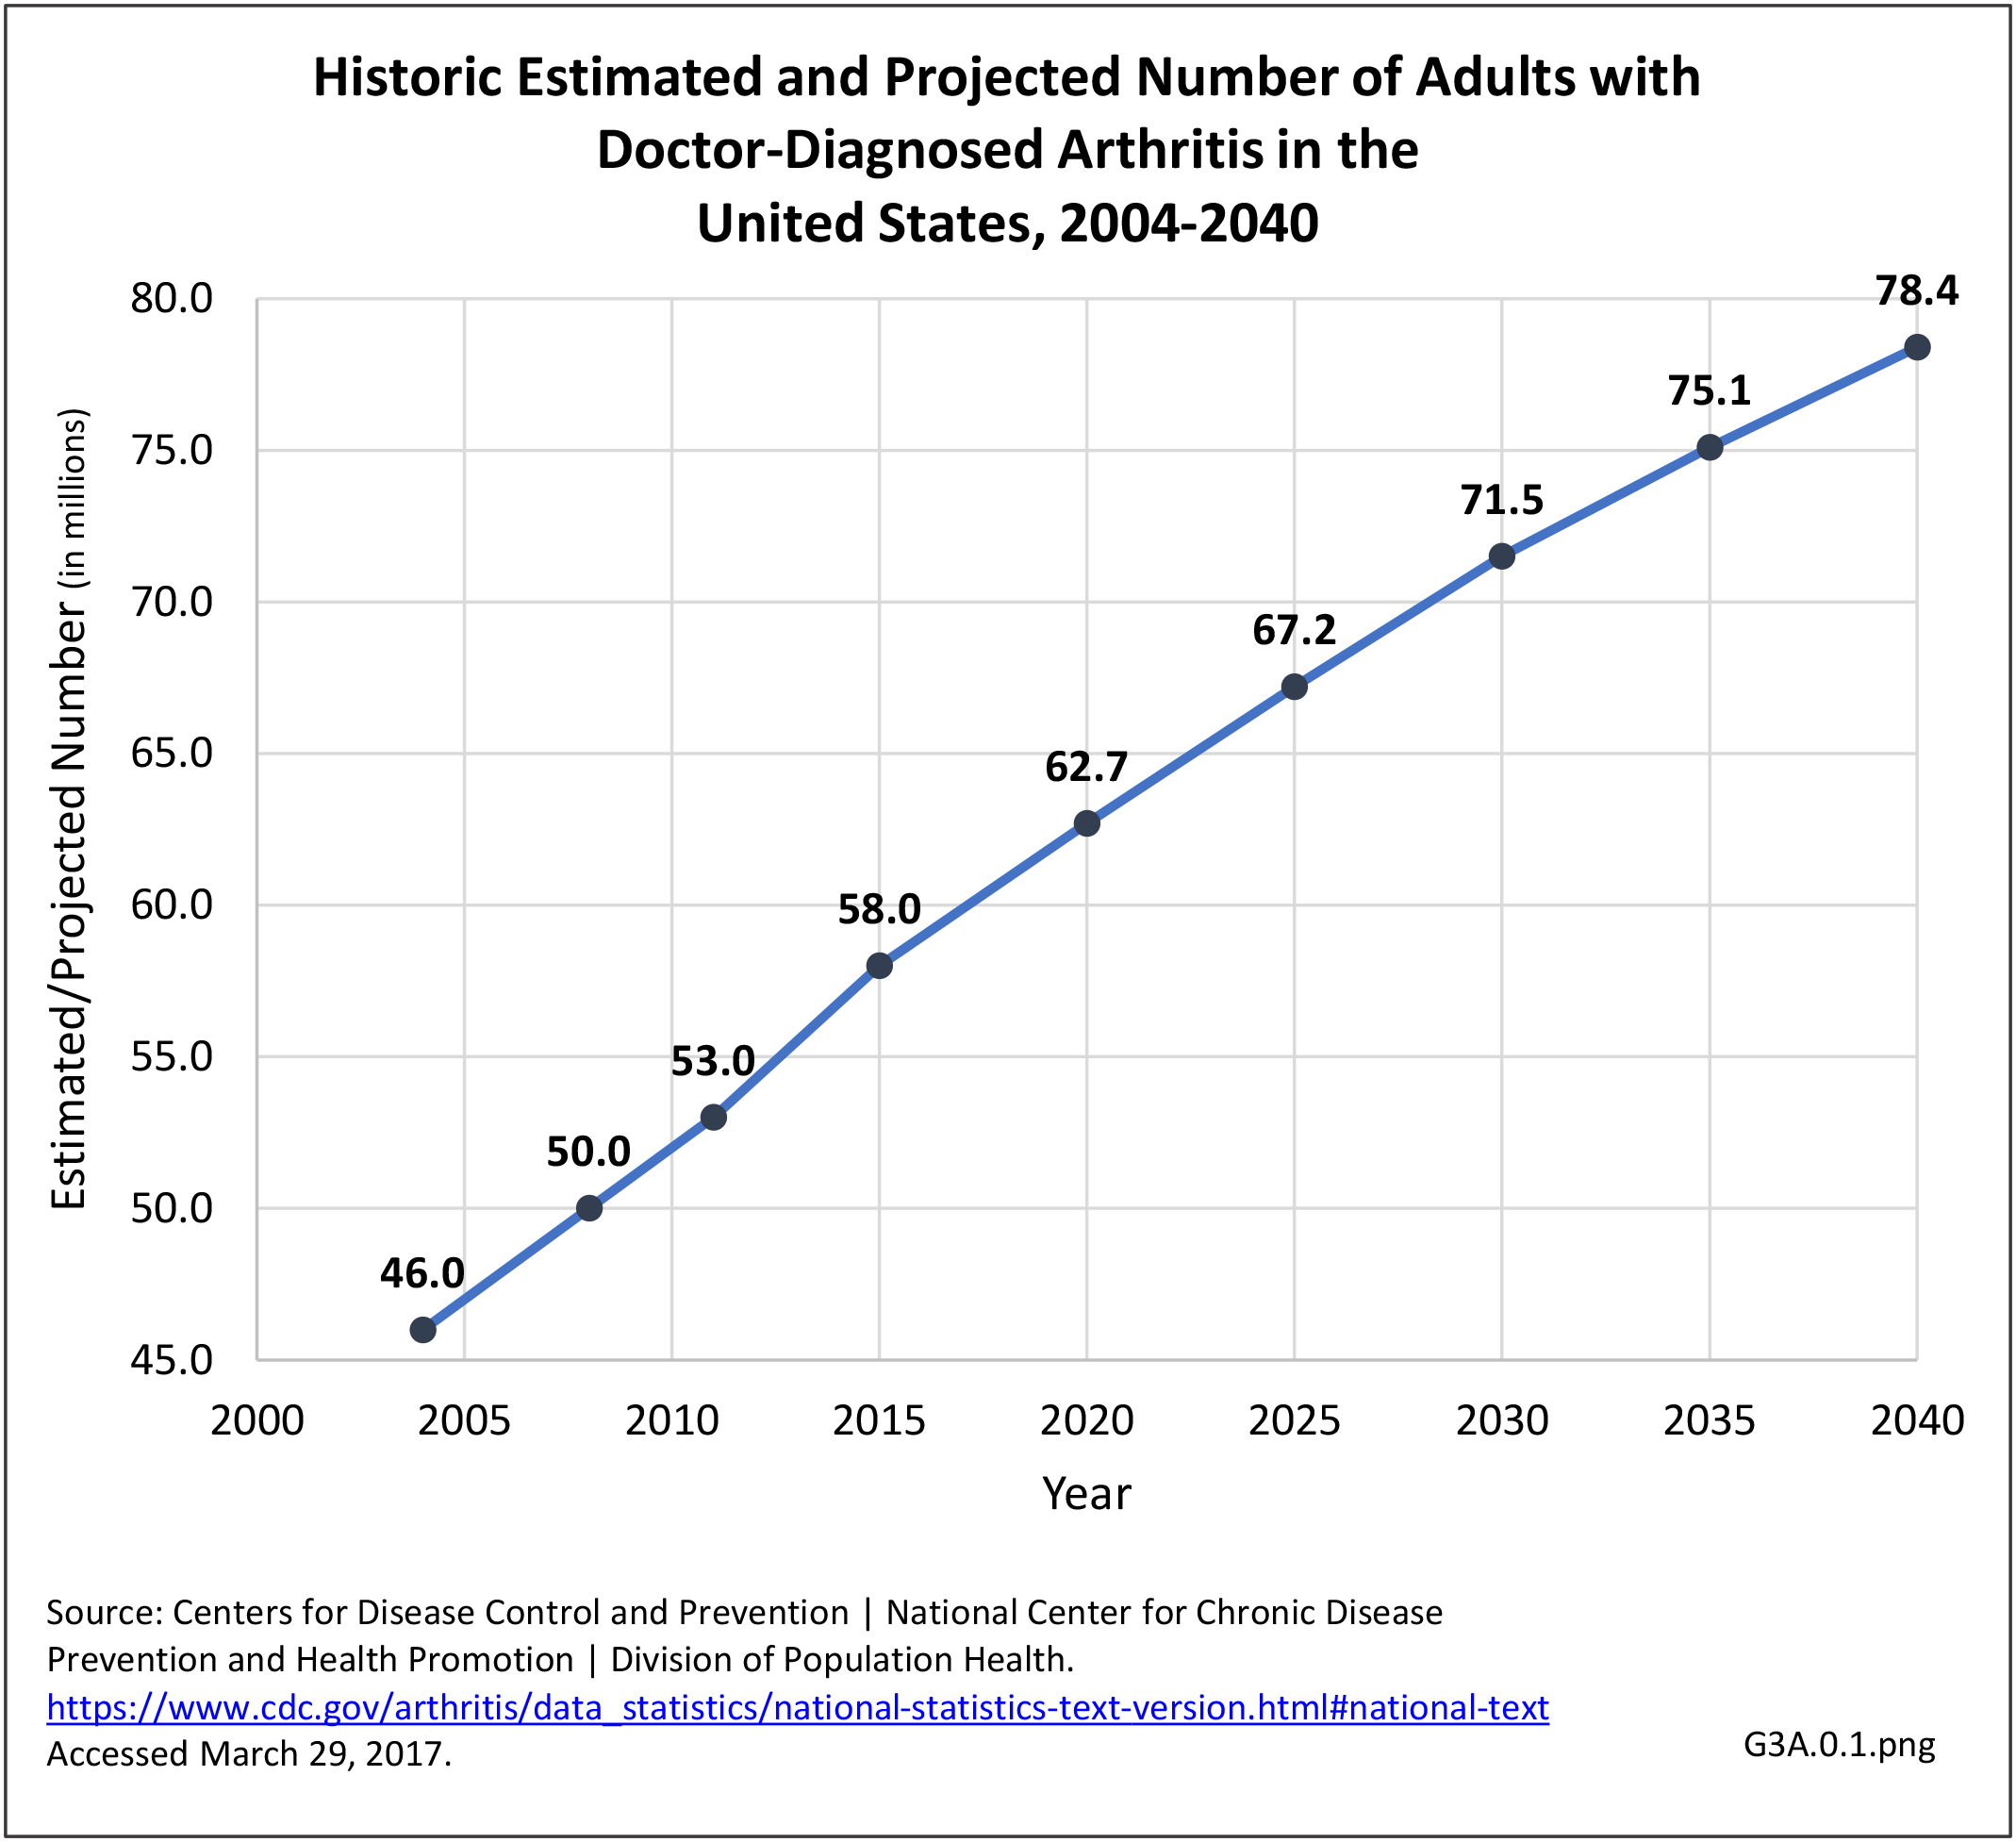
As noted earlier in this report, clinical data are required to provide validity for estimating the prevalence of specific types of arthritis because the exact type of AORC causing pain and swelling is often unclear from observation. Prevalence of RA in the US is estimated to be between 1.3 and 1.5 million persons,4,5,6 roughly 0.50% of the adult population. Prevalence varies by sex, affecting 0.29%-0.31% of males and 0.73%-0.78% of females.6Also note that prevalence varies by age with highest ratios in older adults aged 65 years and older and lower ratios in declining 10-year age groups. The estimated prevalence of RA in the US population age 60 years and older is 2%.7
Healthcare Utilization
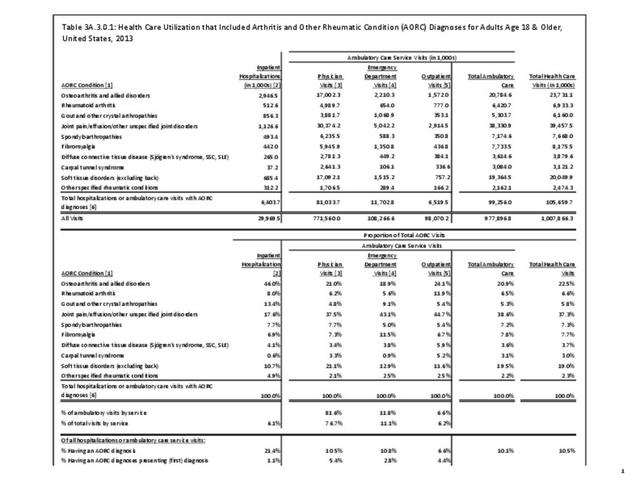
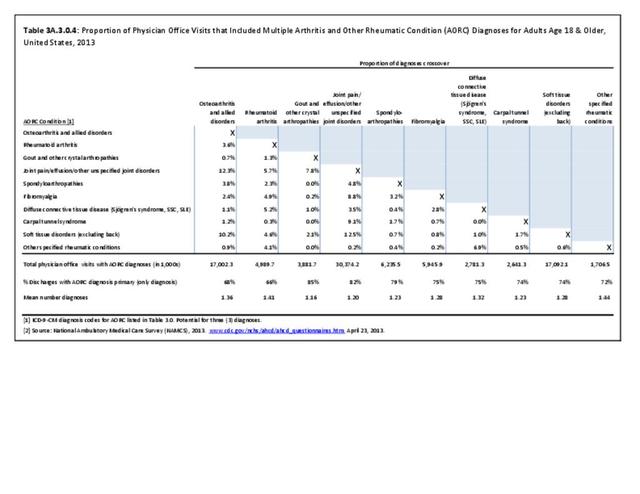
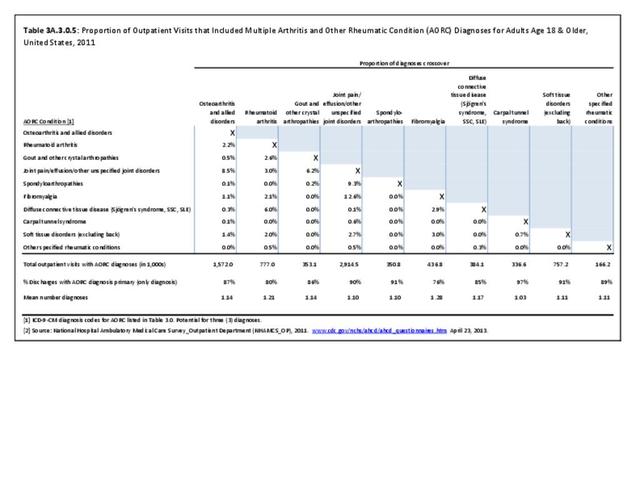
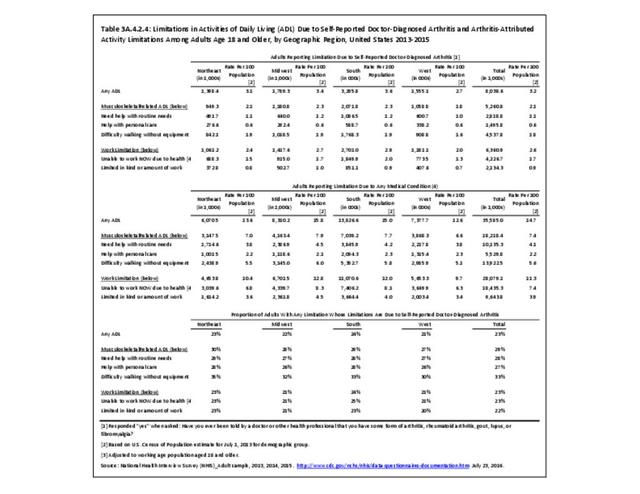
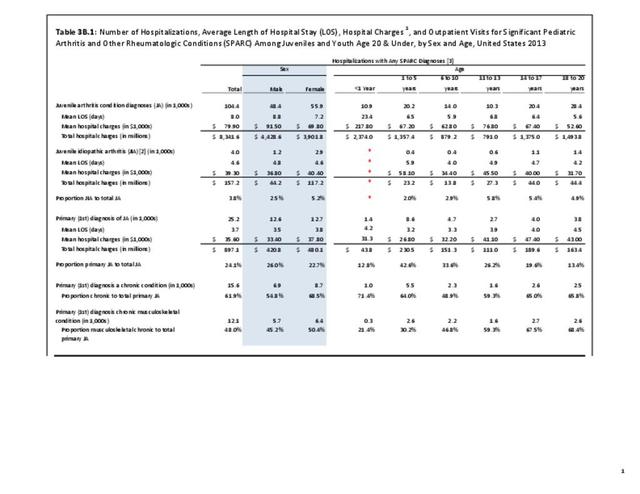
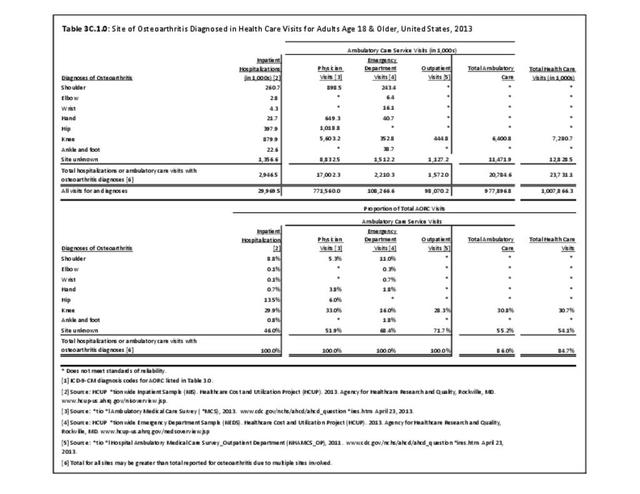
Rheumatoid arthritis effects overall health but may not be identified as the condition for which a patient is hospitalized. The NIS includes a separate variable identifying comorbidities of patients. Analyzing this variable, RA was identified as a comorbidity in 821,100 hospital discharges, or 2.7% of all hospital discharges, in 2013. However, when discharges were analyzed using the ICD9-CM codes, RA was diagnosed in only 512,600 discharges, or 1.7% of discharges for any diagnoses. Comorbidity designations are not made for all inpatients. Overall, 61% of discharges with RA diagnosed as a comorbidity also had an admitting diagnosis of RA, leaving two in five (39%) diagnosed with RA as a comorbidity but hospitalized for another cause. Common other forms of arthritis and associated diseases with RA as a comorbid condition include lupus (SLE) and fibromyalgia. (Reference graphs G3C.2.1.1 and G3C.2.1.2)


Hospitalization
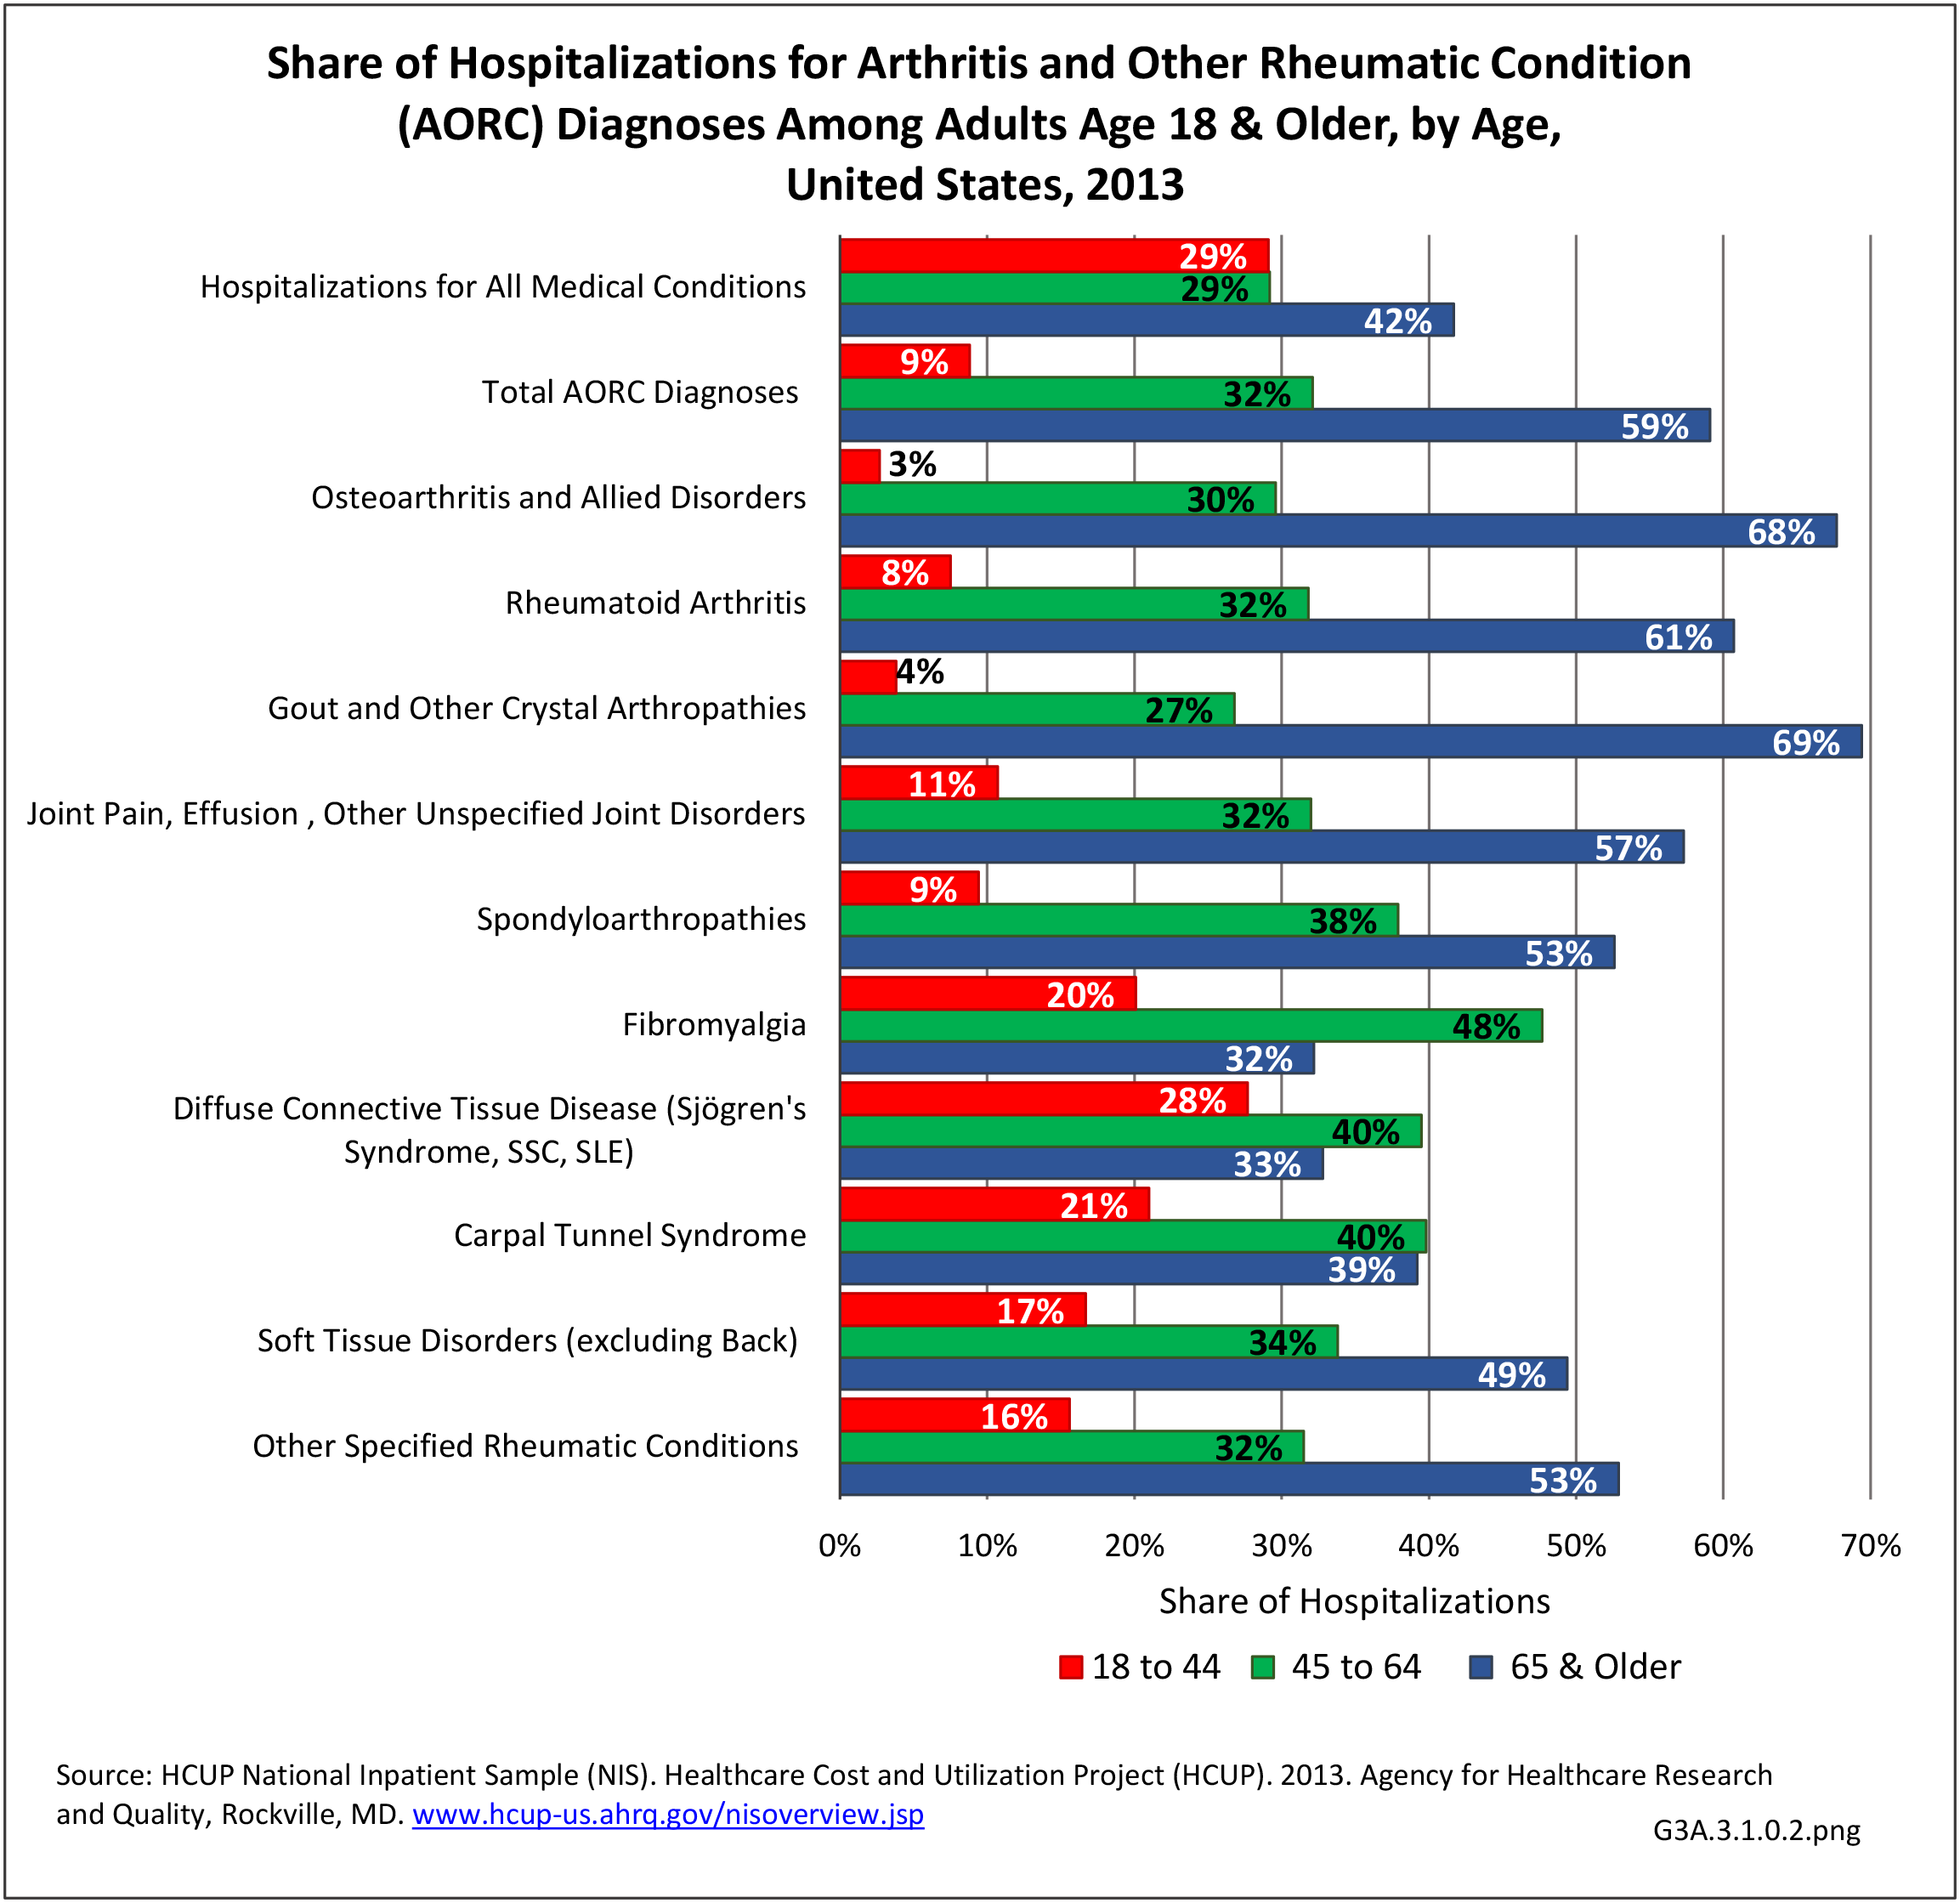
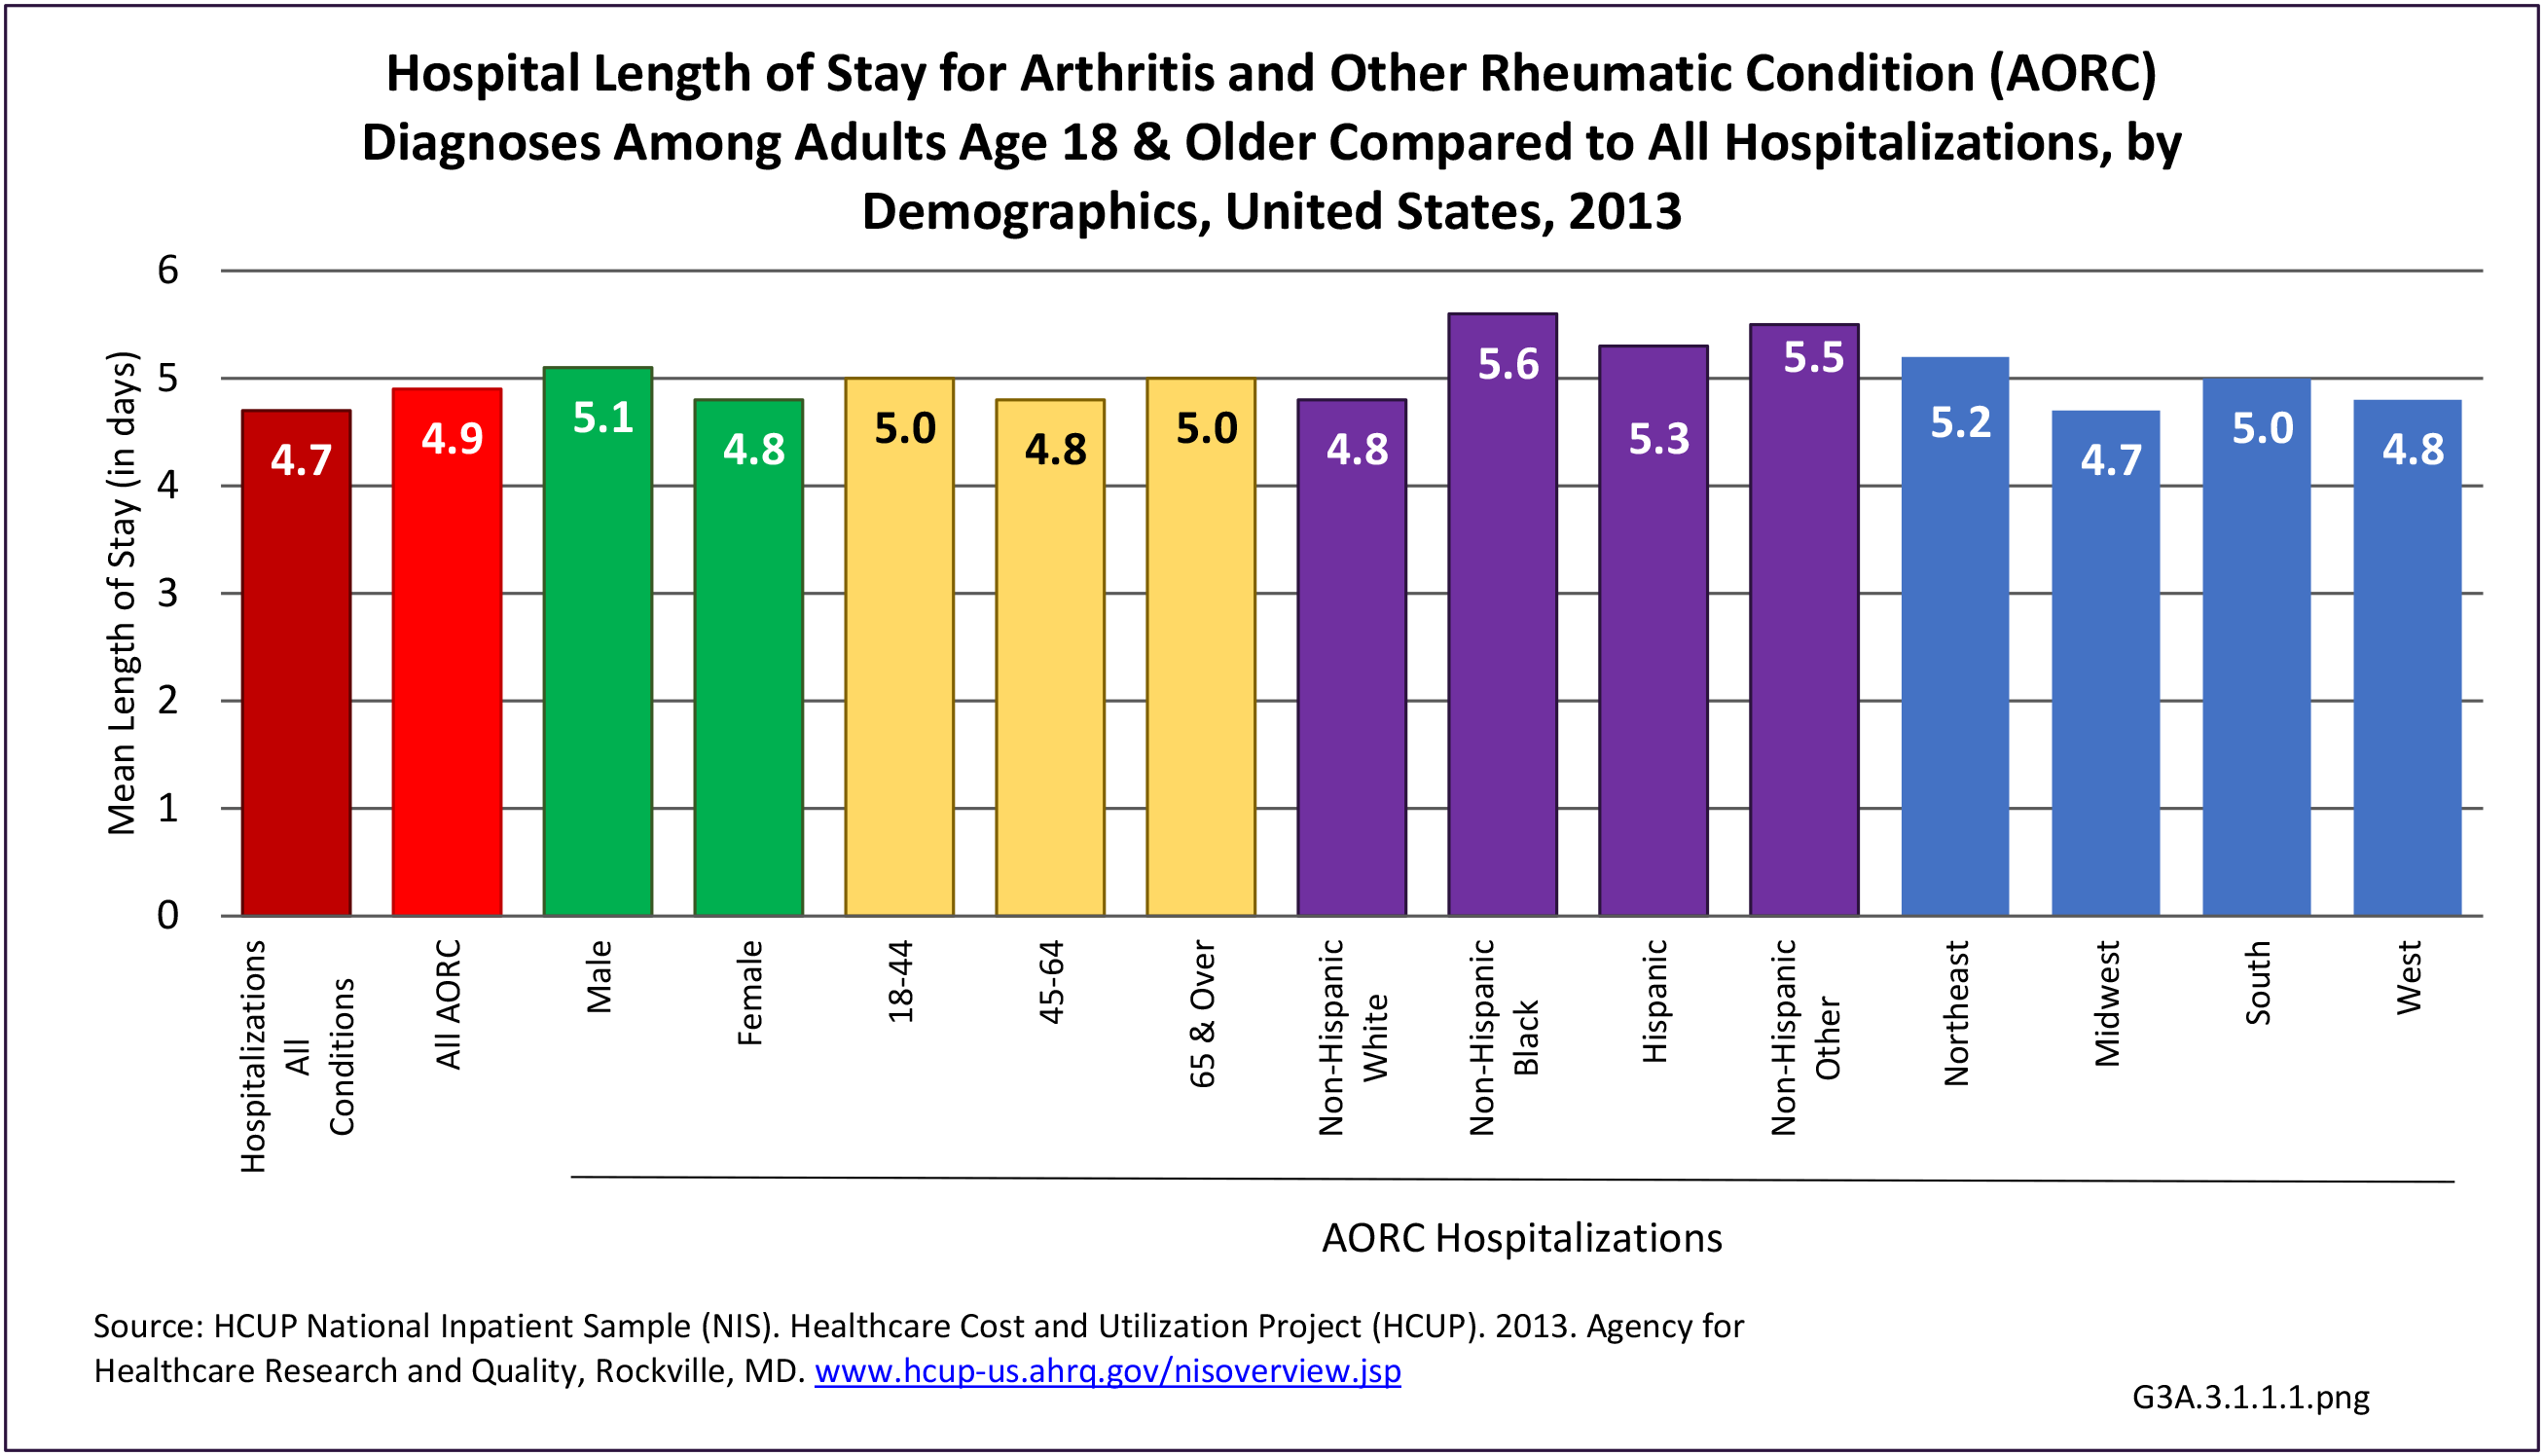
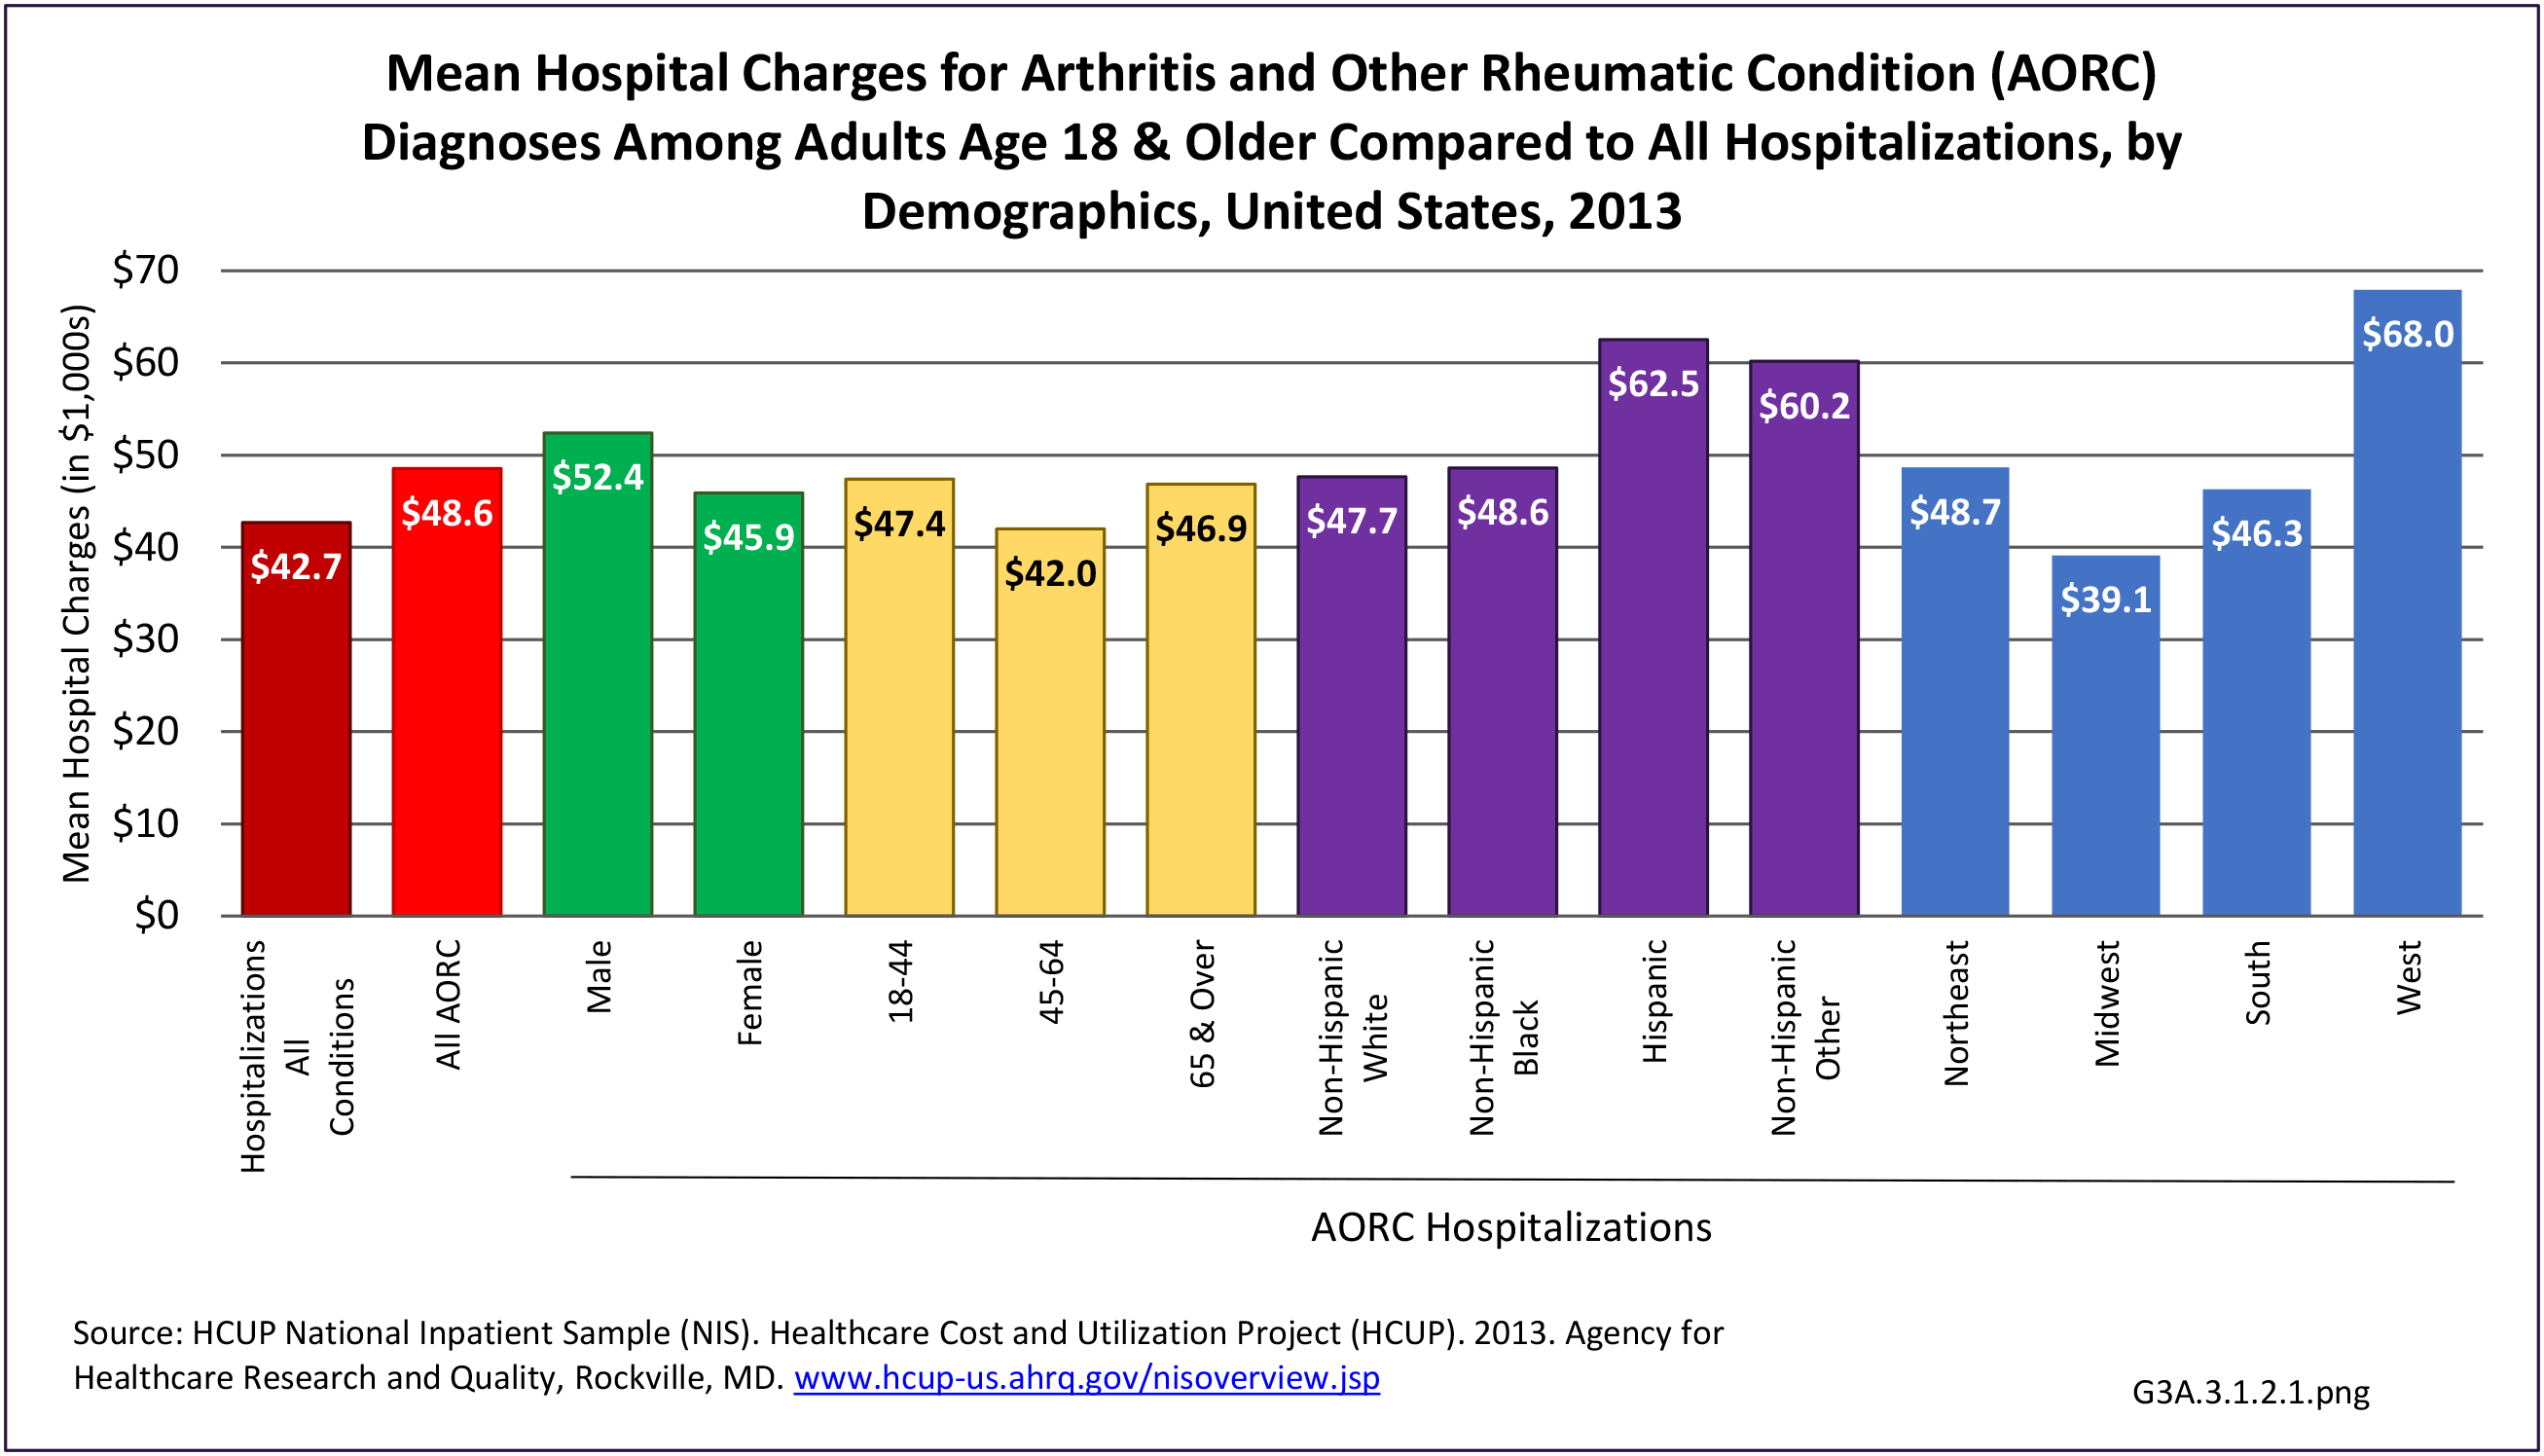
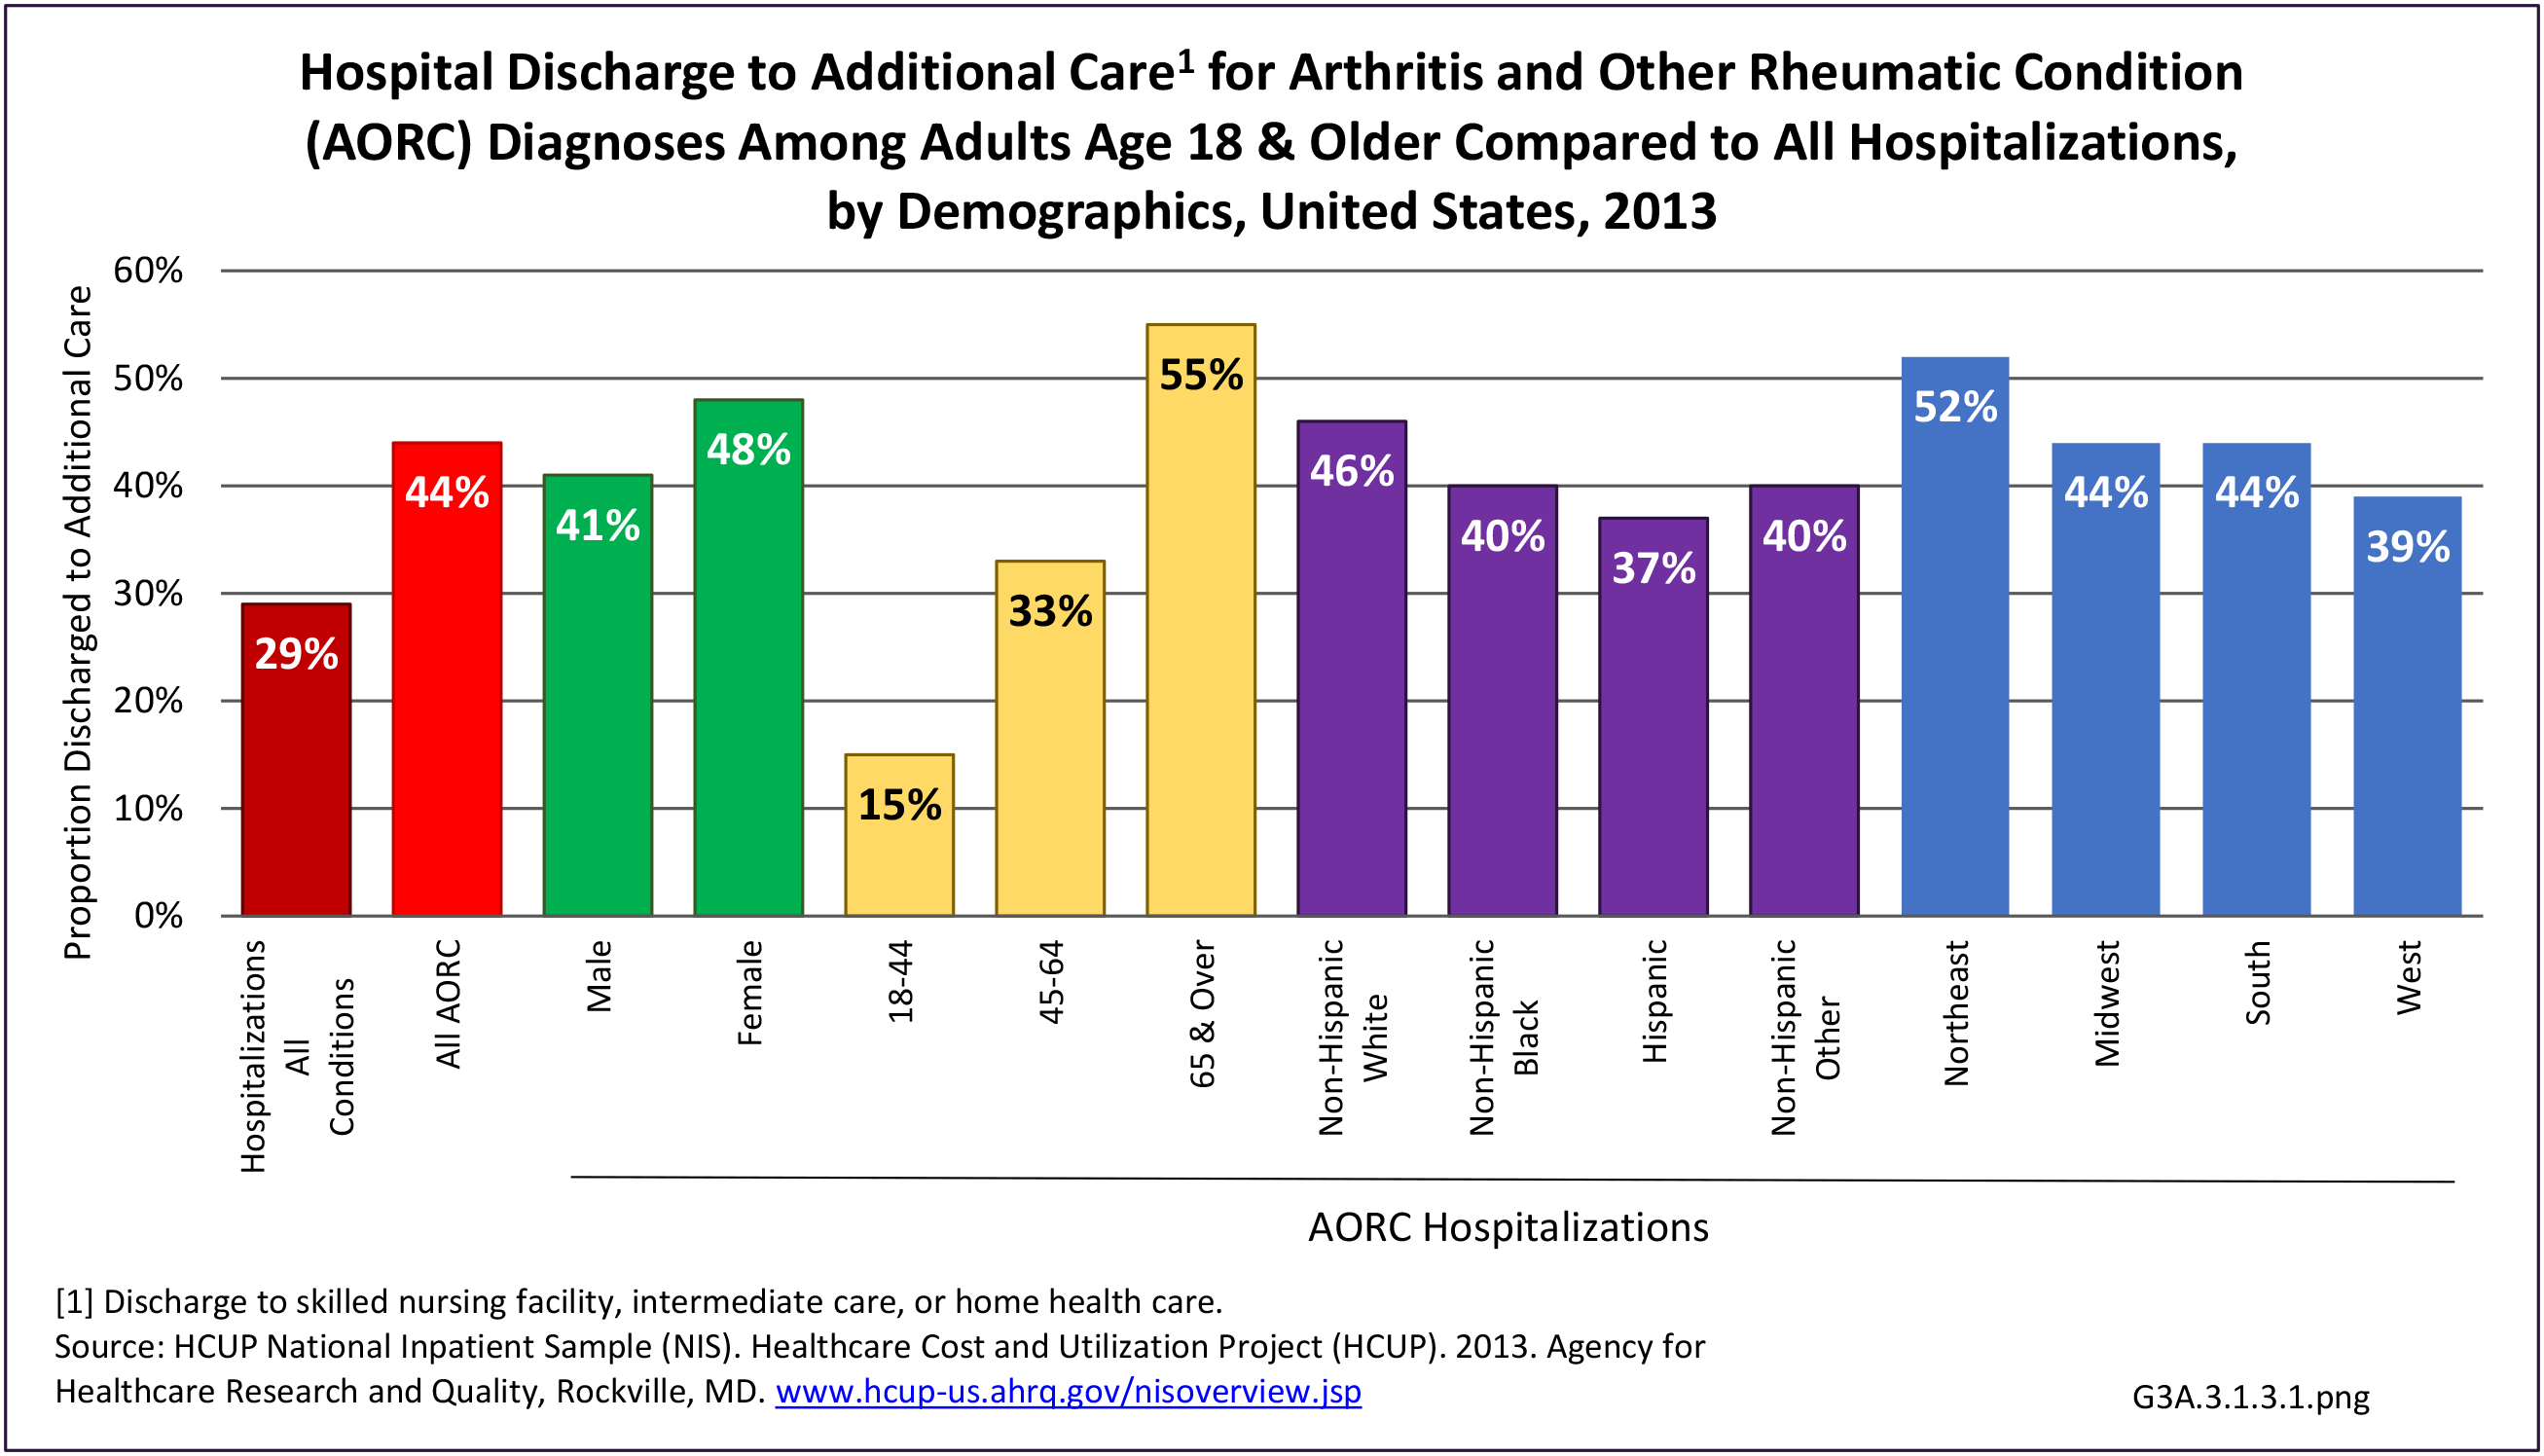
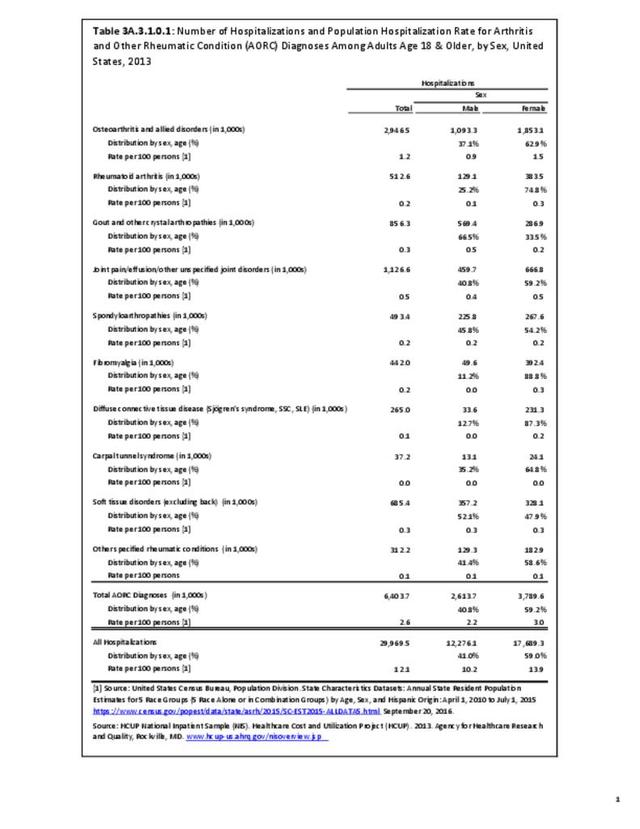
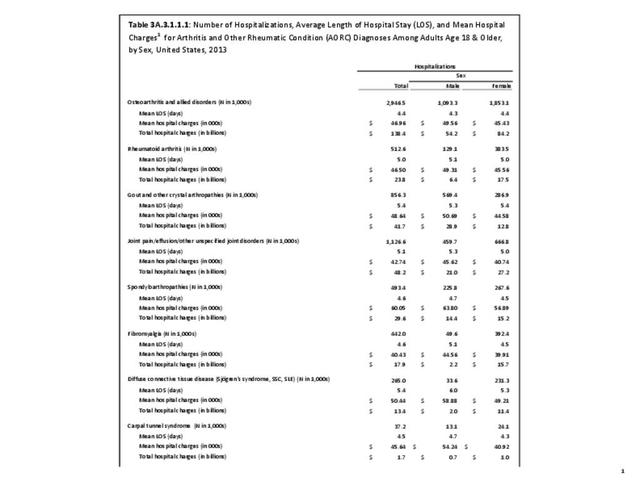
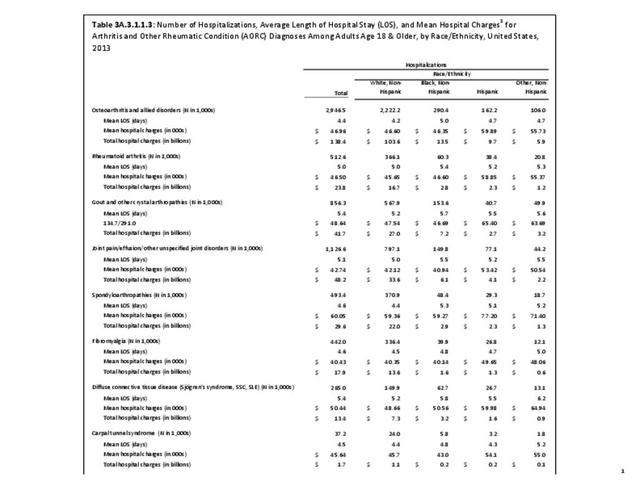
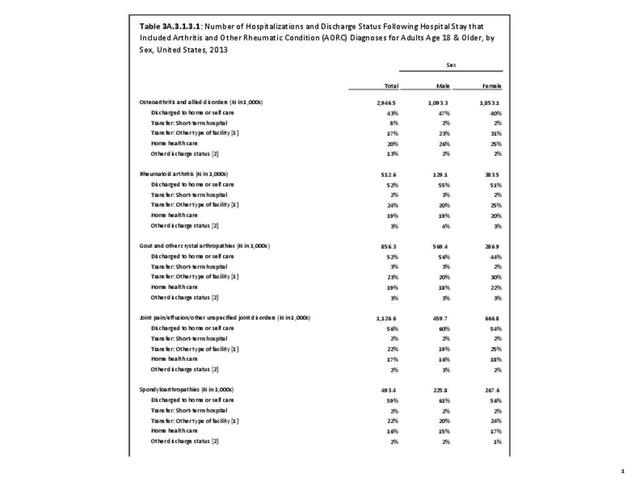
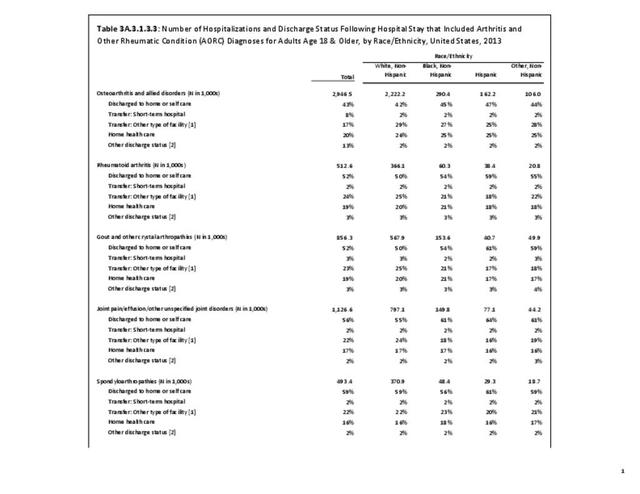
As previously noted, RA was diagnosed in slightly more than one-half million hospitalizations in 2013, representing 1.7% of discharges for any diagnoses. This is compared with the general prevalence rate of approximately 0.5%. Mean length of hospital stay and mean hospital charges were slightly higher than for all hospital discharges (106% and 109%, respectively). Nearly half (45%) of discharges with an RA diagnoses were dischared to additional care (short-term or home health), compared with 33% for all diagnoses discharges. (Reference Table 3A.3.1.0.1 PDF CSV; Table 3A.3.1.1.1 PDF CSV; Table 3A.3.1.3.1 PDF CSV)

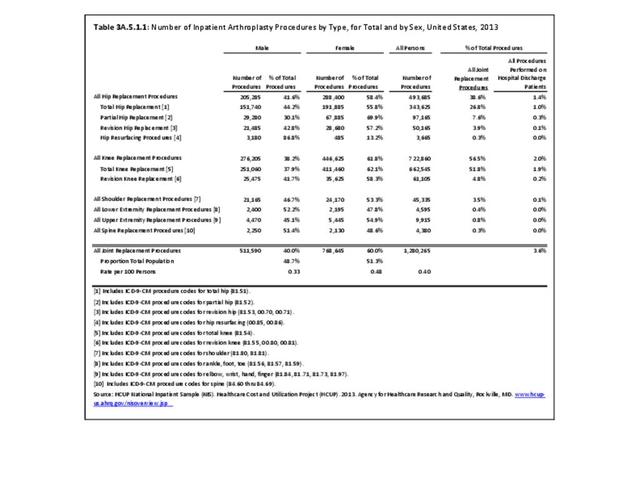
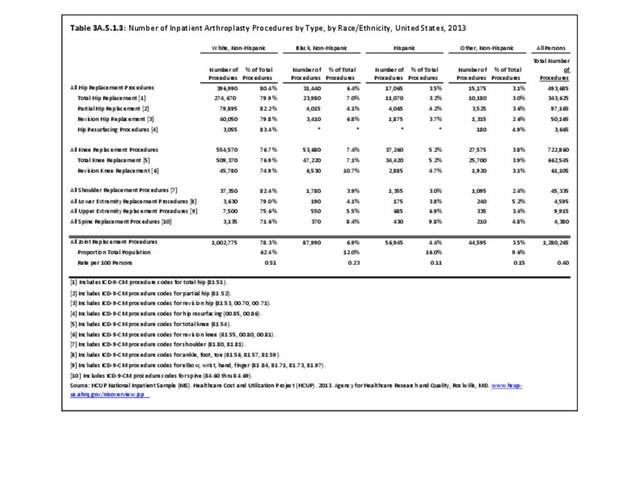
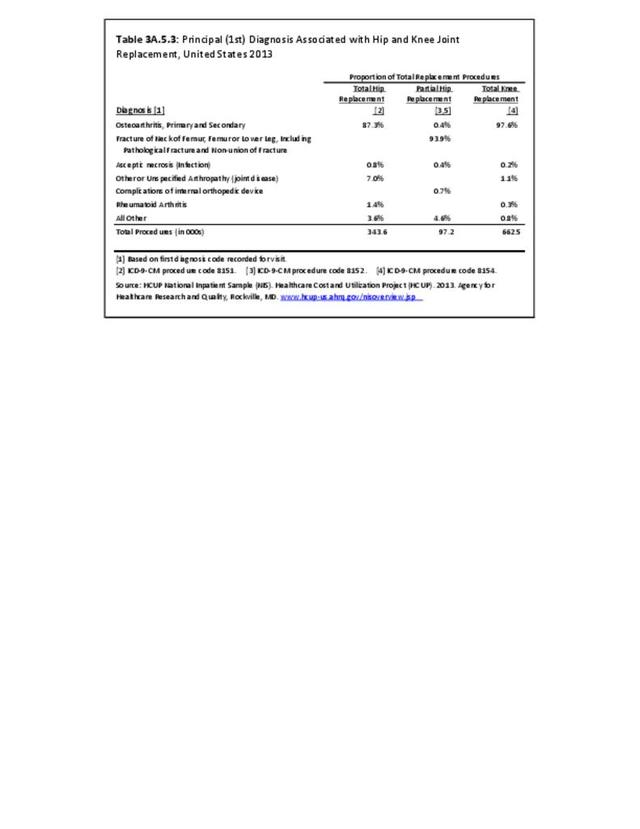
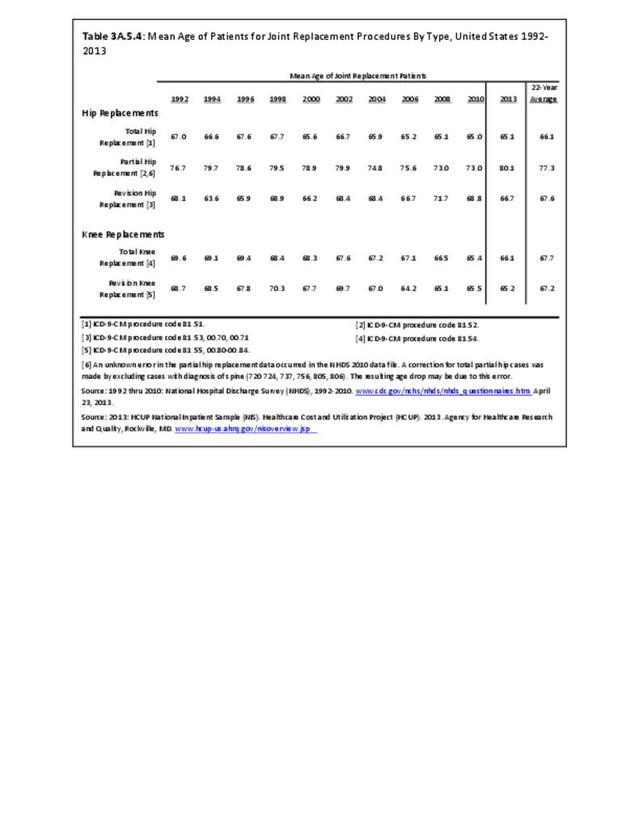
Rheumatoid arthritis was the first diagnoses recorded in 1.4% of total hip replacements and 0.3% of total knee replacements in 2013. (Reference Table 3A.5.3 PDF CSV)
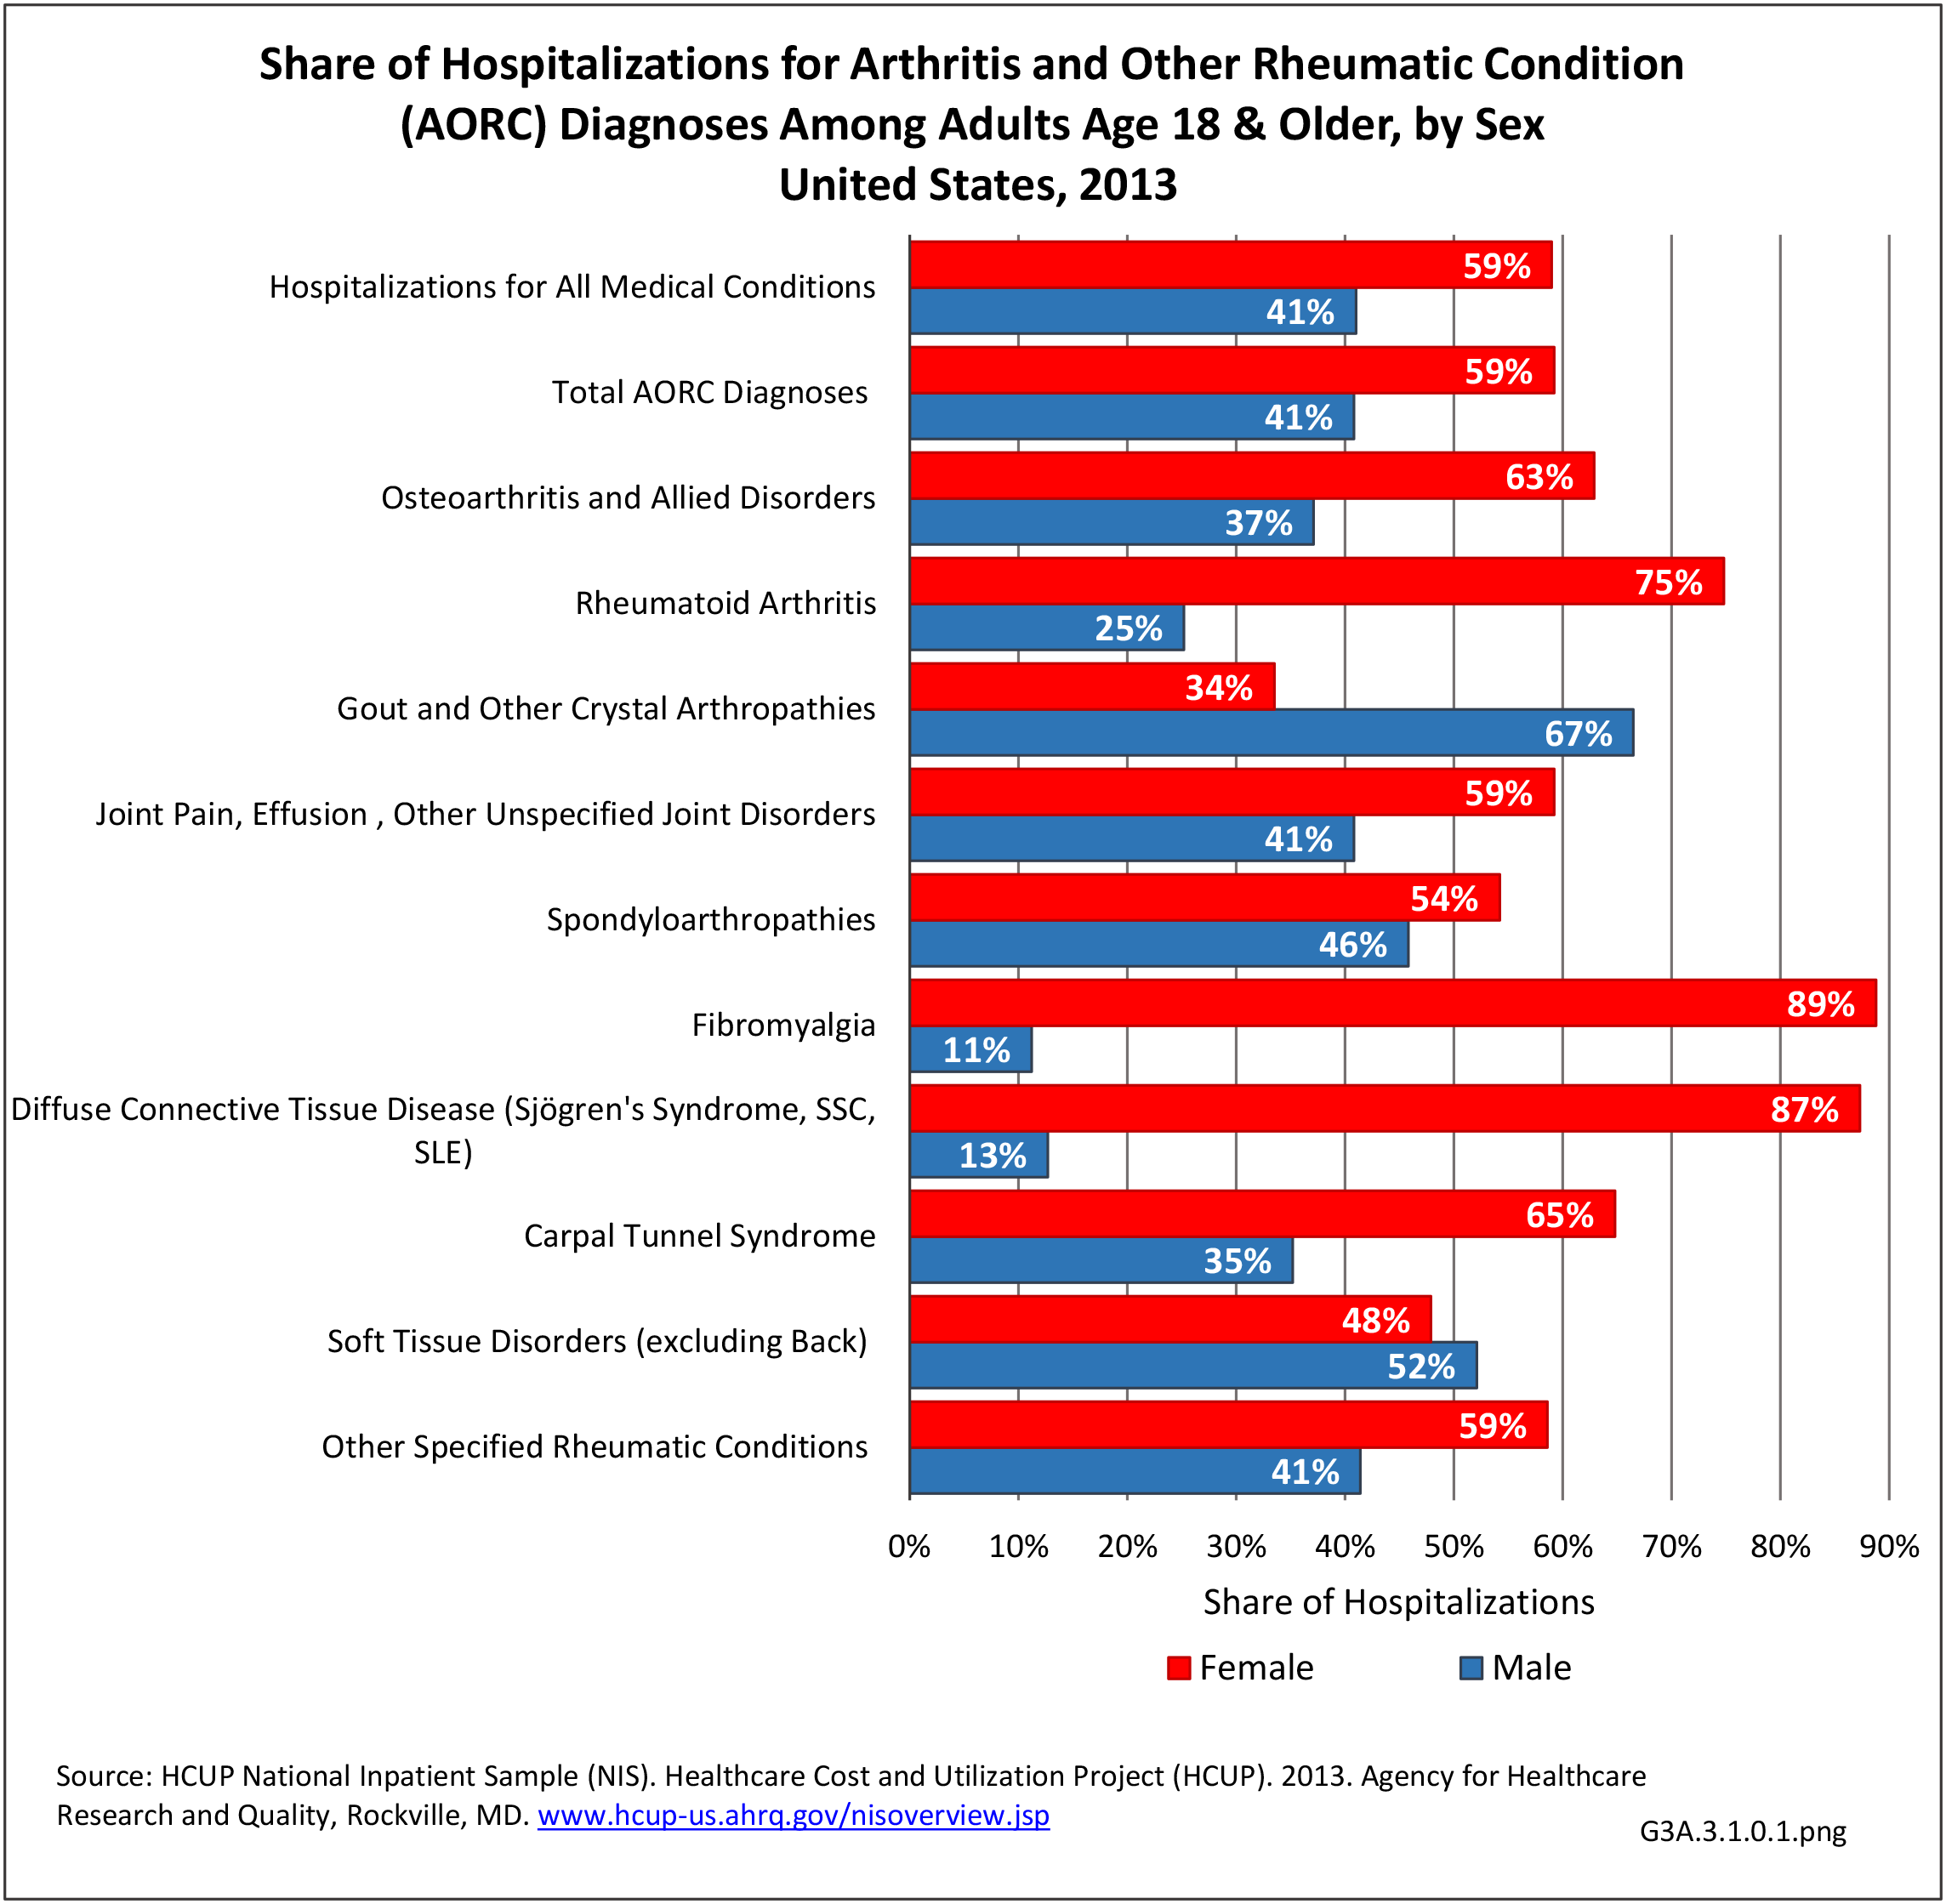
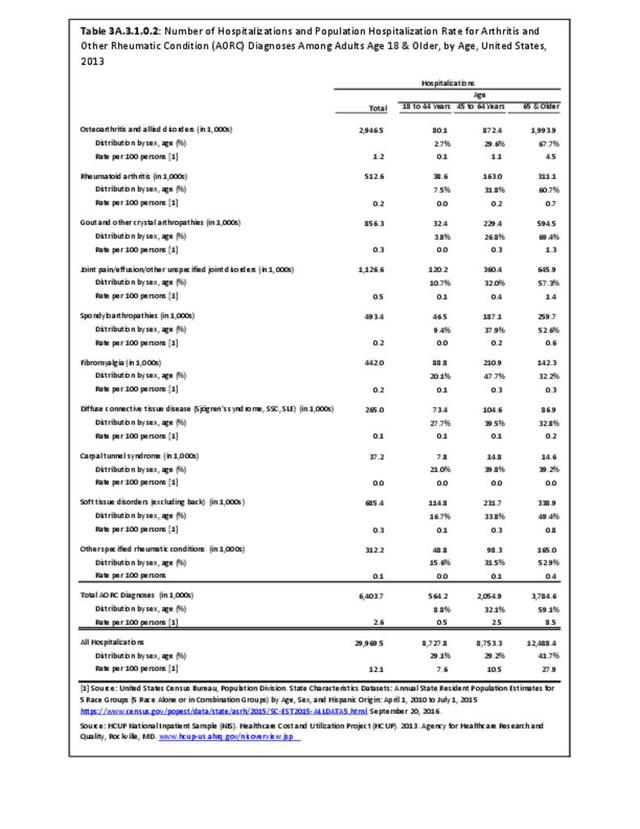
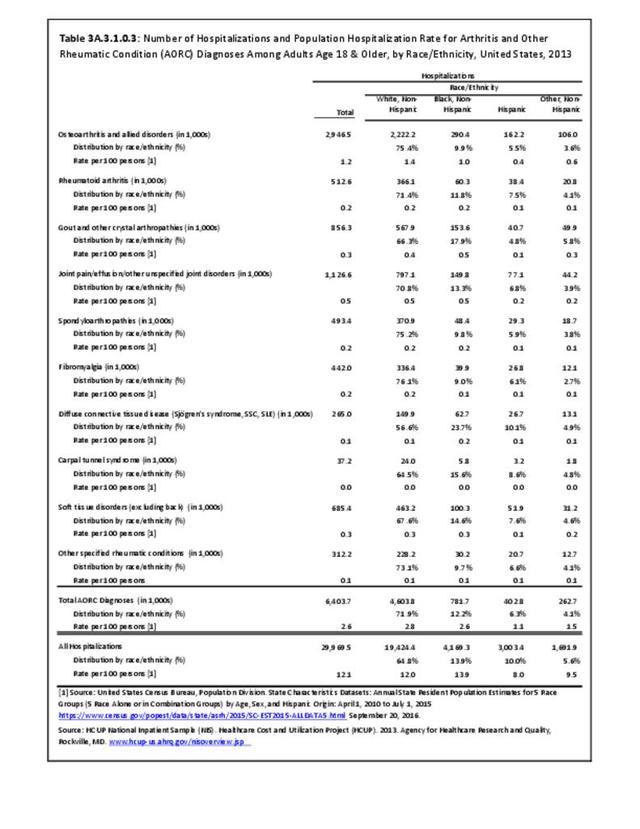
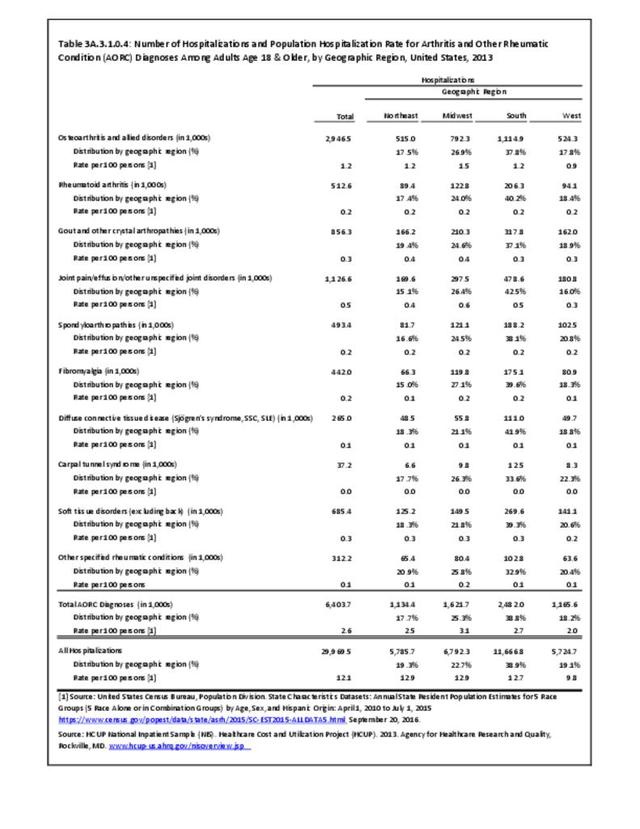
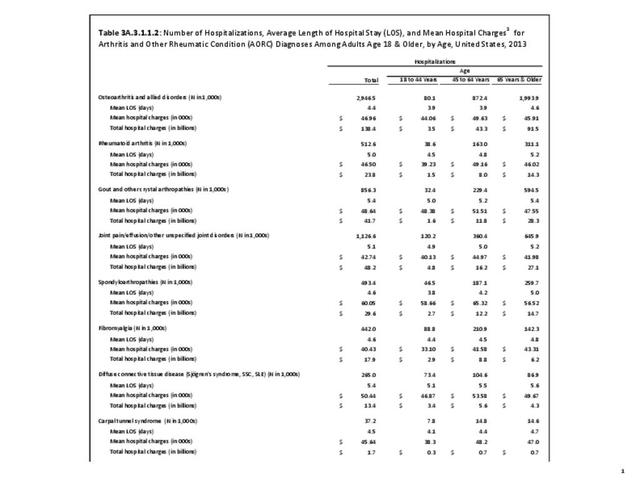
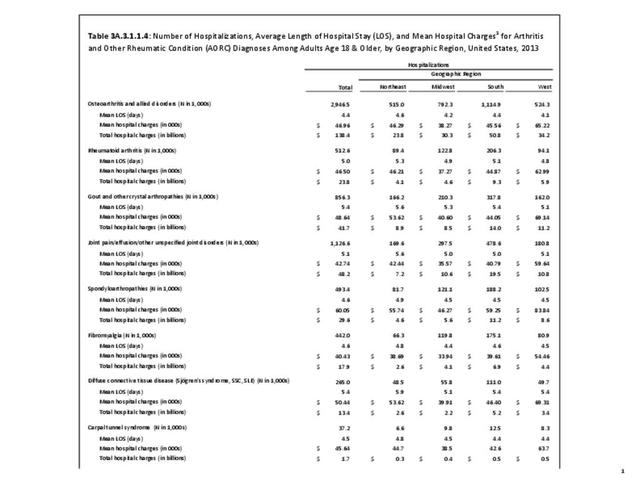
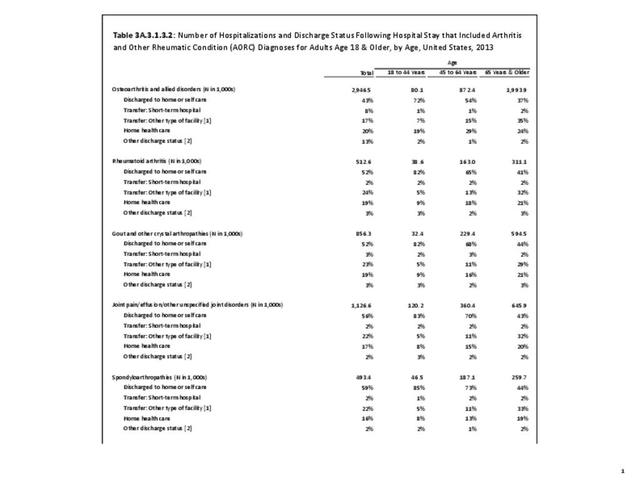
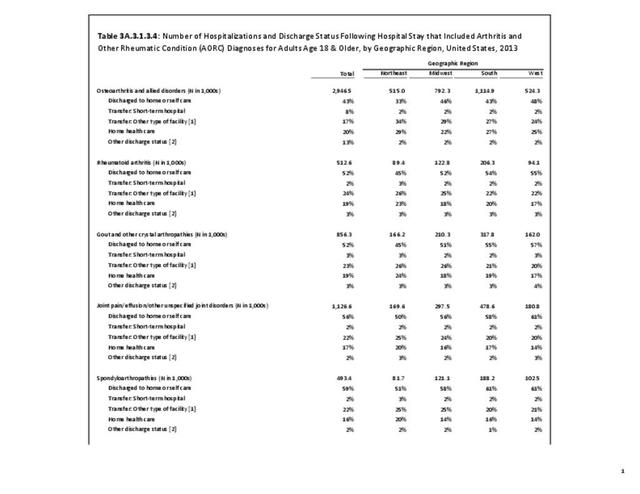
For RA, females outnumbered males three to one. Most RA hospitalizations occurred in those aged 65 years and older at a rate of 0.7 adults in 100 for this age group. No differences in rates were found by race/ethnic or regional group. (Table 3A.3.1.0.1 PDF CSV; Table 3A.3.1.0.2 PDF CSV; Table 3A.3.1.0.3 PDF CSV; Table 3A.3.1.0.4 PDF CSV)
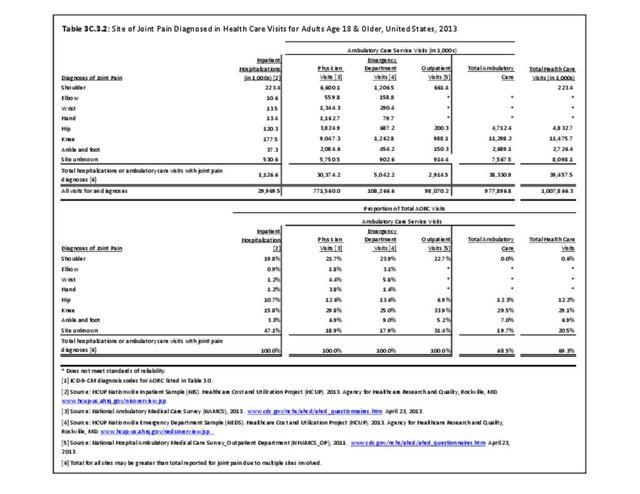
Ambulatory Care Visits
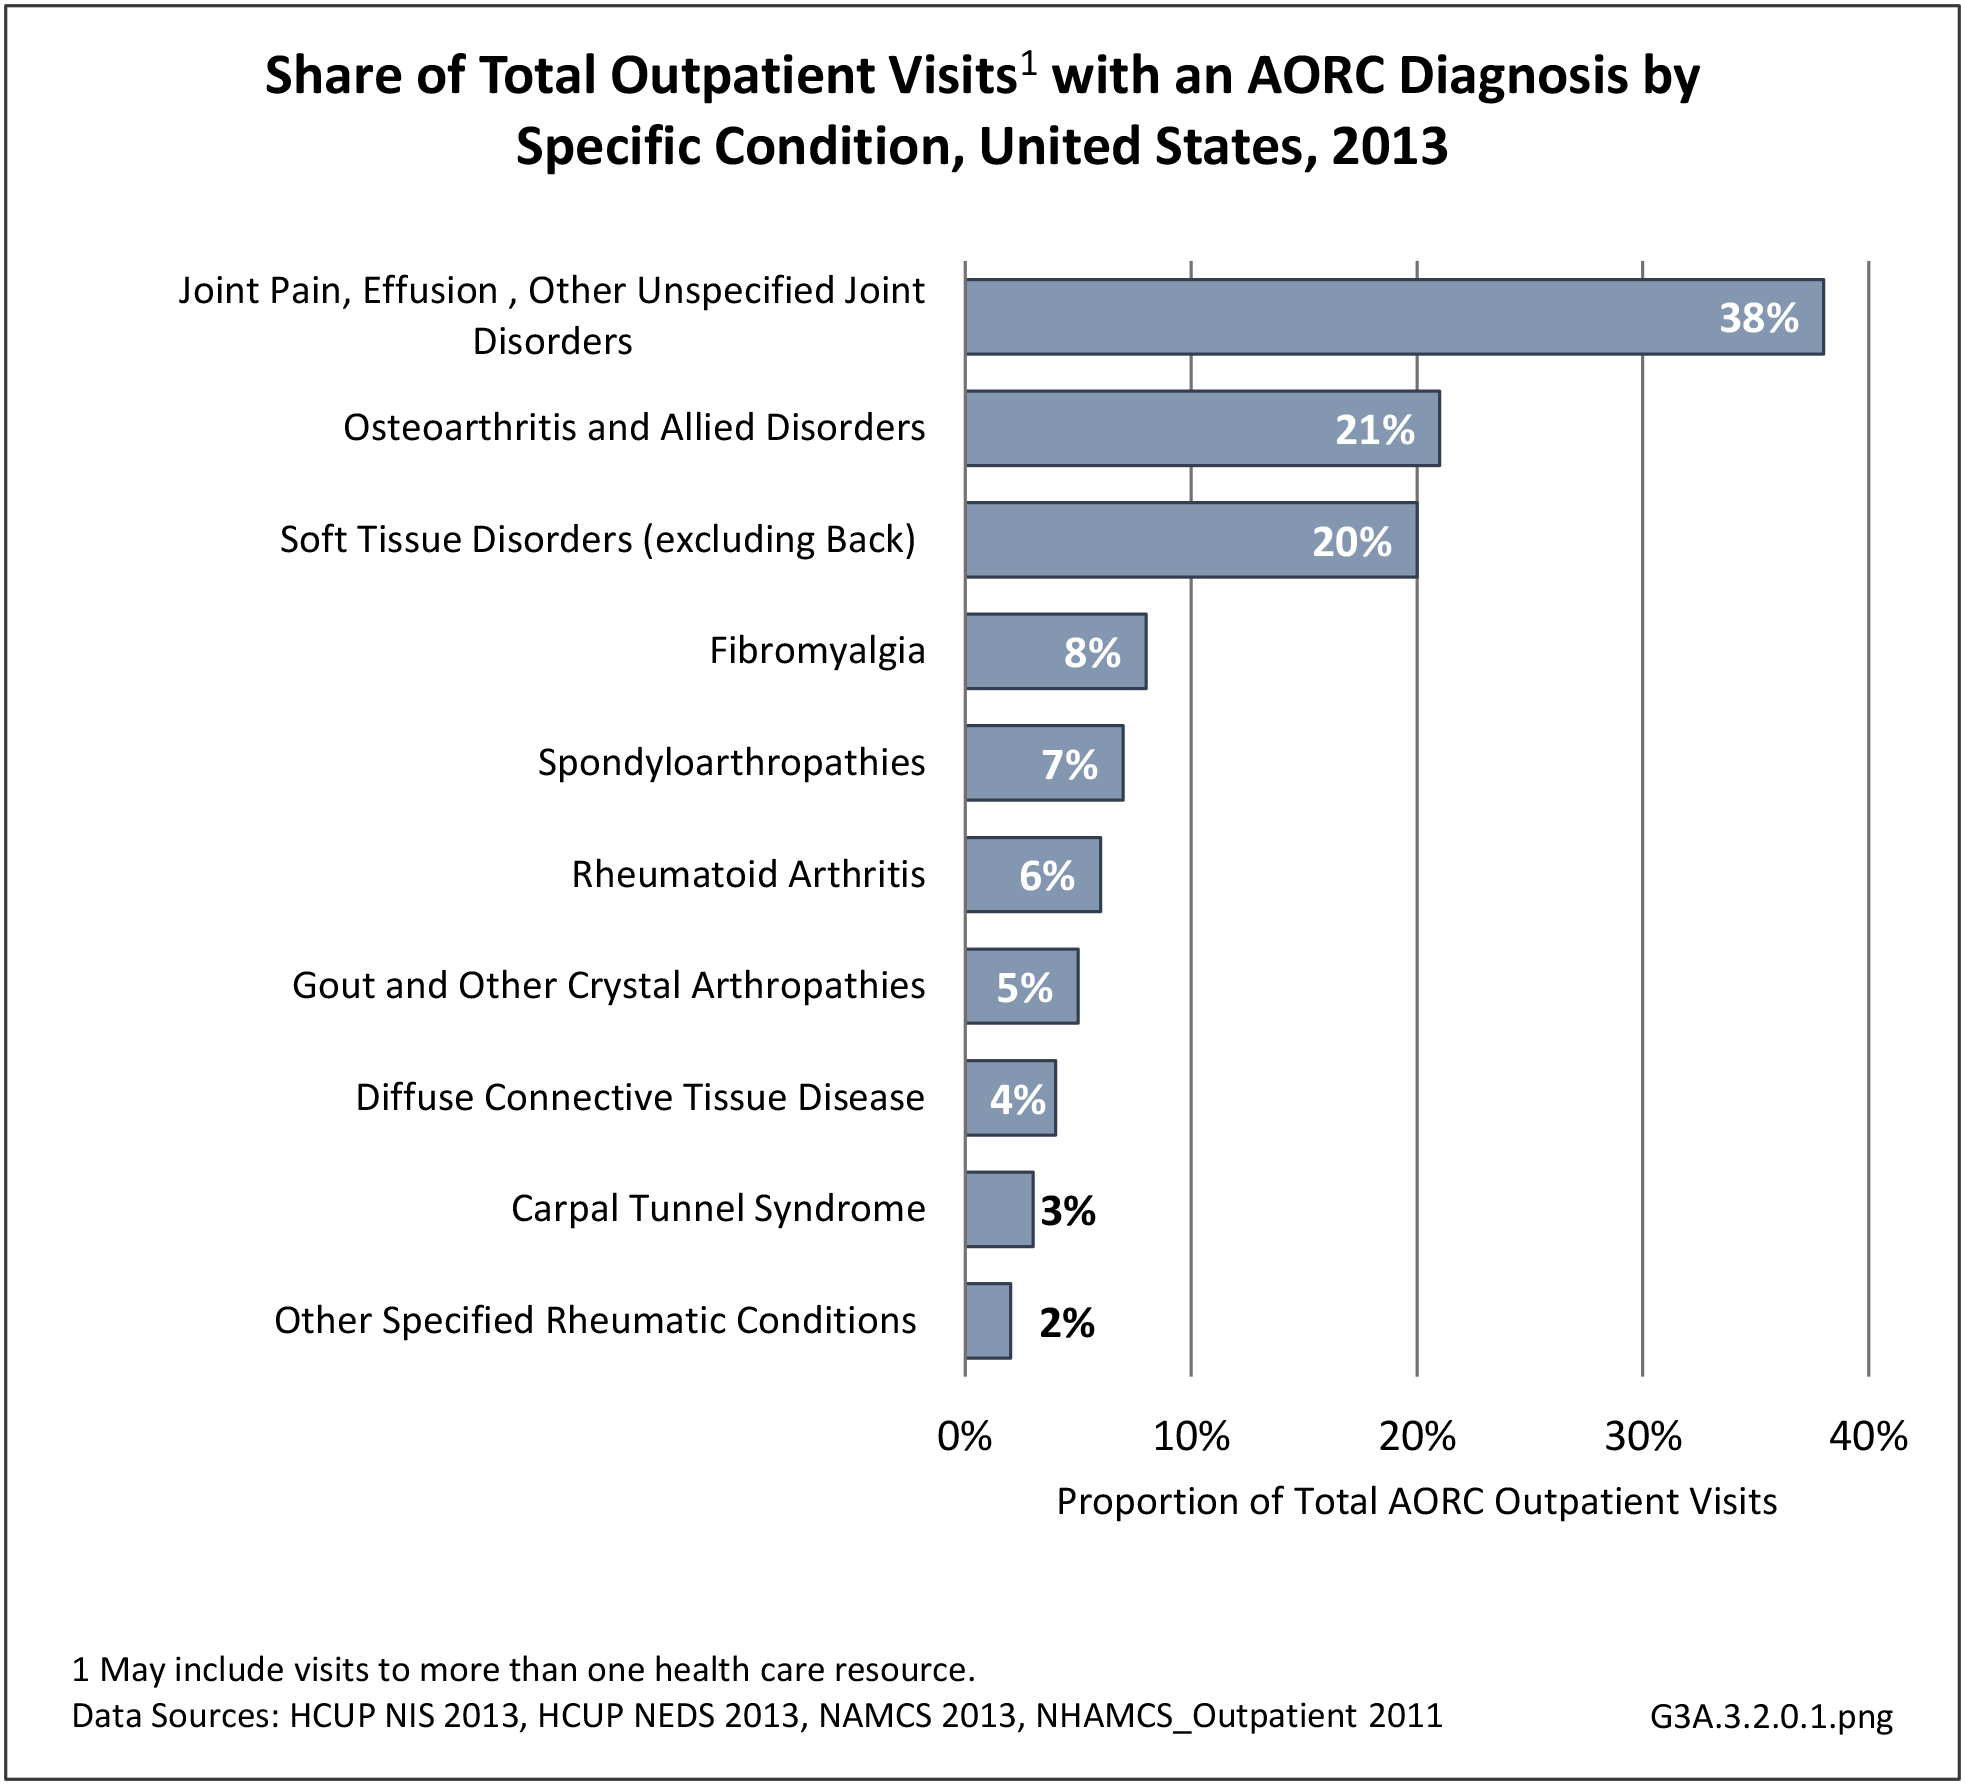
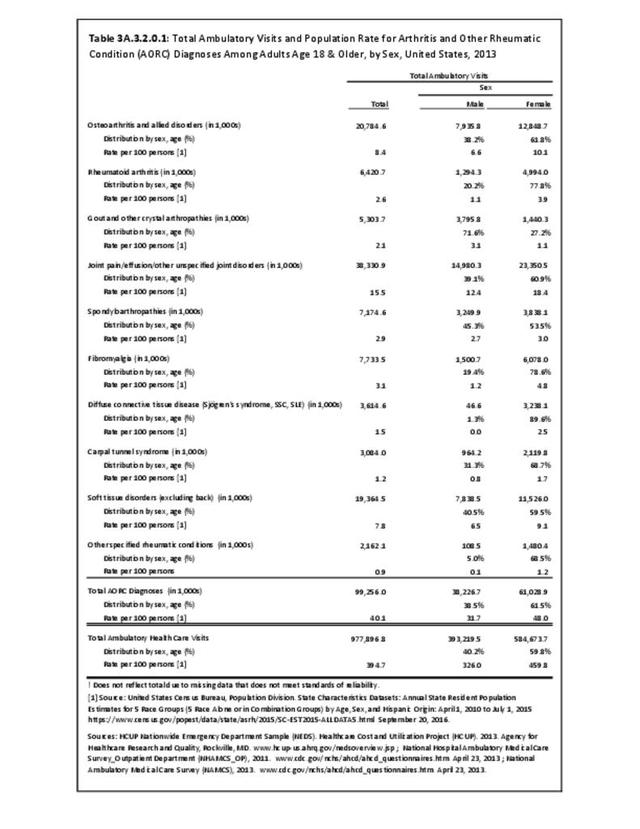
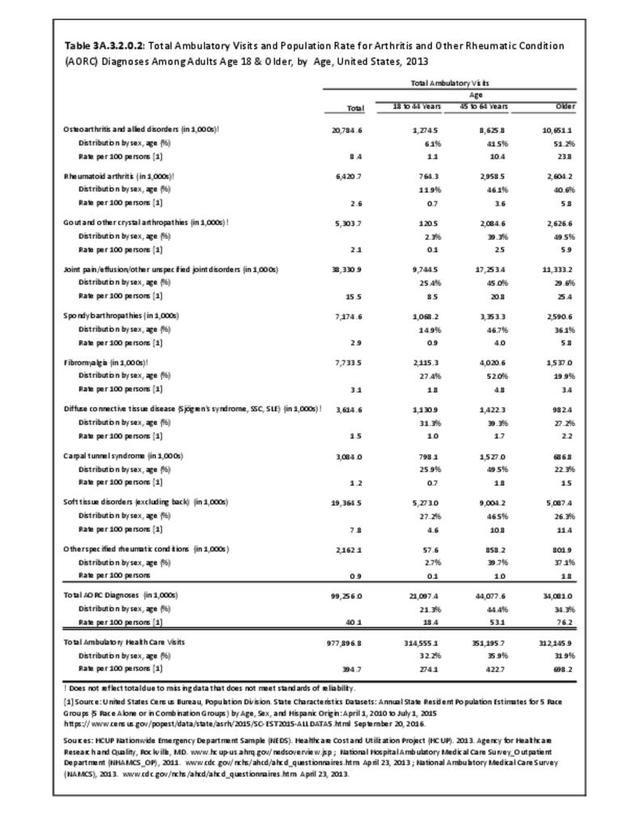
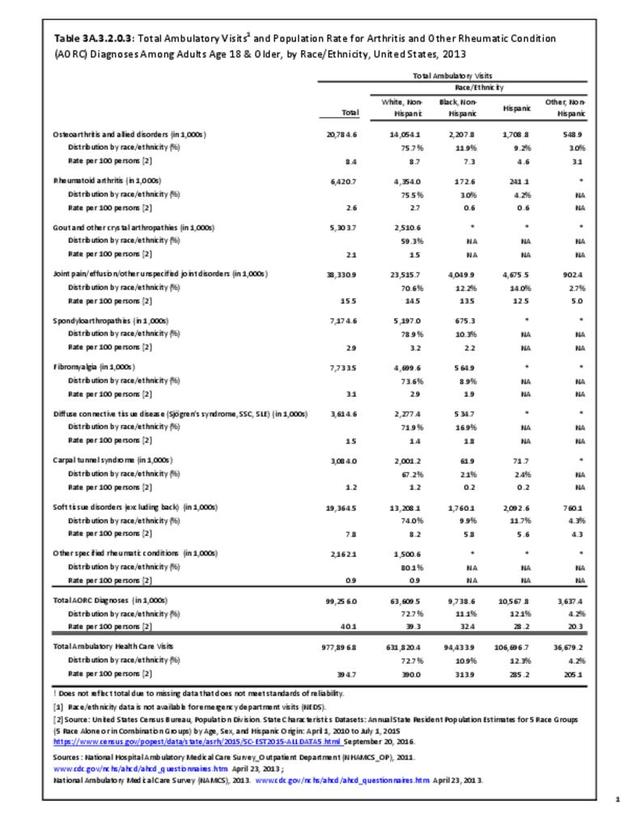
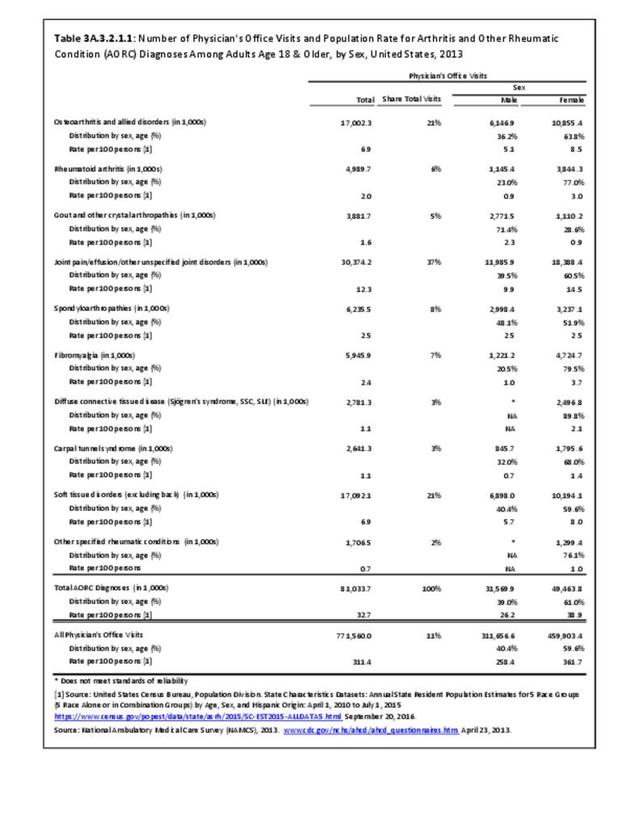
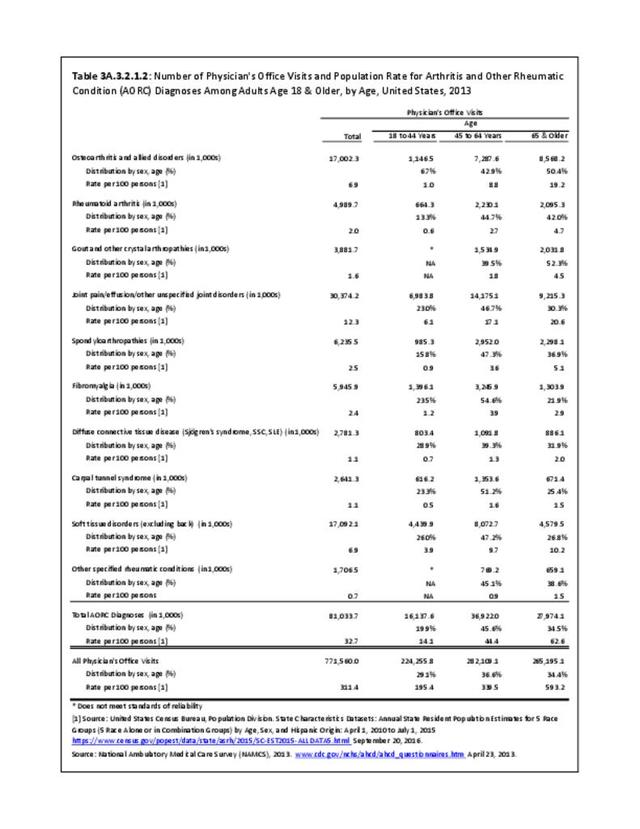
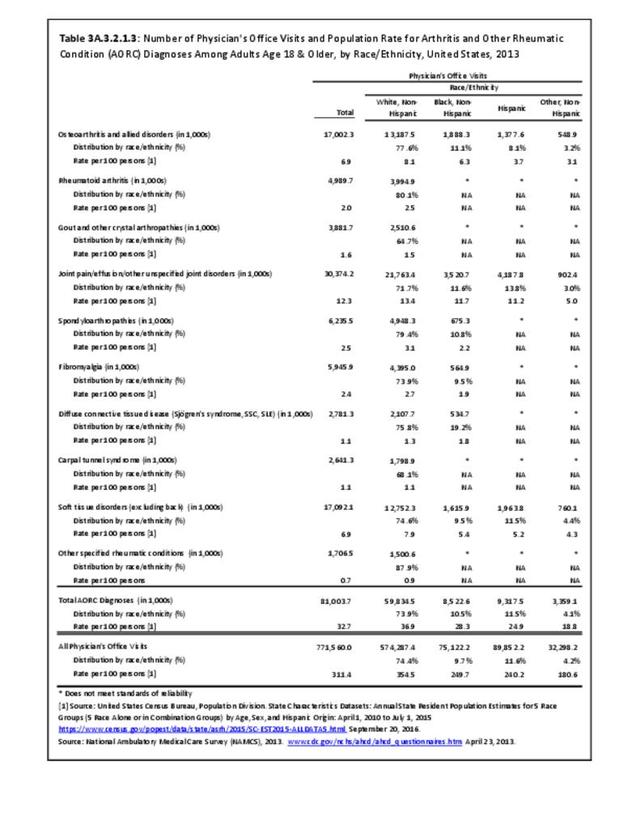
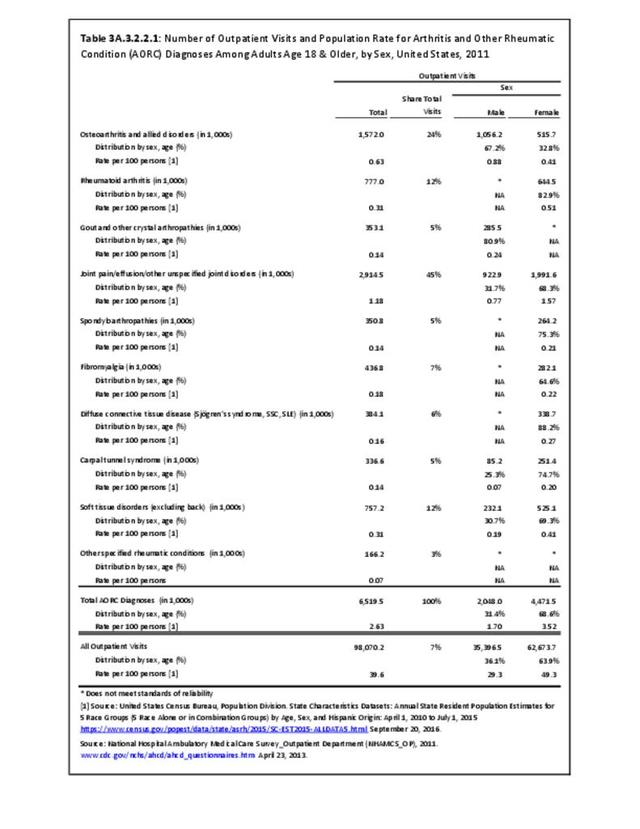
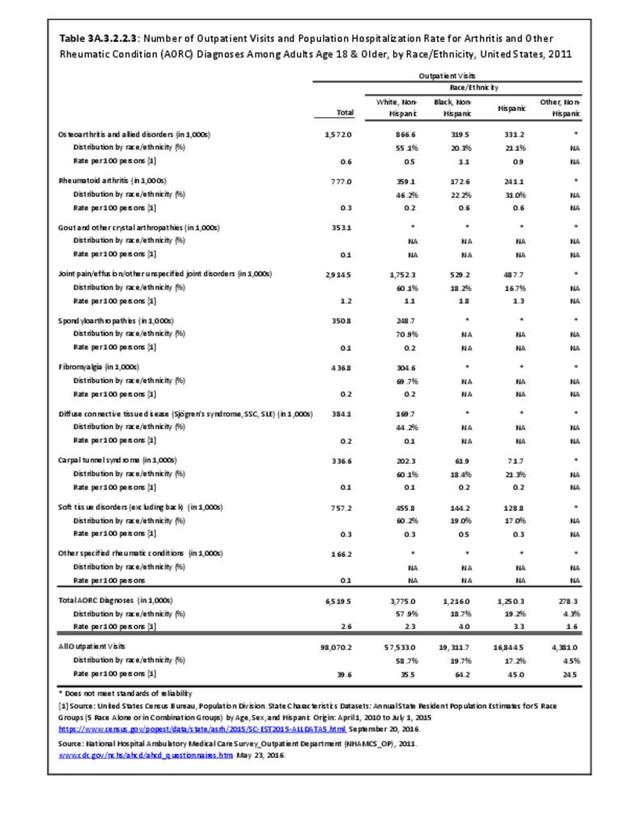
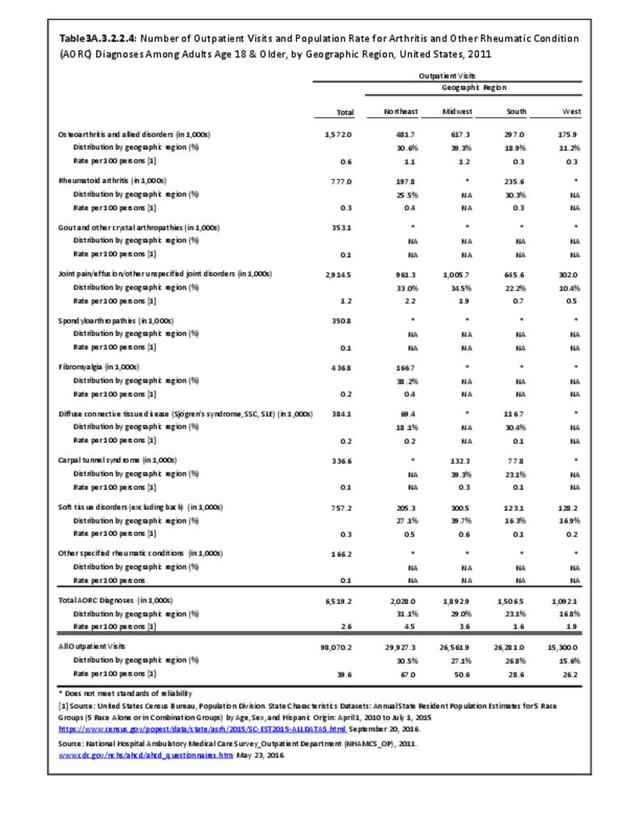
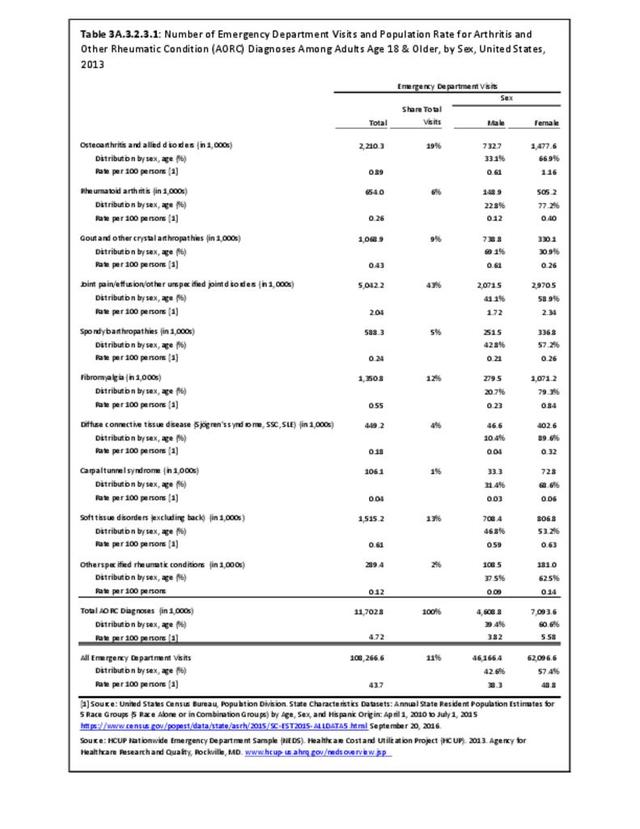
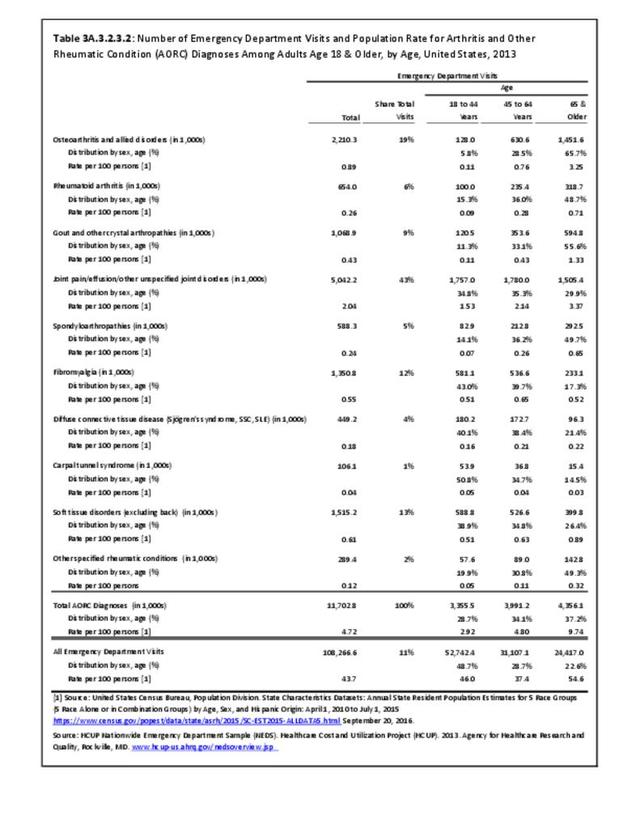
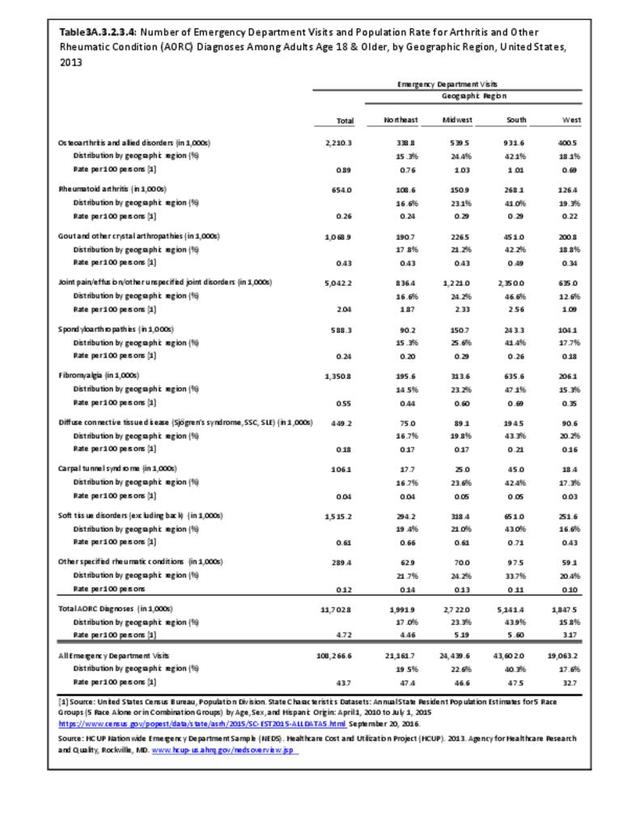
Rheumatoid arthritis was diagnosed in 6.4 million ambulatory visits and accounted for 0.7% of ambulatory care visits with an arthritis diagnosis, compared with the 0.5% prevalence rate in the US population. An RA diagnosis was made in 0.6% of physician office visits and ER visits; 0.8% of outpatient visits had a RA diagnosis. (Reference Table 3A.3.2.0.1 PDF CSV; Reference Table 3A.3.2.1.1 PDF CSV; Table 3A.3.2.2.1 PDF CSV; and Table 3A.3.2.3.1 PDF CSV)
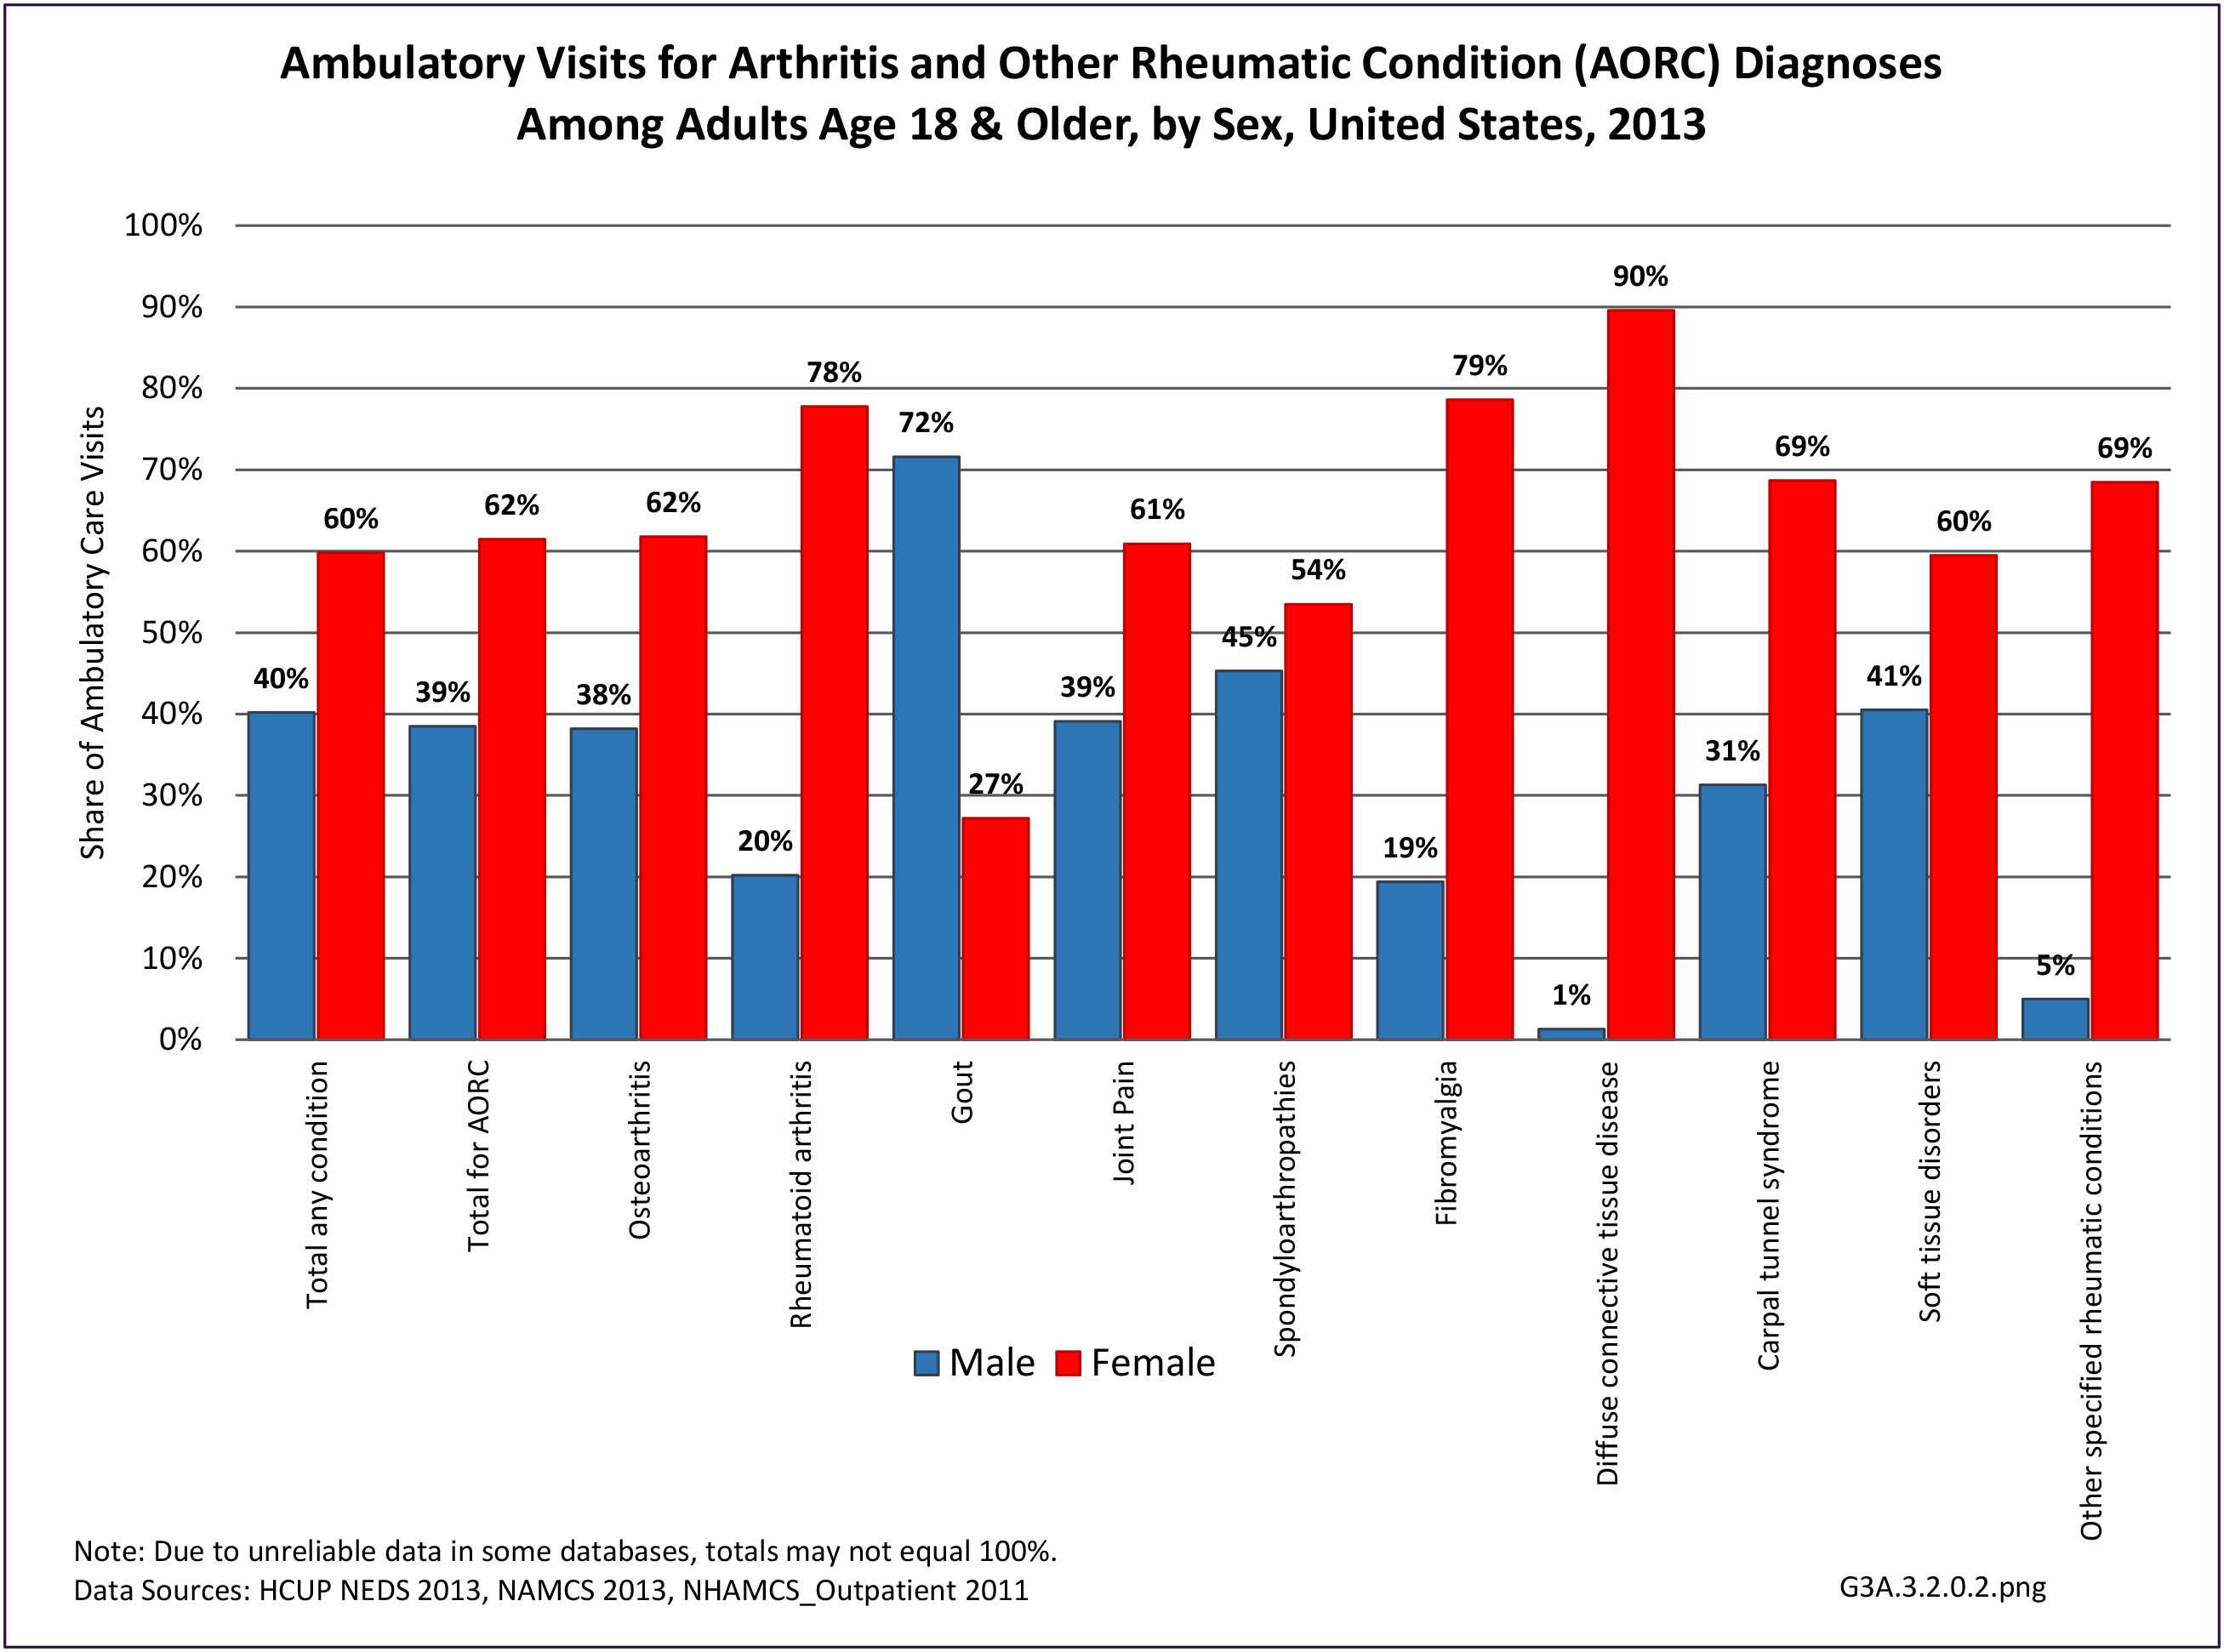
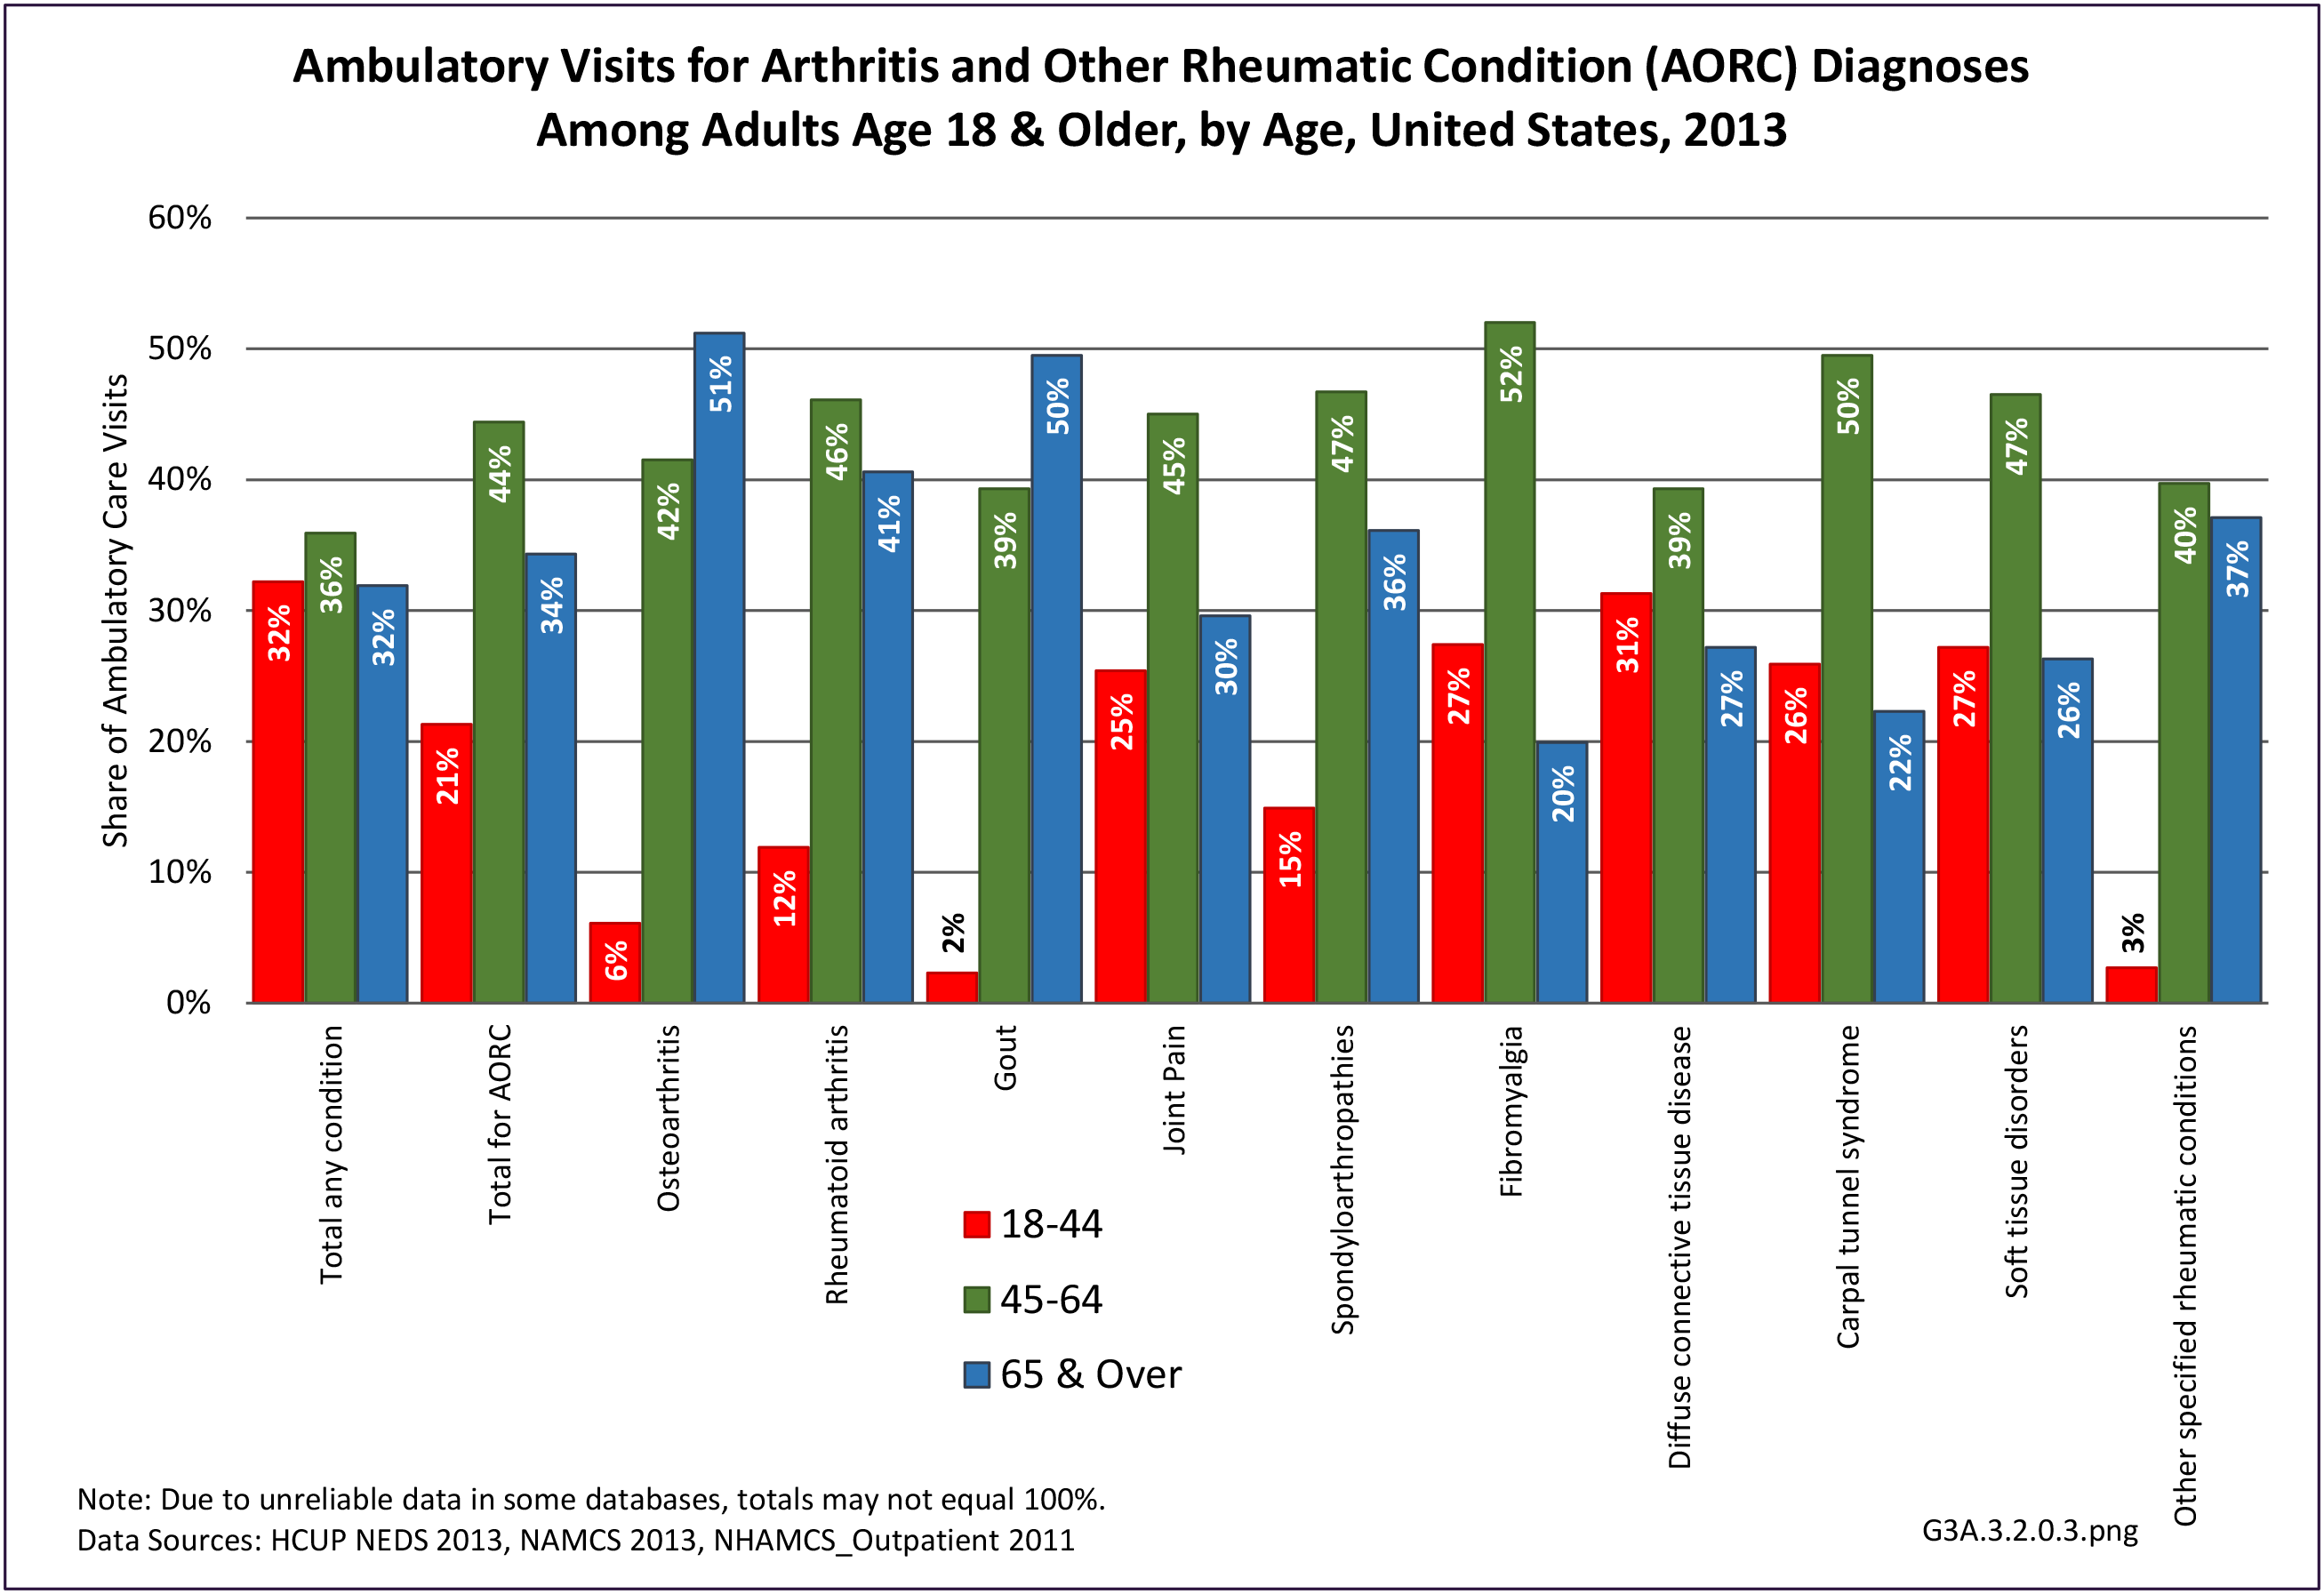
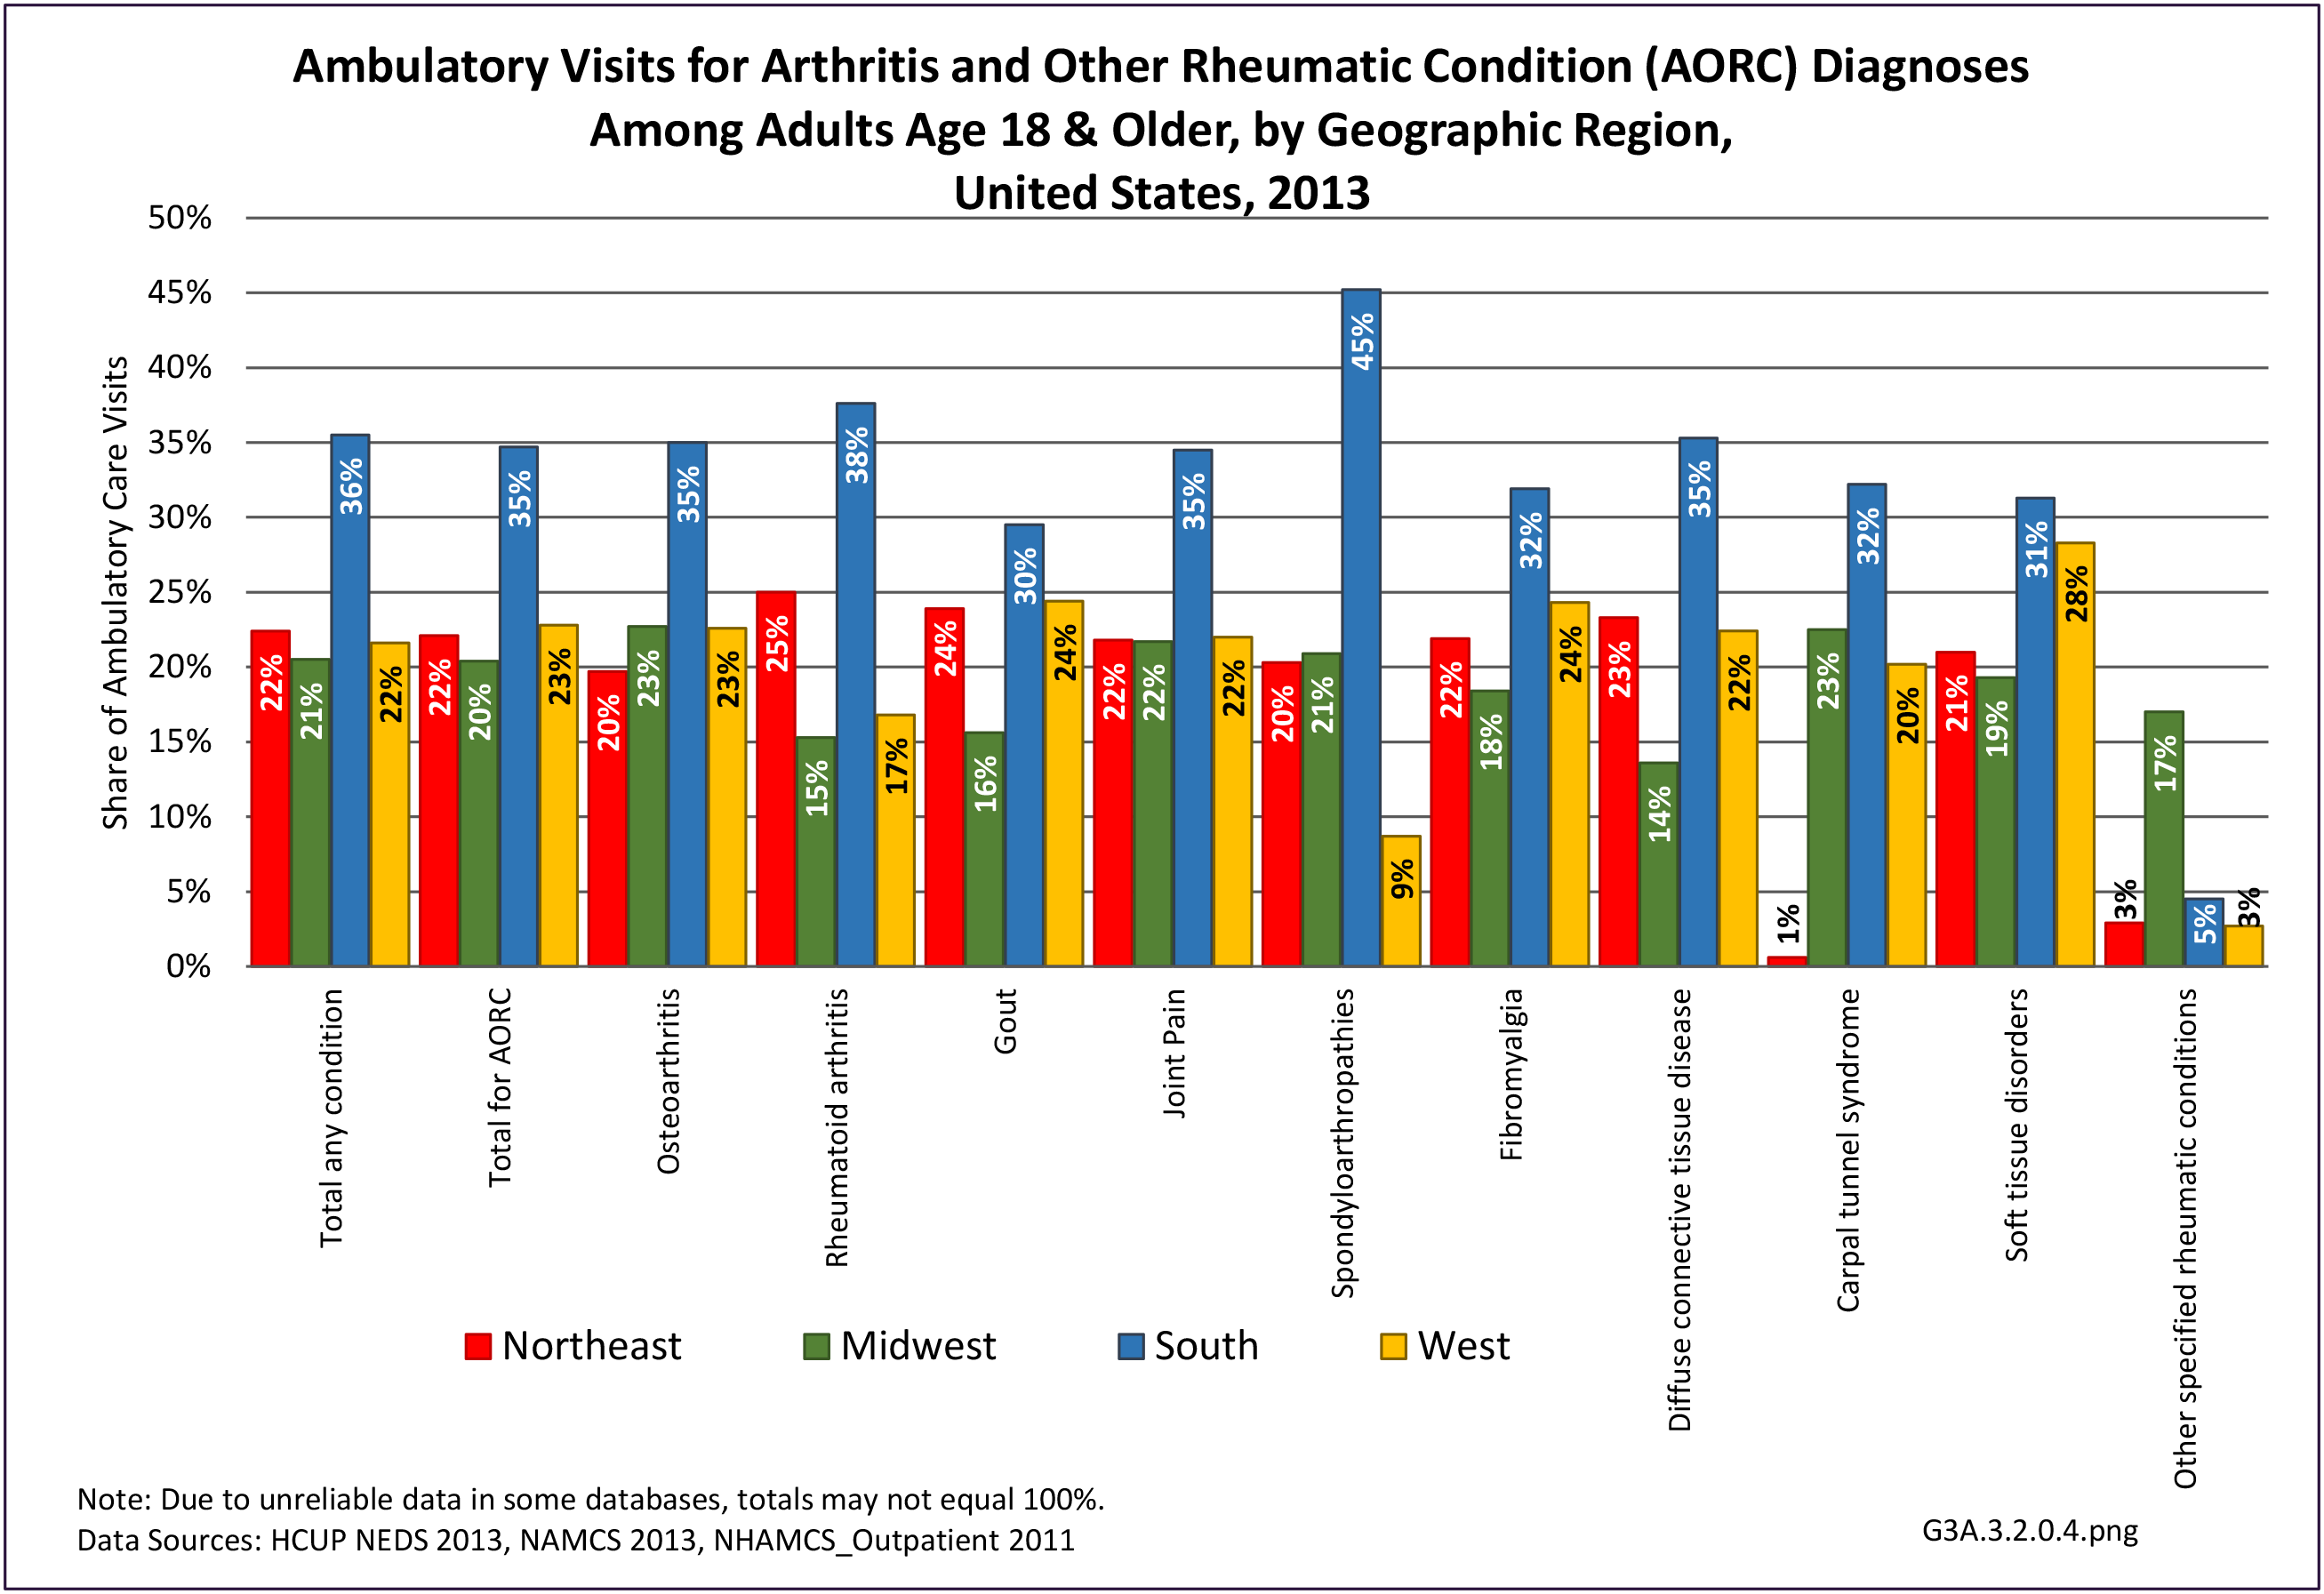
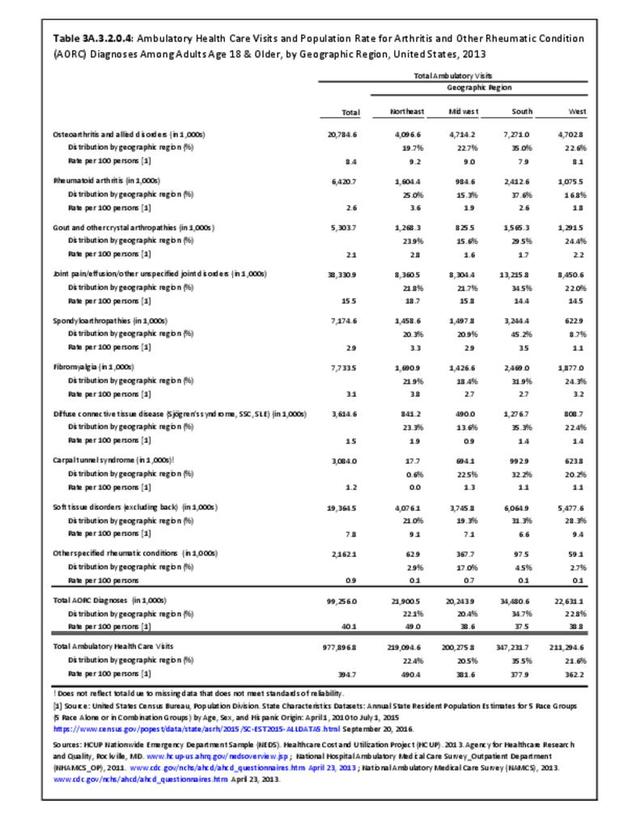
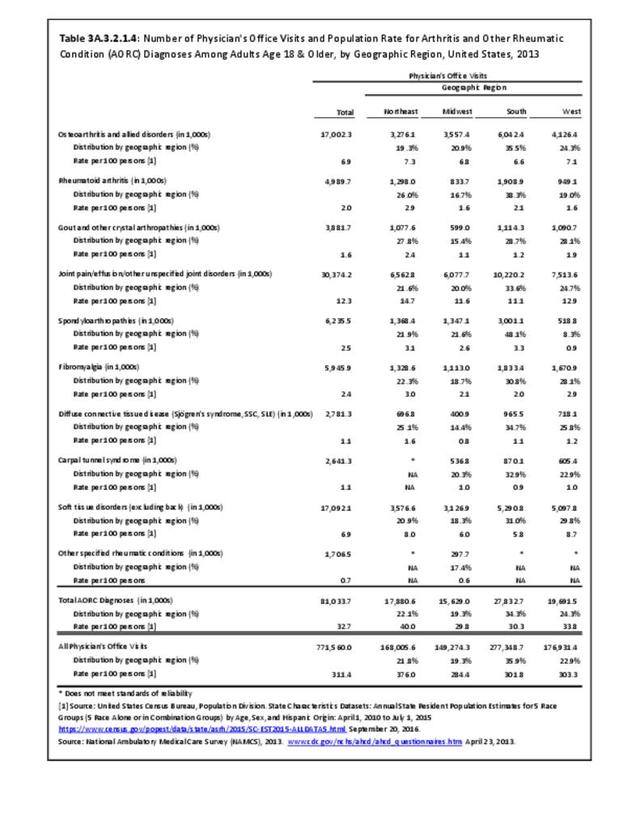
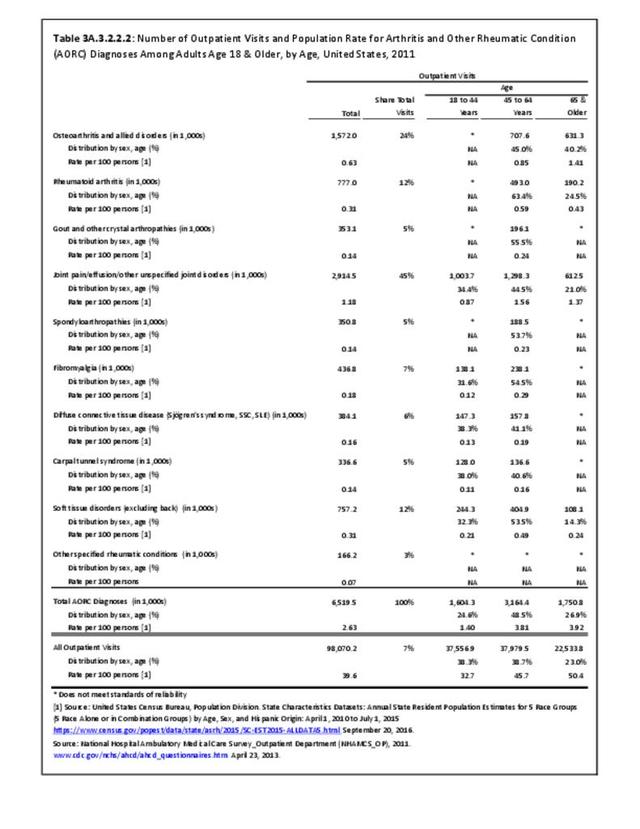
The distribution of ambulatory care visits by select demographic characteristics, when compared to all ambulatory visits for RA, was highest among females, and lowest among those younger than age 44 and among Black non-Hispanic and Hispanic racial/ethnic groups. (Reference Table 3A.3.2.0.1 PDF CSV; Table 3A.3.2.0.2 PDF CSV; Table 3A.3.2.0.3 PDF CSV; Table 3A.3.2.0.4 PDF CSV)

Economic Burden
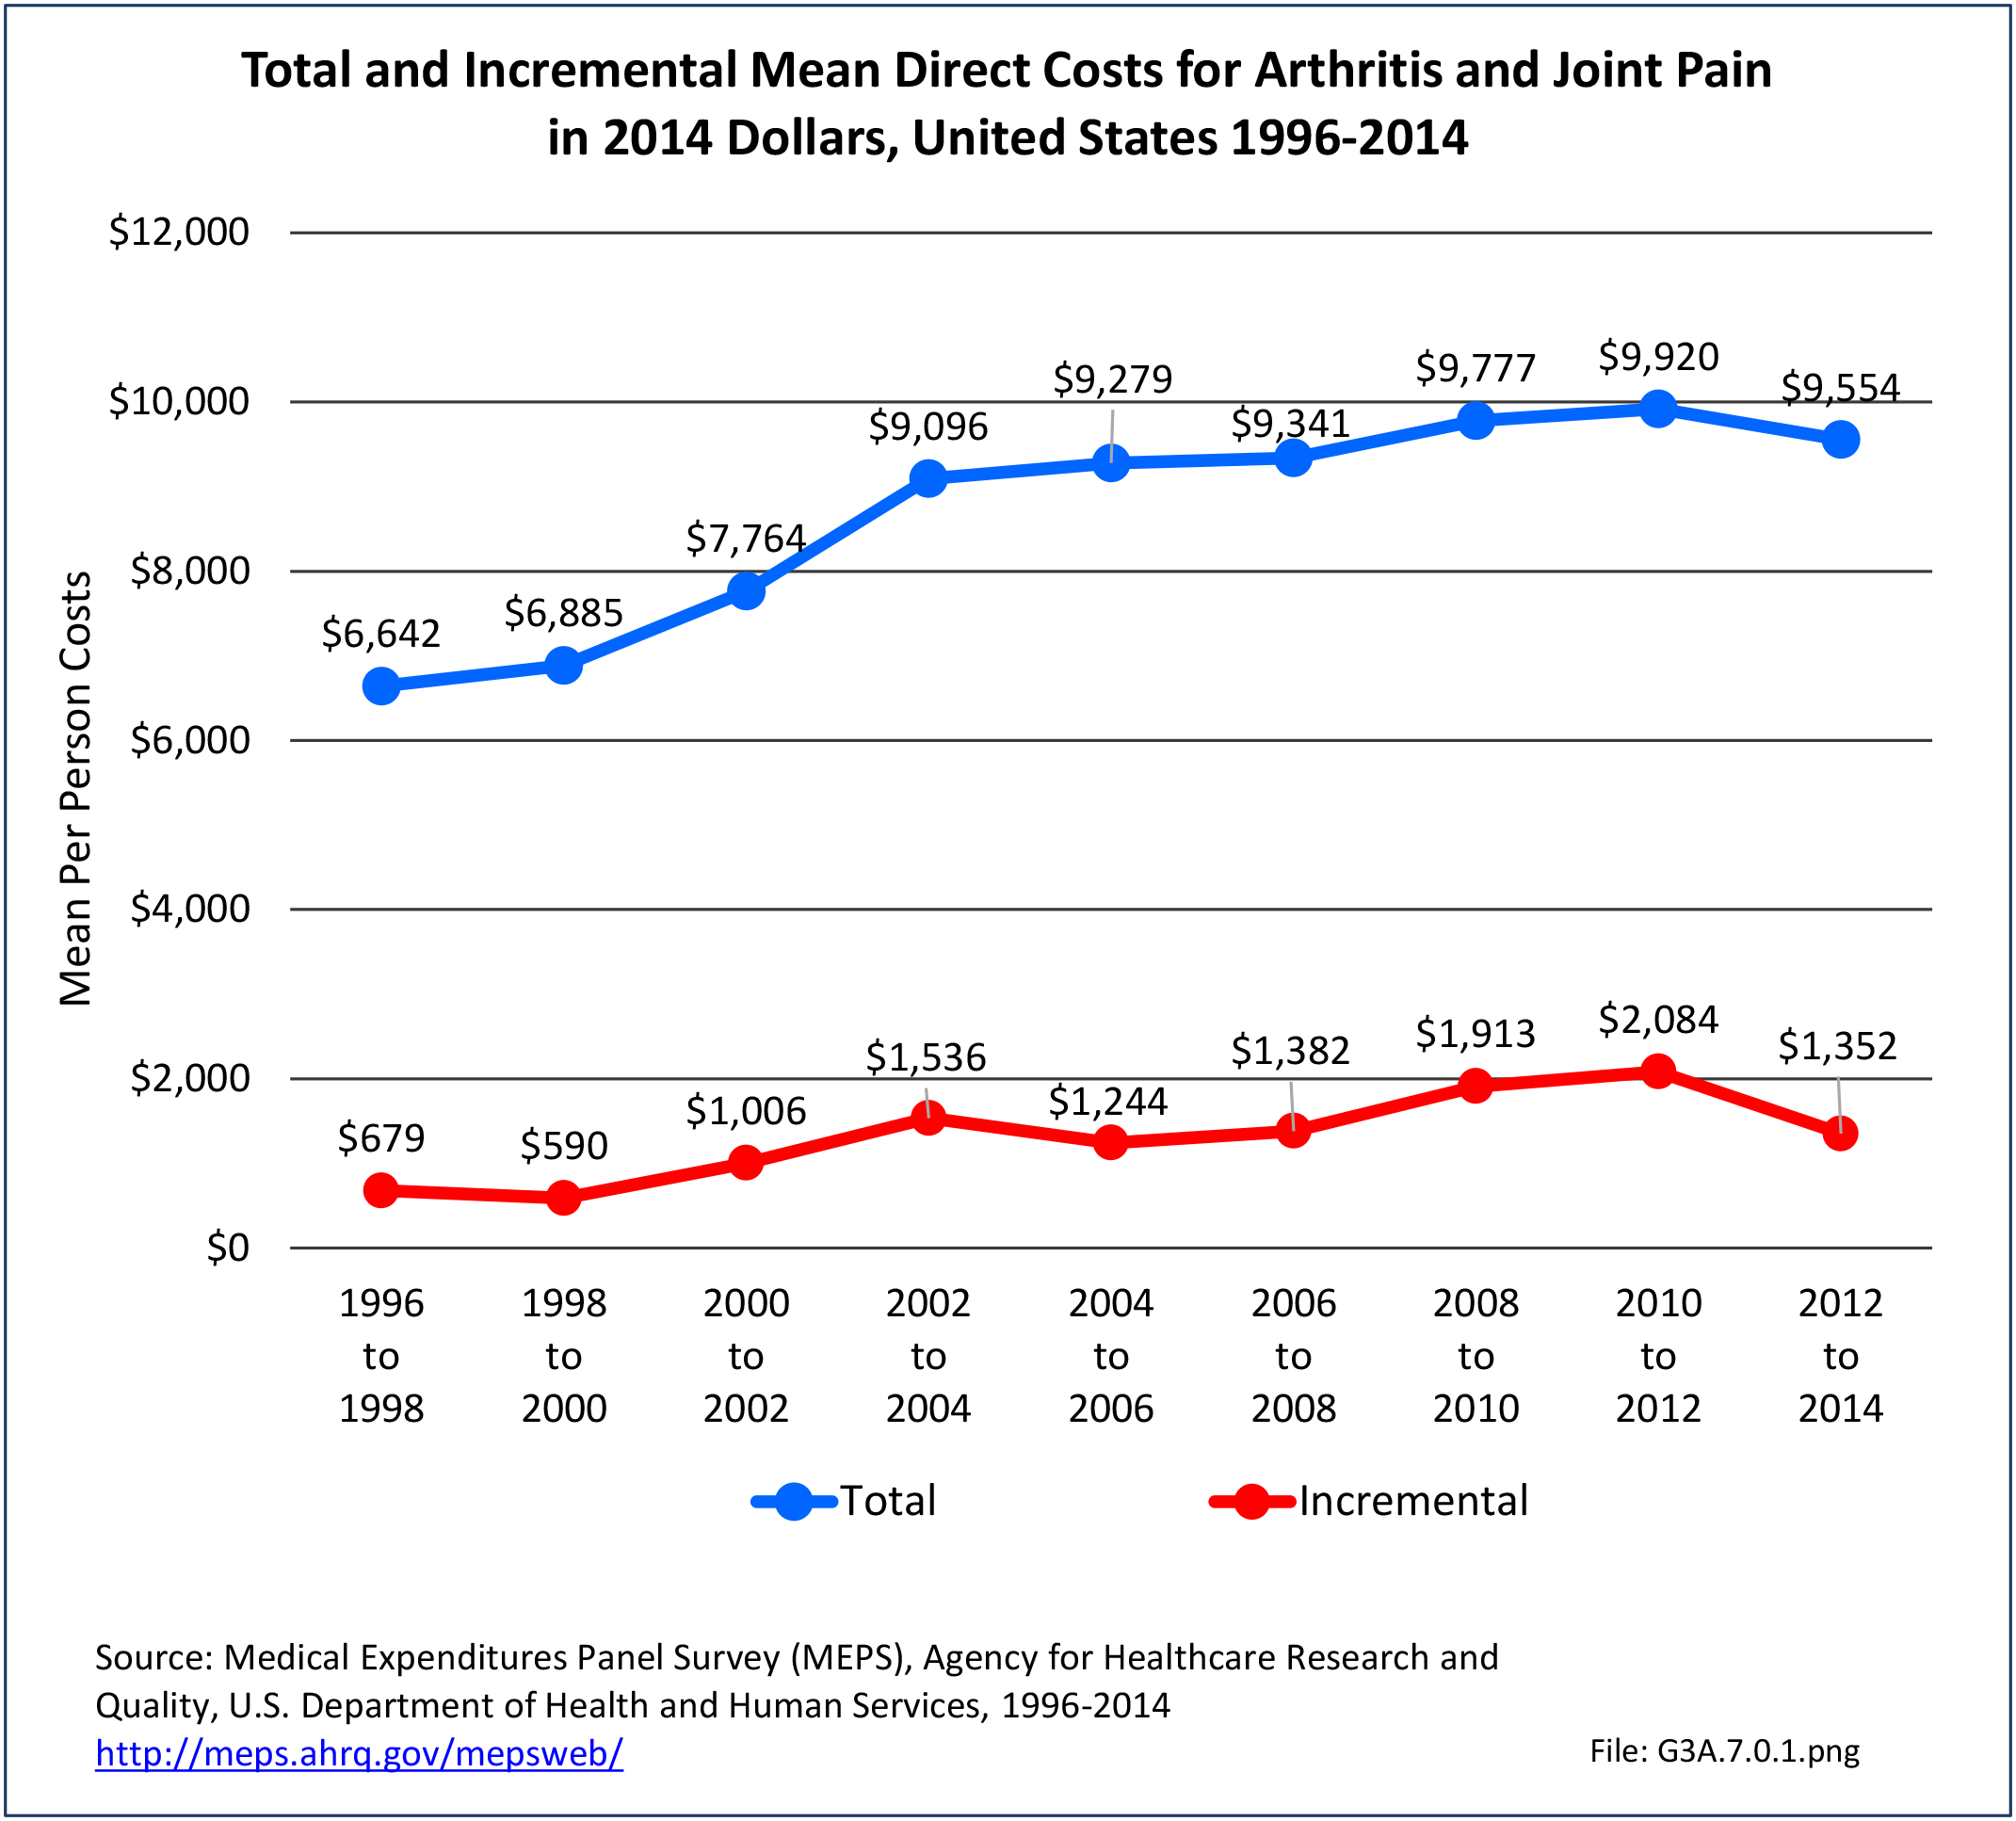
Estimates were calculated from 2008-2012 Medical Expenditures Panel Survey (MEPS) data; analysis was limited to those years because the ICD-9-CM code for RA was suppressed in the 2013 and 2014 MEPS data. MEPS respondents were classified as having RA if they met the following criteria: had a record with ICD-9-CM code 714, self-reported having ever been diagnosed with RA, and had at least five prescriptions or ambulatory care visits for RA. In the 2008–2012 period, each year, an estimated 1.7 million adults (0.8% of US adult population) had RA. Although slightly higher than the 1.3 million to 1.5 million previously cited by other sources, the numbers provide a similar rate of RA in the adult population.
Combining direct and indirect costs for RA, total average costs annually for the years 2008-2014 were $46 billion, with incremental costs, those costs directly associated with RA, of $21.6 billion. (Reference Table 8.13 PDF CSV)
Direct Costs
Annual average per person all-cause (diagnosis of RA along with other health condition diagnoses) medical expenditures for RA were $19,040. Across selected characteristics, the five groups with the highest all-cause per person costs were those who were college graduates ($25,526); had any limitation in work, housework, or school activities ($25,220); lived in the Northeast ($24,038); Hispanics ($22,871), and those with any limitation in IADLS, ADLs, functioning, work, housework, school, vision or hearing ($21,858). Lowest per person costs were among the uninsured ($8,674) and across the remaining subgroups, average per person costs were at least $14,387.
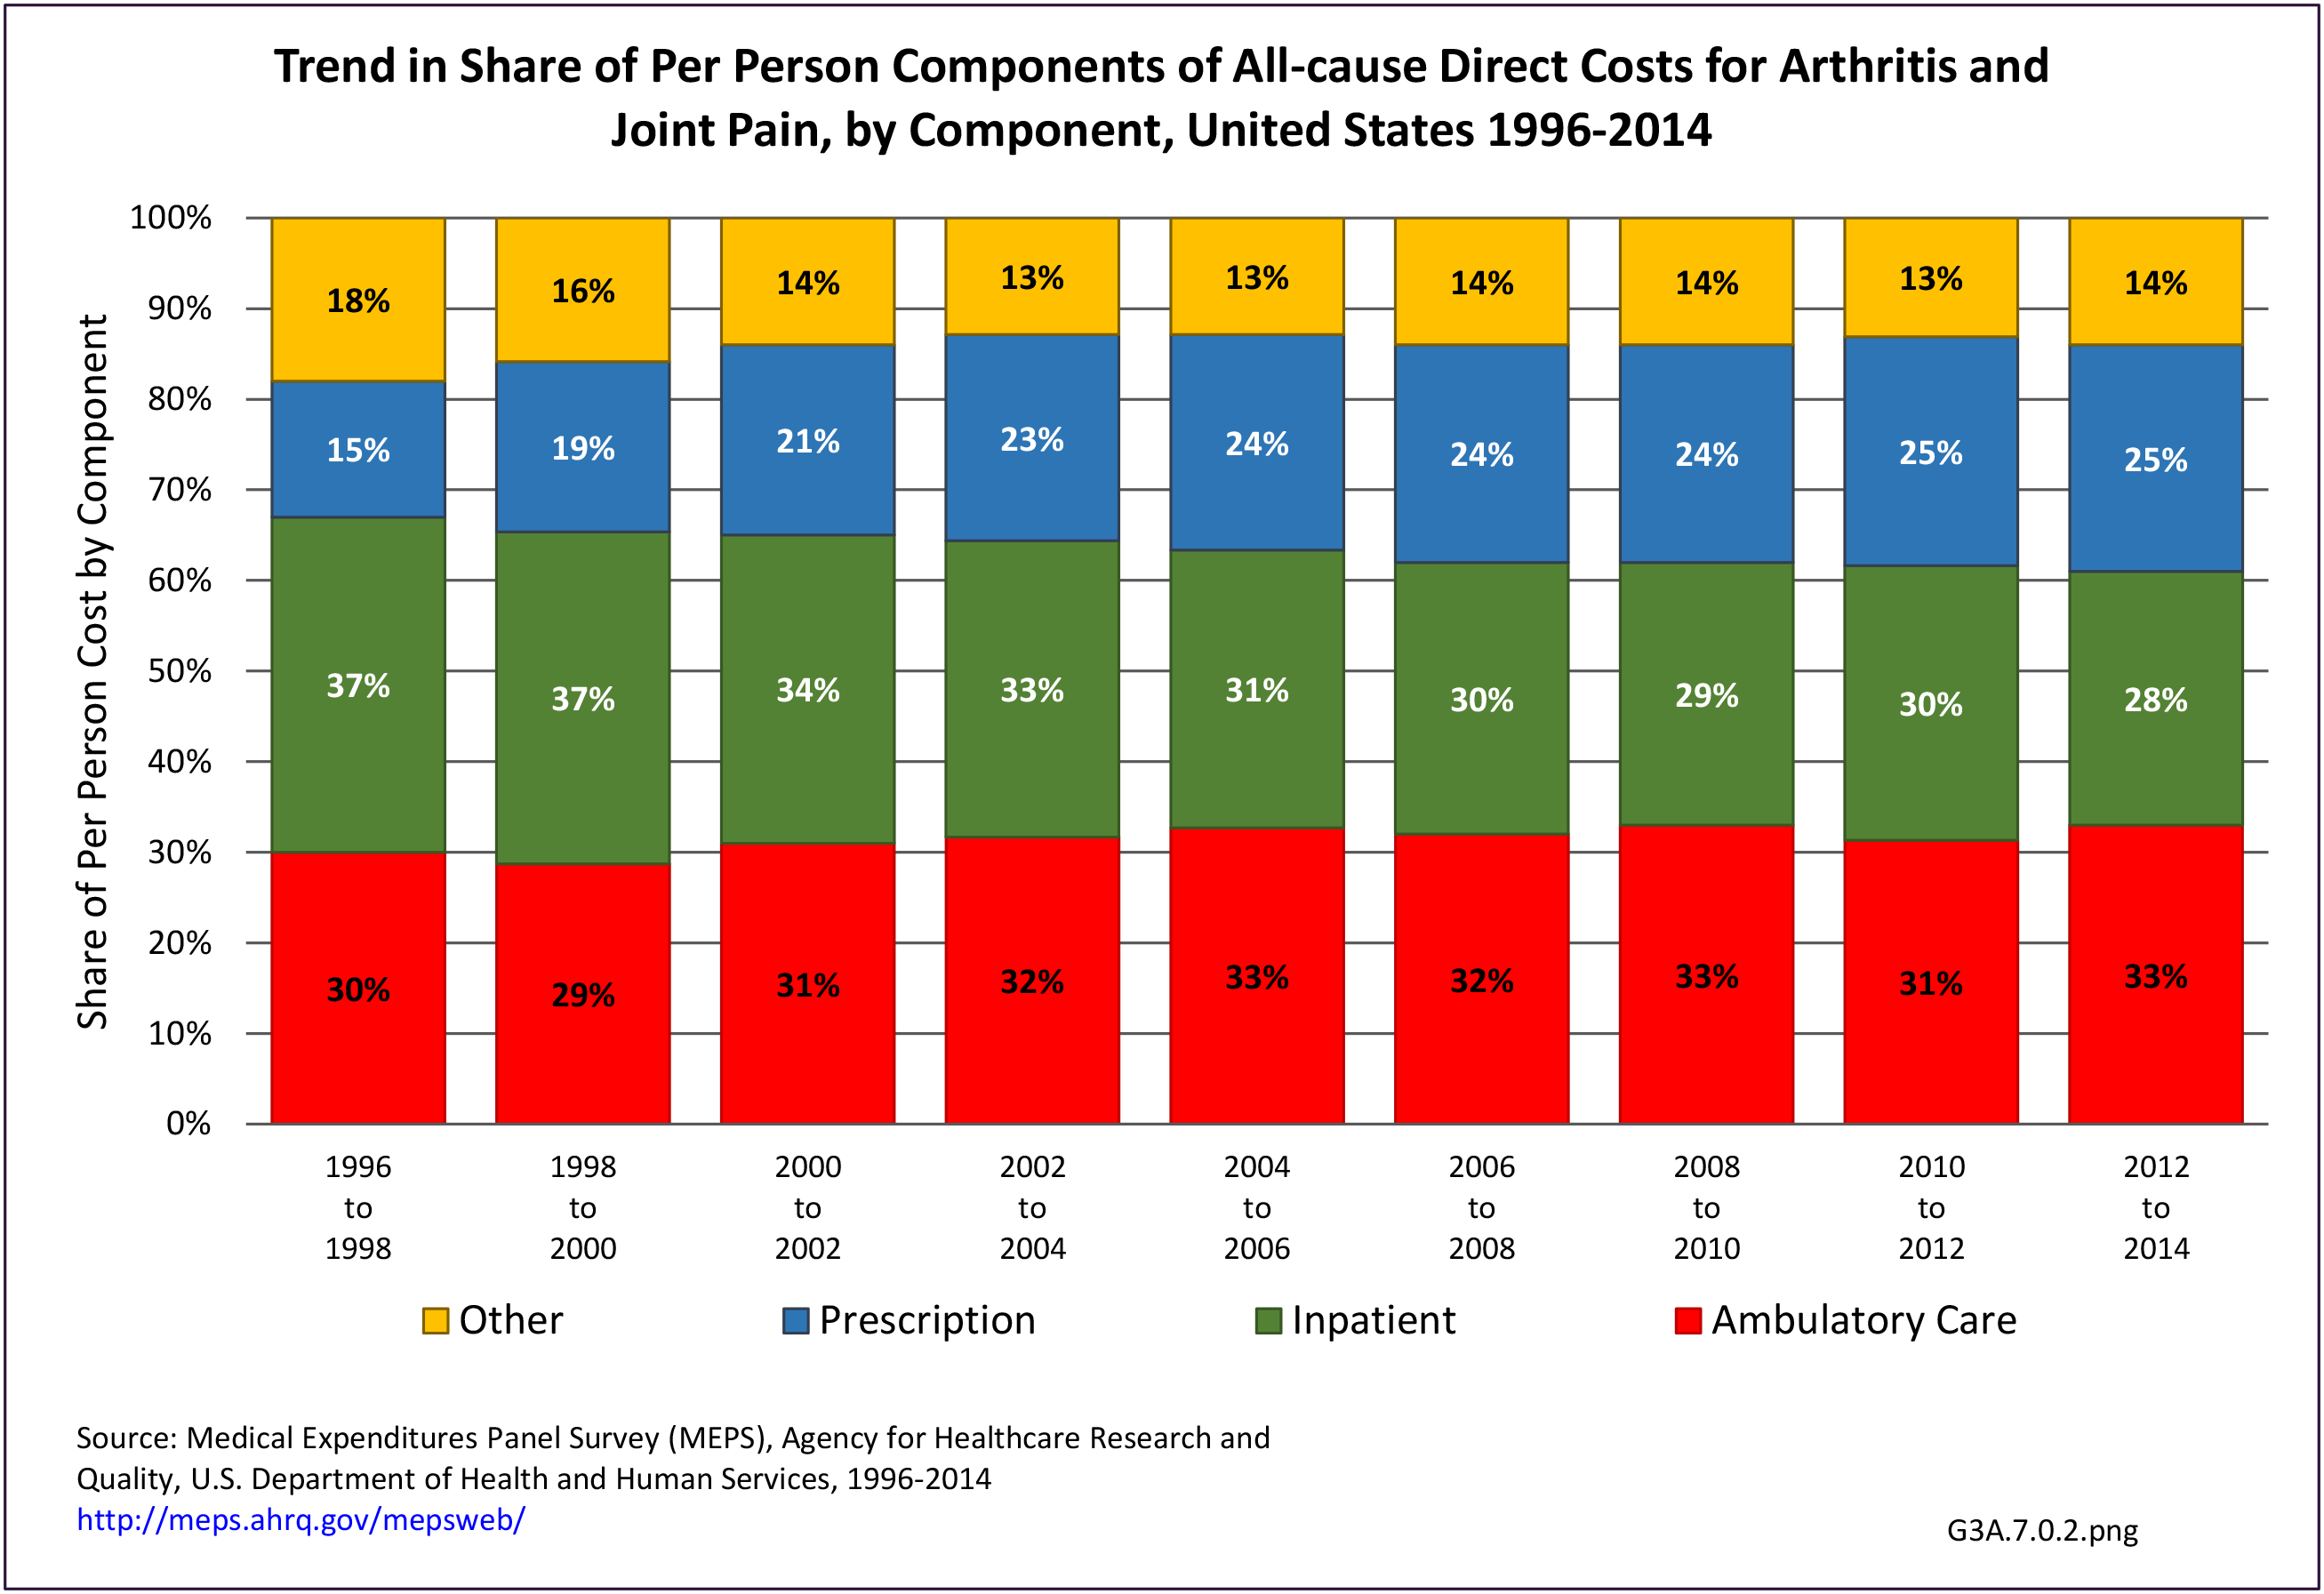
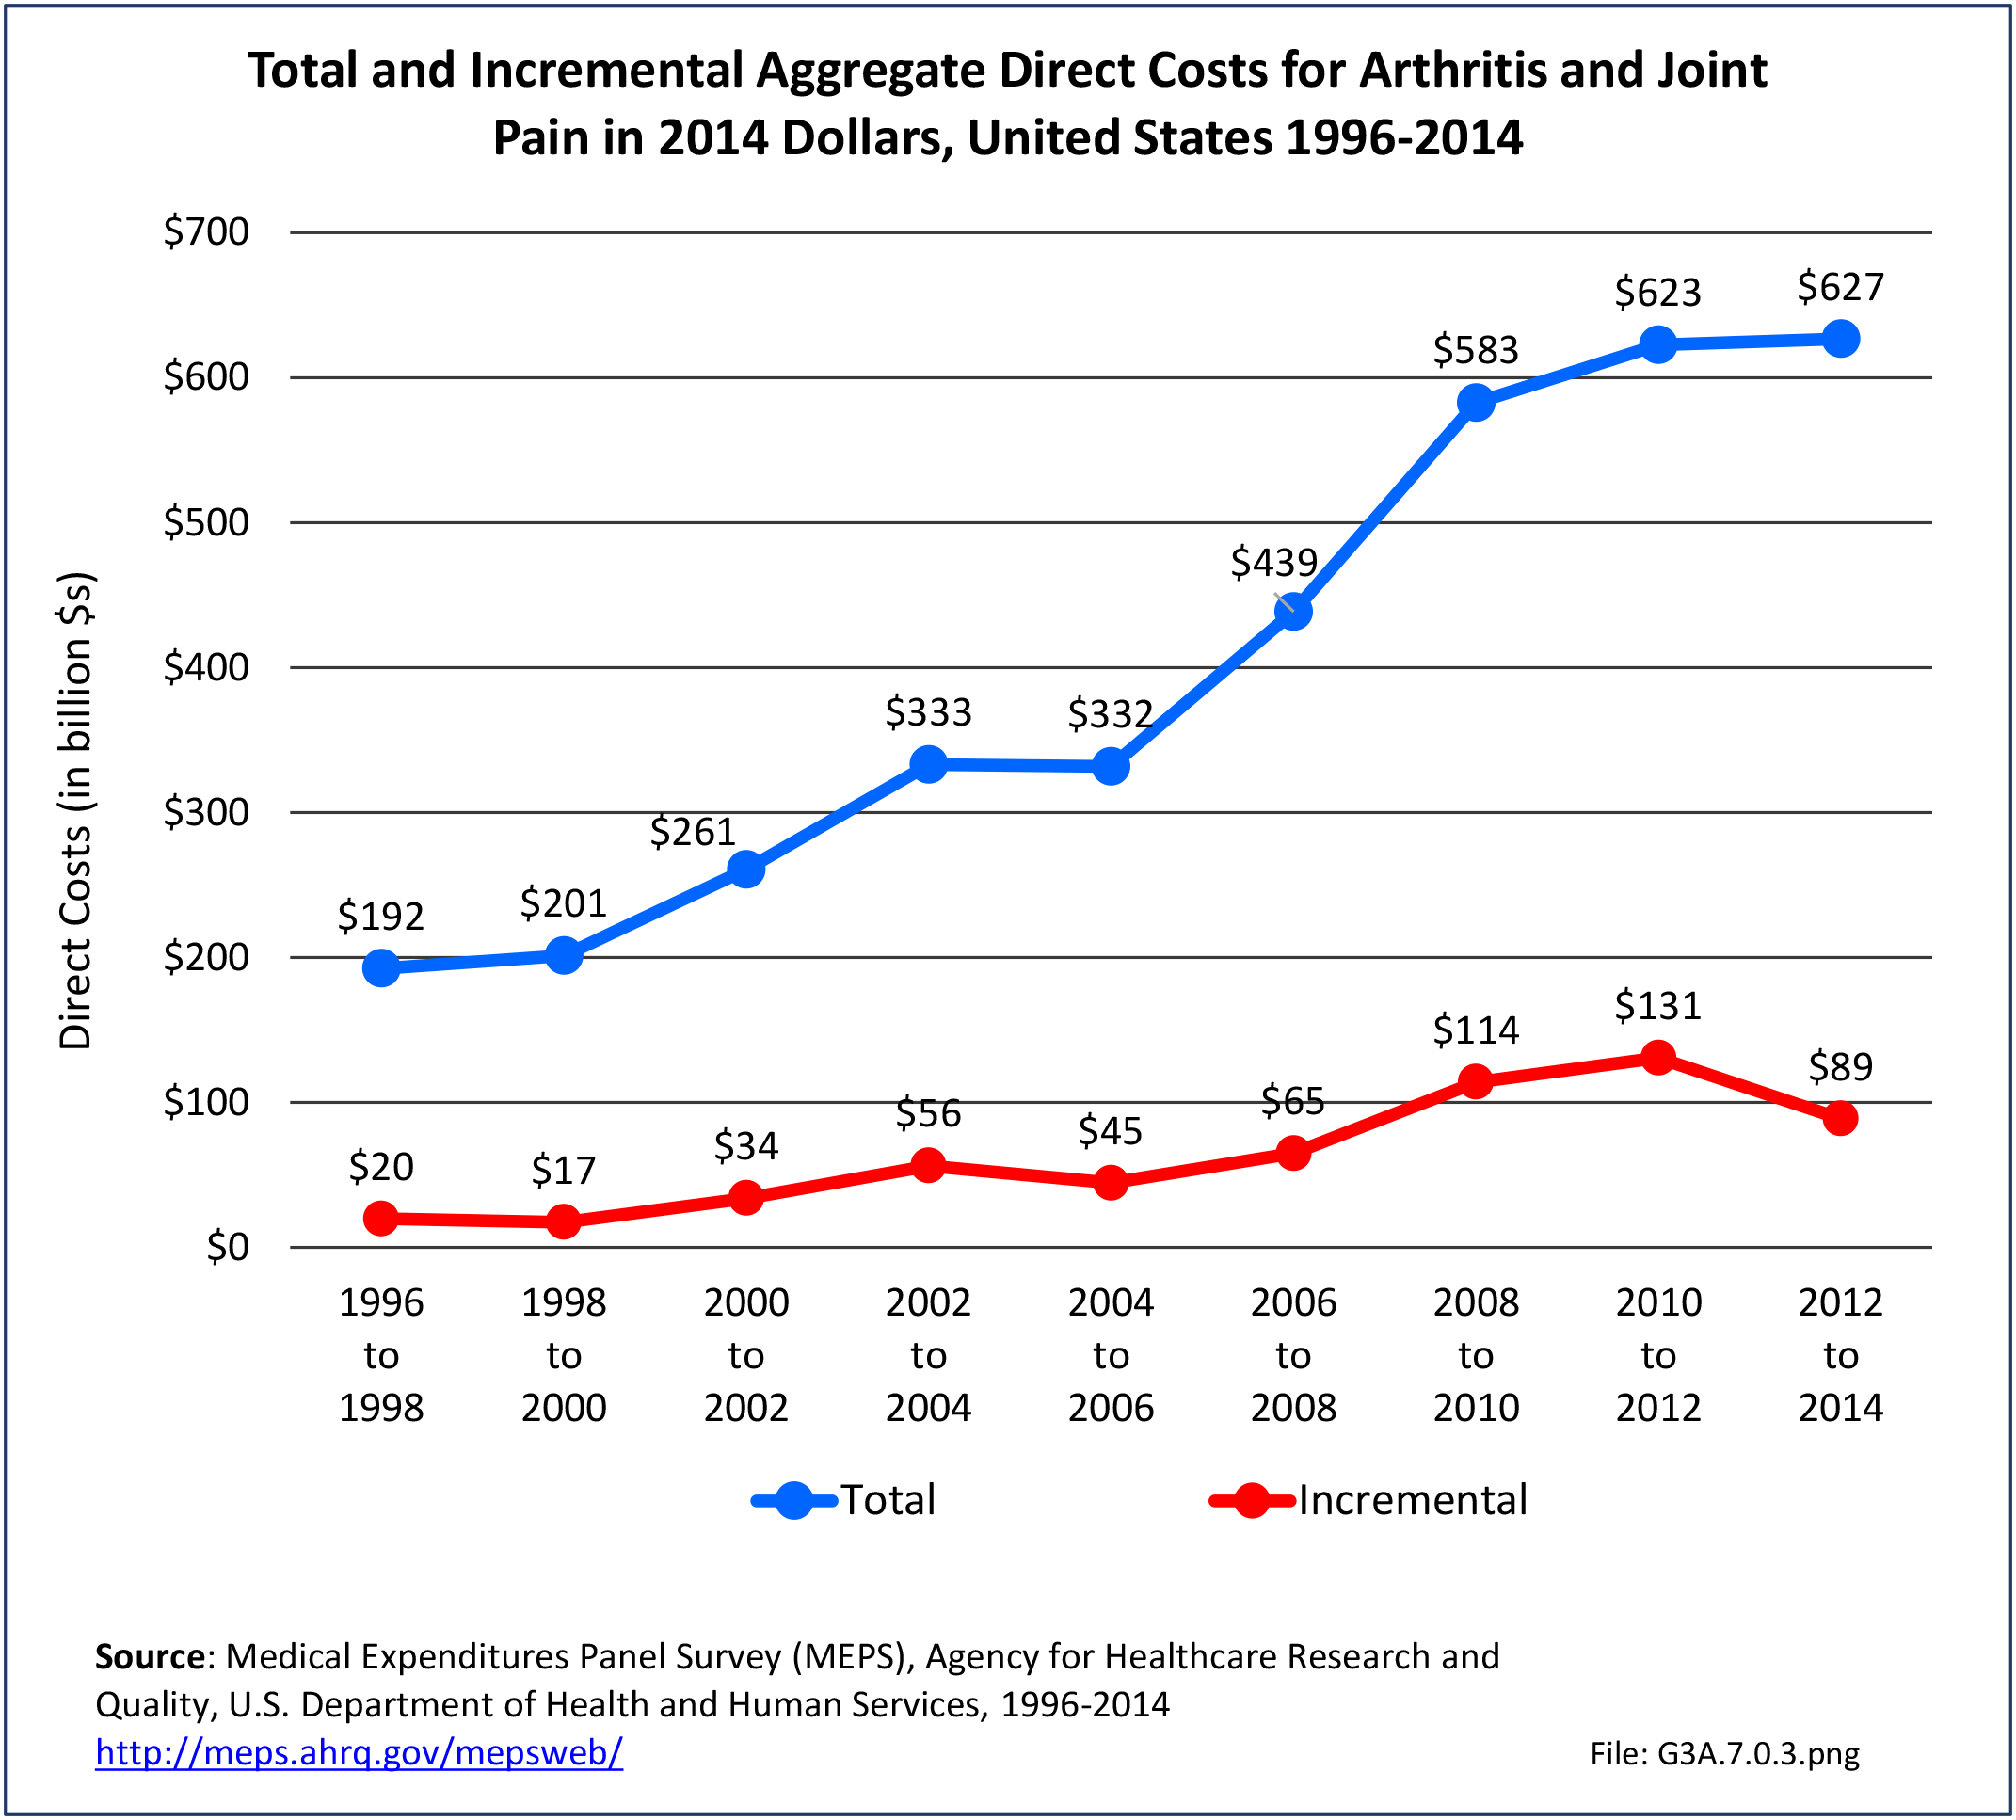
Total all-cause medical expenditures were $32.9 billion. Total costs include ambulatory care, inpatient care, prescriptions filled, and residual costs (ER, home health, medical devices).


For incremental medical expenditures (expenditures directly attributed to RA), mean per person expenditures for RA averaged $7,957 for the years 2008-2012. Aggregate medical expenditures (combined cost for all persons) in the United States for RA averaged $13.8 billion in each of the years of 2008-2012. (Reference Table 8.13 PDF CSV and Table 8.23 PDF CSV)
Indirect Costs
The ratio of persons in the labor force without RA is higher than for those with RA in the general population, resulting in earnings losses due to RA. Among the estimated 900,746 working age adults (18-64 years) with a work history and RA, 56.1% had worked during the year compared with 87.9% of those without RA. Each year, those with RA earned, on average, $14,542 less than those without RA, which among all adults with RA totaled $13.1 billion.
For incremental medical expenditures, mean per person earnings losses attributed to RA averaged $8,748 per year in 2008-2012. Aggregate earnings losses for the United States due to RA averaged $7.9 billion in each of the years of 2008-2012. (Reference Table 8.13 PDF CSV and Table 8.23 PDF CSV)

Medication Costs
The cost of treating RA can be high. Older treatments of NSAIDS (aspirin, ibuprofen, naproxen, and celecoxib) and analgesics (acetaminophen, morphine, oxycodone) are readily available and inexpensive. However, many who suffer from RA cannot tolerate these drugs or they do not suppress the pain. A second level of drugs, the DMARDs (disease-modifying antirheumatic drugs) designed to reduce symptoms and damage, have become more affordable than previously, but still cost between $1,500 and $2,000 annually.
The newest level of drugs, the biologics, remain very expensive. Biologics are genetically engineered proteins originating from human genes targeting specific parts of the immune system that fuel inflammation. The first biologic, etanercept (Enbrel), was approved in 1998, and was used to treat RA. Actual cost estimates have a wide range, an average $18,000 to $100,000 annually, depending on the type of biologic used.8,9,10,11 In addition, because most are administered through an IV or injection administered by a healthcare professional, there are additional costs. Higher medication costs have been found to be associated with age and comorbidities.12
- 1. England BR, Thiele GM, Anderson DR, Mikuls TR. Increased cardiobascular risk in rheumatoid arthritis: mechanisms and implications.BMJ 2018;361:k1036. doi: https://doi.org/10.1136/bmj.k1036. https://www.bmj.com/content/361/bmj.k1036. Accessed October 24, 2018.
- 2. Hochberg MC, Chang RW, Dwosh I, Lindsey S, Pincus T, Wolfe F: The American College of Rheumatology 1991 revised criteria for the classification of global functional status in rheumatoid arthritis. Arthritis Rheum 1992;35:498-502.
- 3. Singh JA, Saag KG, Bridges SL Jr, Akl EA, Bannuru RR, Sullivan MC, et al: 2015 American College of Rheumatology guideline for the treatment of rheumatoid arthritis. Arthritis Care Res 2016 Jan;68(1):1-25. doi: 10.1002/acr.22783.
- 4. Helmick CG, Felson DT, Lawrence RC, et al for the National Arthritis Data Workgroup. Estimates of the prevalence of arthritis and other rheumatic conditions in the United States: Part I. Arthritis & Rheumatism 2008;58(1):15-25.
- 5. Myasoedova E, Crowson DS, Kremers HM, et al. Is the incidence of rheumatoid arthritis rising?: results from Olmsted County, Minnesota, 1955-2007. Arthritis & Rheumatism 2010;62(6):1576-82.
- 6. a. b. Hunter, TM, Boytsov NN, Zhang X, et al. Prevalence of rheumatoid arthritis in the United States adult population in healthcare claims databases, 2004-2014. Rheumatol Int. April 2017. doi: 0.1007/s00296-017-3726-1.
- 7. Rasch EK, Hirsch R, Paulose-Ram R, and Hochberg MC. Prevalence of rheumatoid arthritis in persons 60 years of age and older in the United States. Arthritis & Rheumatism 2003;48(4):917-926.
- 8. Chastek B, White J, Van Voorhis D, et. al. A retrospective cohort study comparing utilization and costs of biologic therapies and JAK inhibitor therapy across four common inflammatory indications in adult US managed care patients. Adv Ther 2016;33:626-642.
- 9. Sauer BC, Teng CC, He T, et al. Treatment patterns and annual biologic costs in US veterans with rheumatic conditions or psoriasis. J Med Econ 2016;19(1):34-43. Doi: 10.3111/13696998.2015.1086774.
- 10. Curtis JR, Chastek B, Becker L, et al. Cost and effectiveness of biologics for rheumatoid arthritis in a commercially insured population. J Manag Care Spec Pharm 2015;21(4):318-329.
- 11. Gu T, Shah N, Deshpande G, Tang DH, Eisenberg DF. Comparing biologic cost per treated patient across indications among adult US managed care patients: a retrospective cohort study. Drugs – Real World Outcomes. 2016;3(4):369-381. Doi:10.1007/s40801-016-0093-2.
- 12. Greenberg JD, Palmer JB, Li Y, et al. Healthcare resource use and direct costs in patients with ankylosing spondylitis and arthritis in a large US cohort. J Rheumatol 2016;43(1):88-96. Doi: 1 0.3899/jrheum.150540.
Edition:
- Fourth Edition