The Economic Cost section of this report uses the Medical Expenditures Panel Survey (MEPS), a standard source for cost of illness estimates, to estimate the total direct and indirect costs of musculoskeletal conditions and selected categories of musculoskeletal conditions, as well as the incremental direct and indirect costs specifically attributable to the selected category. Total costs are all costs for a patient regardless of the condition responsible; incremental costs are those costs attributed to a specified condition. A quick review of all economic terms used can be found by clicking HERE.
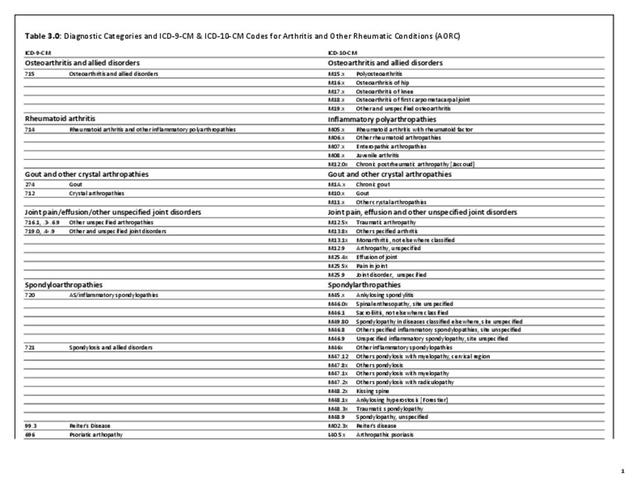
There are several important points to remember here. First, for arthritis and other rheumatic conditions, MEPS requires the use of selected 3-digit ICD-9-CM codes, using the 3- and 4-digit NADW AORC ICD-9-CM codes to create a similar category called “arthritis and joint pain.” This approach has been used for a number of years and provides a comparative estimate of the costs of AORC. Additionally, costs estimates are per person and reported as mean per person costs. To arrive at the estimated aggregate cost, the mean per person cost is multiplied by the number of people affected, resulting in a total cost for conditions in the United States.
MEPS provides estimates of actual medical “expenditures,” meaning money changing hands, rather than medical “charges,” which are based on what is originally billed but rarely paid in full. Thus, the term direct costs, as used here, reflects actual medical expenditures. Indirect costs are those associated with lost wages. Aggregate costs for both direct and indirect costs are the sum of per-person costs across all individuals with the condition.
All-cause costs include medical expenditures or lost wages for persons with musculoskeletal disease, regardless of whether those costs are due to the musculoskeletal disease or another medical condition. Incremental costs are those estimated as attributable to musculoskeletal disease.
Direct Costs
Annual all-cause direct costs, in 2014 dollars, for arthritis and joint pain increased from a per person mean of $6,642 in the years 1996-1998 to $9,554 in 2012-2014. Incremental direct costs for arthritis and joint pain increased from a per person mean of $679 in the years 1996-1998 to a mean of $1,352 in 2012-2014, in 2014 dollars. The change in total mean costs was 44%, while incremental mean costs doubled. Incremental arthritis and joint pain costs showed a decline in 2012-2014 annual average costs compared to the previous five periods. (Reference Table 8.4.3 PDF CSV; Table 8.5.3 PDF CSV)

Mean per person direct costs include ambulatory care, inpatient care, prescriptions, and other healthcare costs. In 2012-2014, ambulatory care accounted for about a third of per person direct costs, with inpatient care and prescriptions each accounting for approximately one-quarter (28% and 25%, respectively) of total cost. Over the past 18 years, prescription costs have seen the greatest change, rising nearly 140% per person in that time. Both inpatient and other healthcare costs remained steady at 9% and 11% increase, respectively. Ambulatory care increased by 59% over the same time period. (Reference Table 8.4.3 PDF CSV)

Annual all-cause aggregate medical costs for persons with a diagnosis of arthritis and joint pain in the US increased from $192.4 billion in 1996-1998 to $626.8 billion, in 2014 dollars, for the years 2012-2014. Aggregate annual direct costs specifically attributed to arthritis and joint pain (incremental costs) in the US increased from $19.7 billion in 1996-1998 to $88.7 billion for the years 2012-2014, in 2014 dollars. While the increase over the 18-year period for total aggregate costs was more than 225%, the increase for incremental aggregate costs was greater than 350%, despite the recent decline in aggregate incremental costs. (Reference Table 8.6.3 PDF CSV)

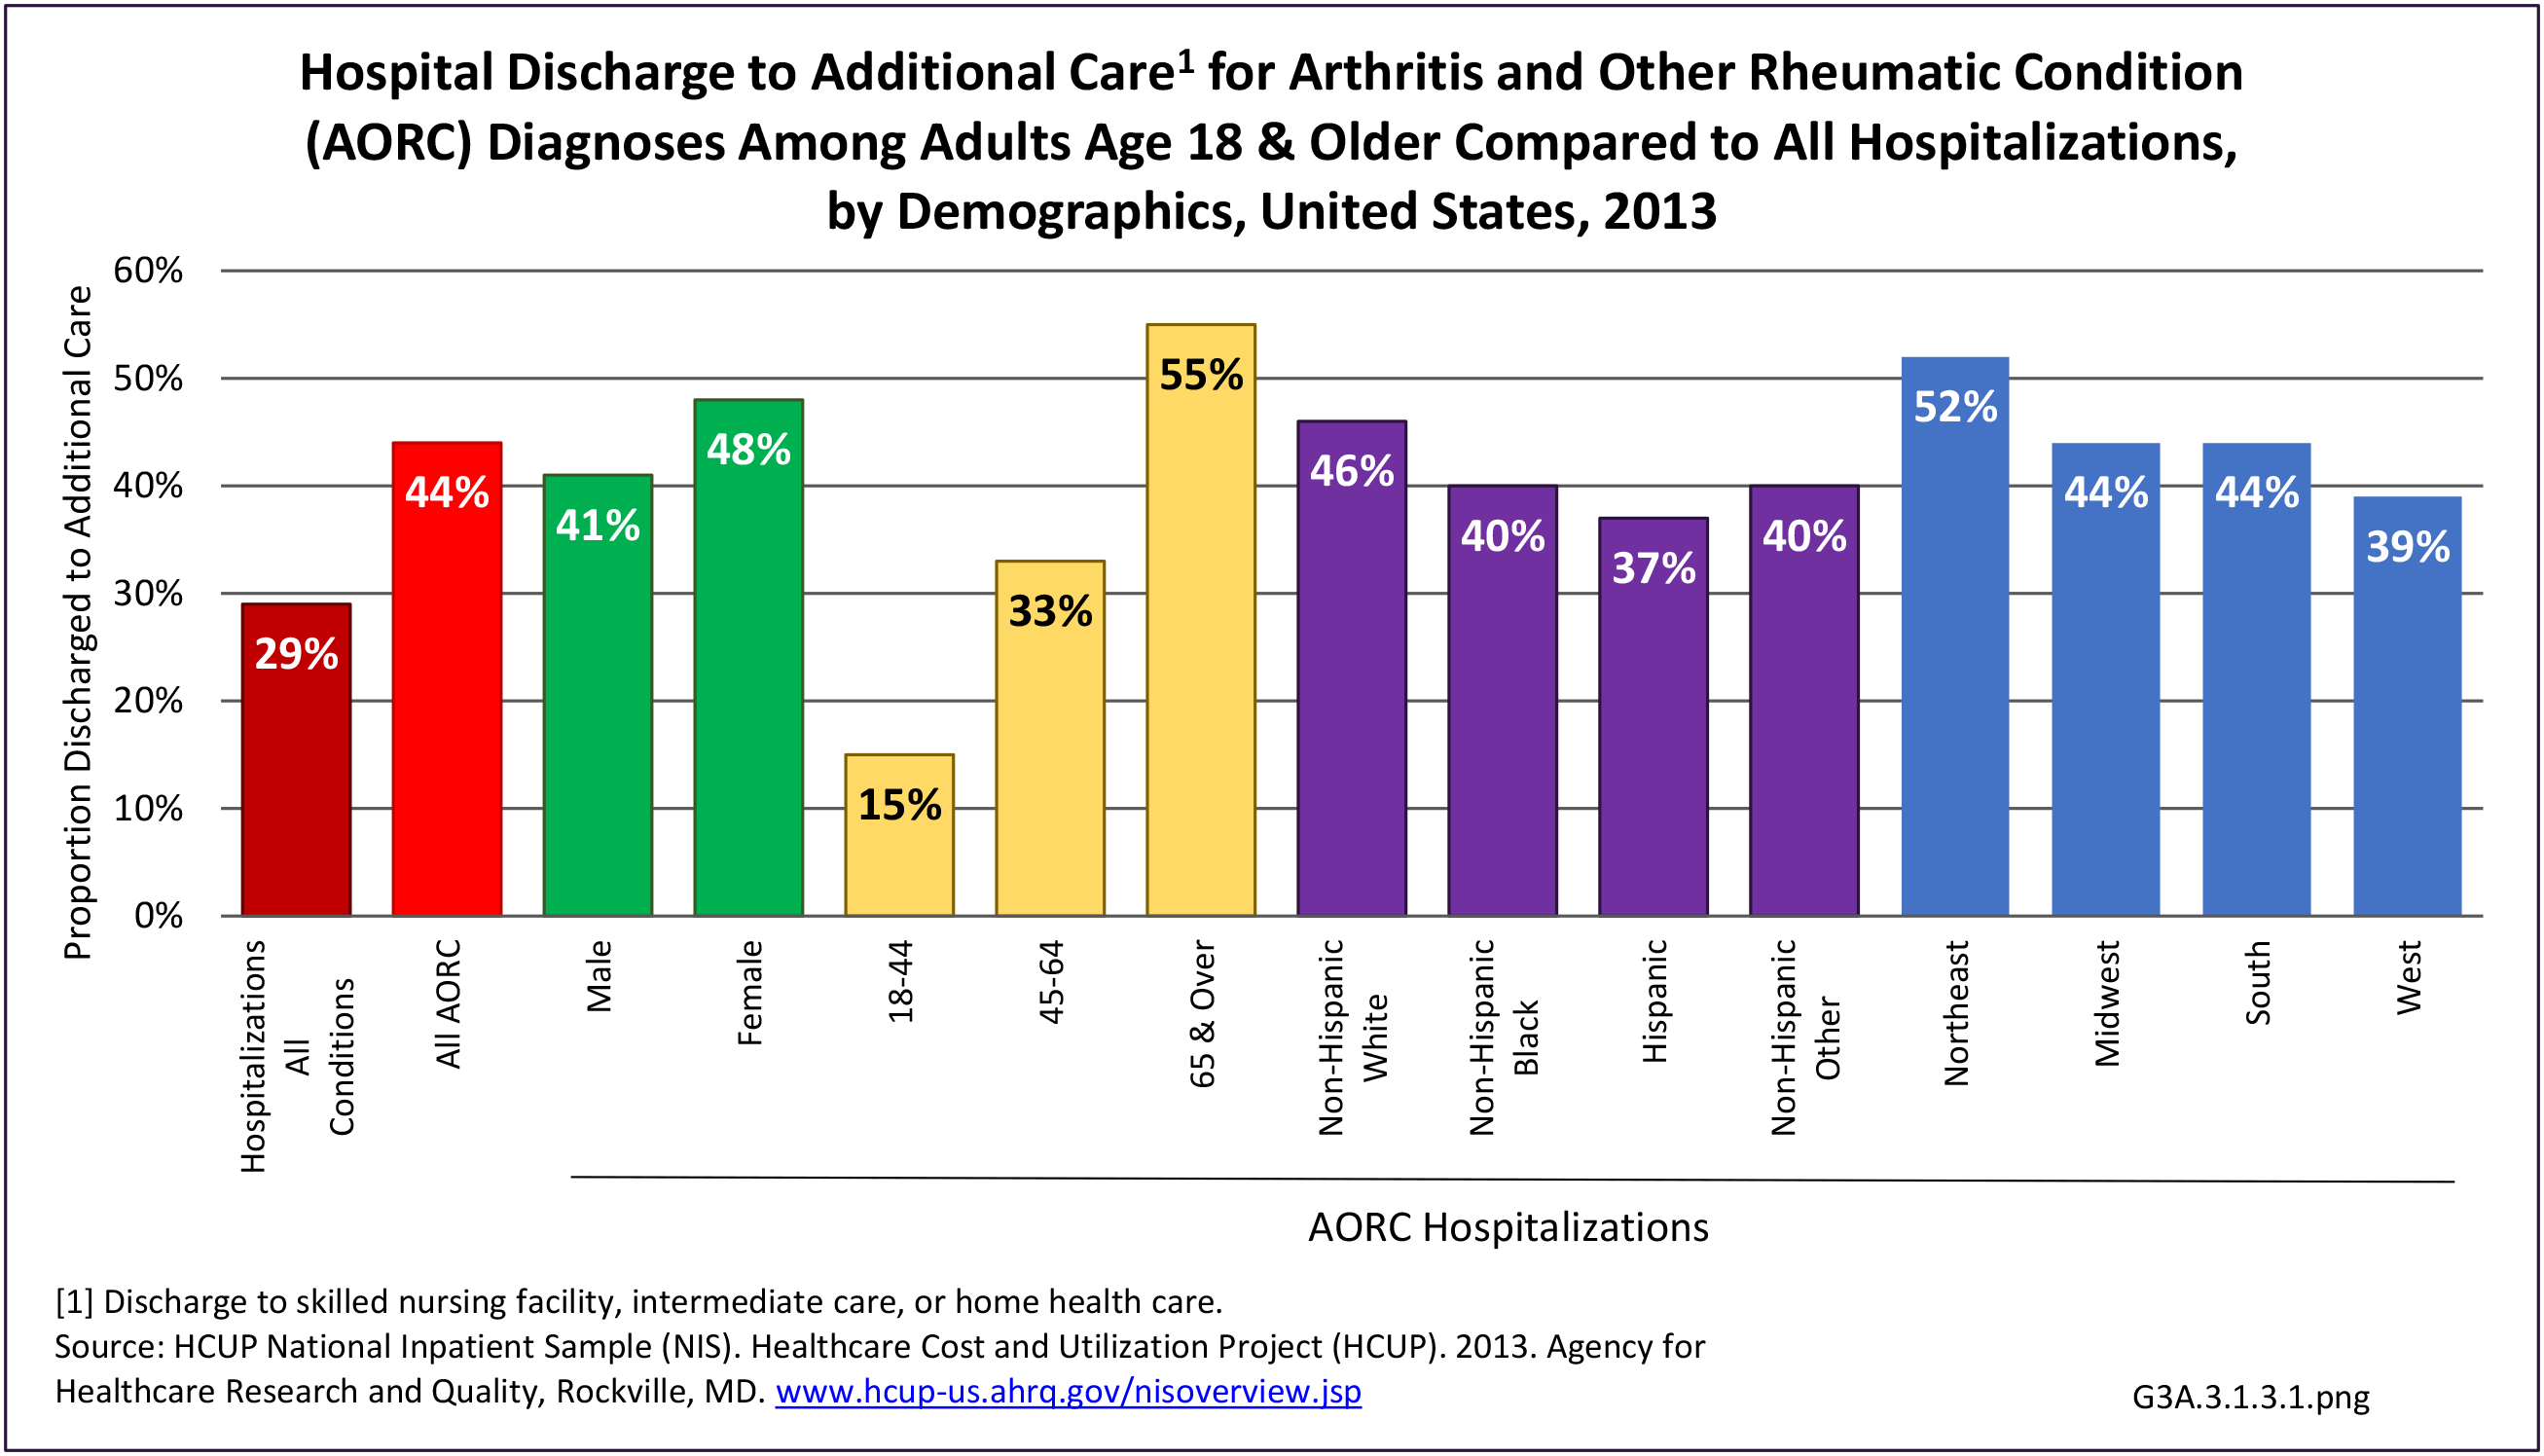
Annual per-person all-cause direct costs for arthritis and joint pain are highest for people age 65 and older, females, non-Hispanic whites, and residents of the Northeast region. Lower education and marital staus (divorced-widowed-separated) are also factors in higher cost. Public only insurance (Medicaid/Medicare) show the highest per person costs, in part because they serve a large share of the elderly population. (Reference Table 8.15.3 PDF CSV)
Mean and aggregate total and incremental direct and indirect costs for osteoarthritis, rheumatoid arthritis, gout, and connective tissue disease, using the annual average for years 2008-2014 MEPS data, are calculated and shown in their respective sections.
Indirect Costs
“Indirect costs” as used in this report reflect estimates of earnings losses for persons with a work history who are unable to work due to a medical condition. They do not reflect supplemental measures, such as reduced productivity, worker replacement, or early retirement due to medical conditions.
Indirect costs are not estimated for the broad category of arthritis and joint pain.
Edition:
- Fourth Edition