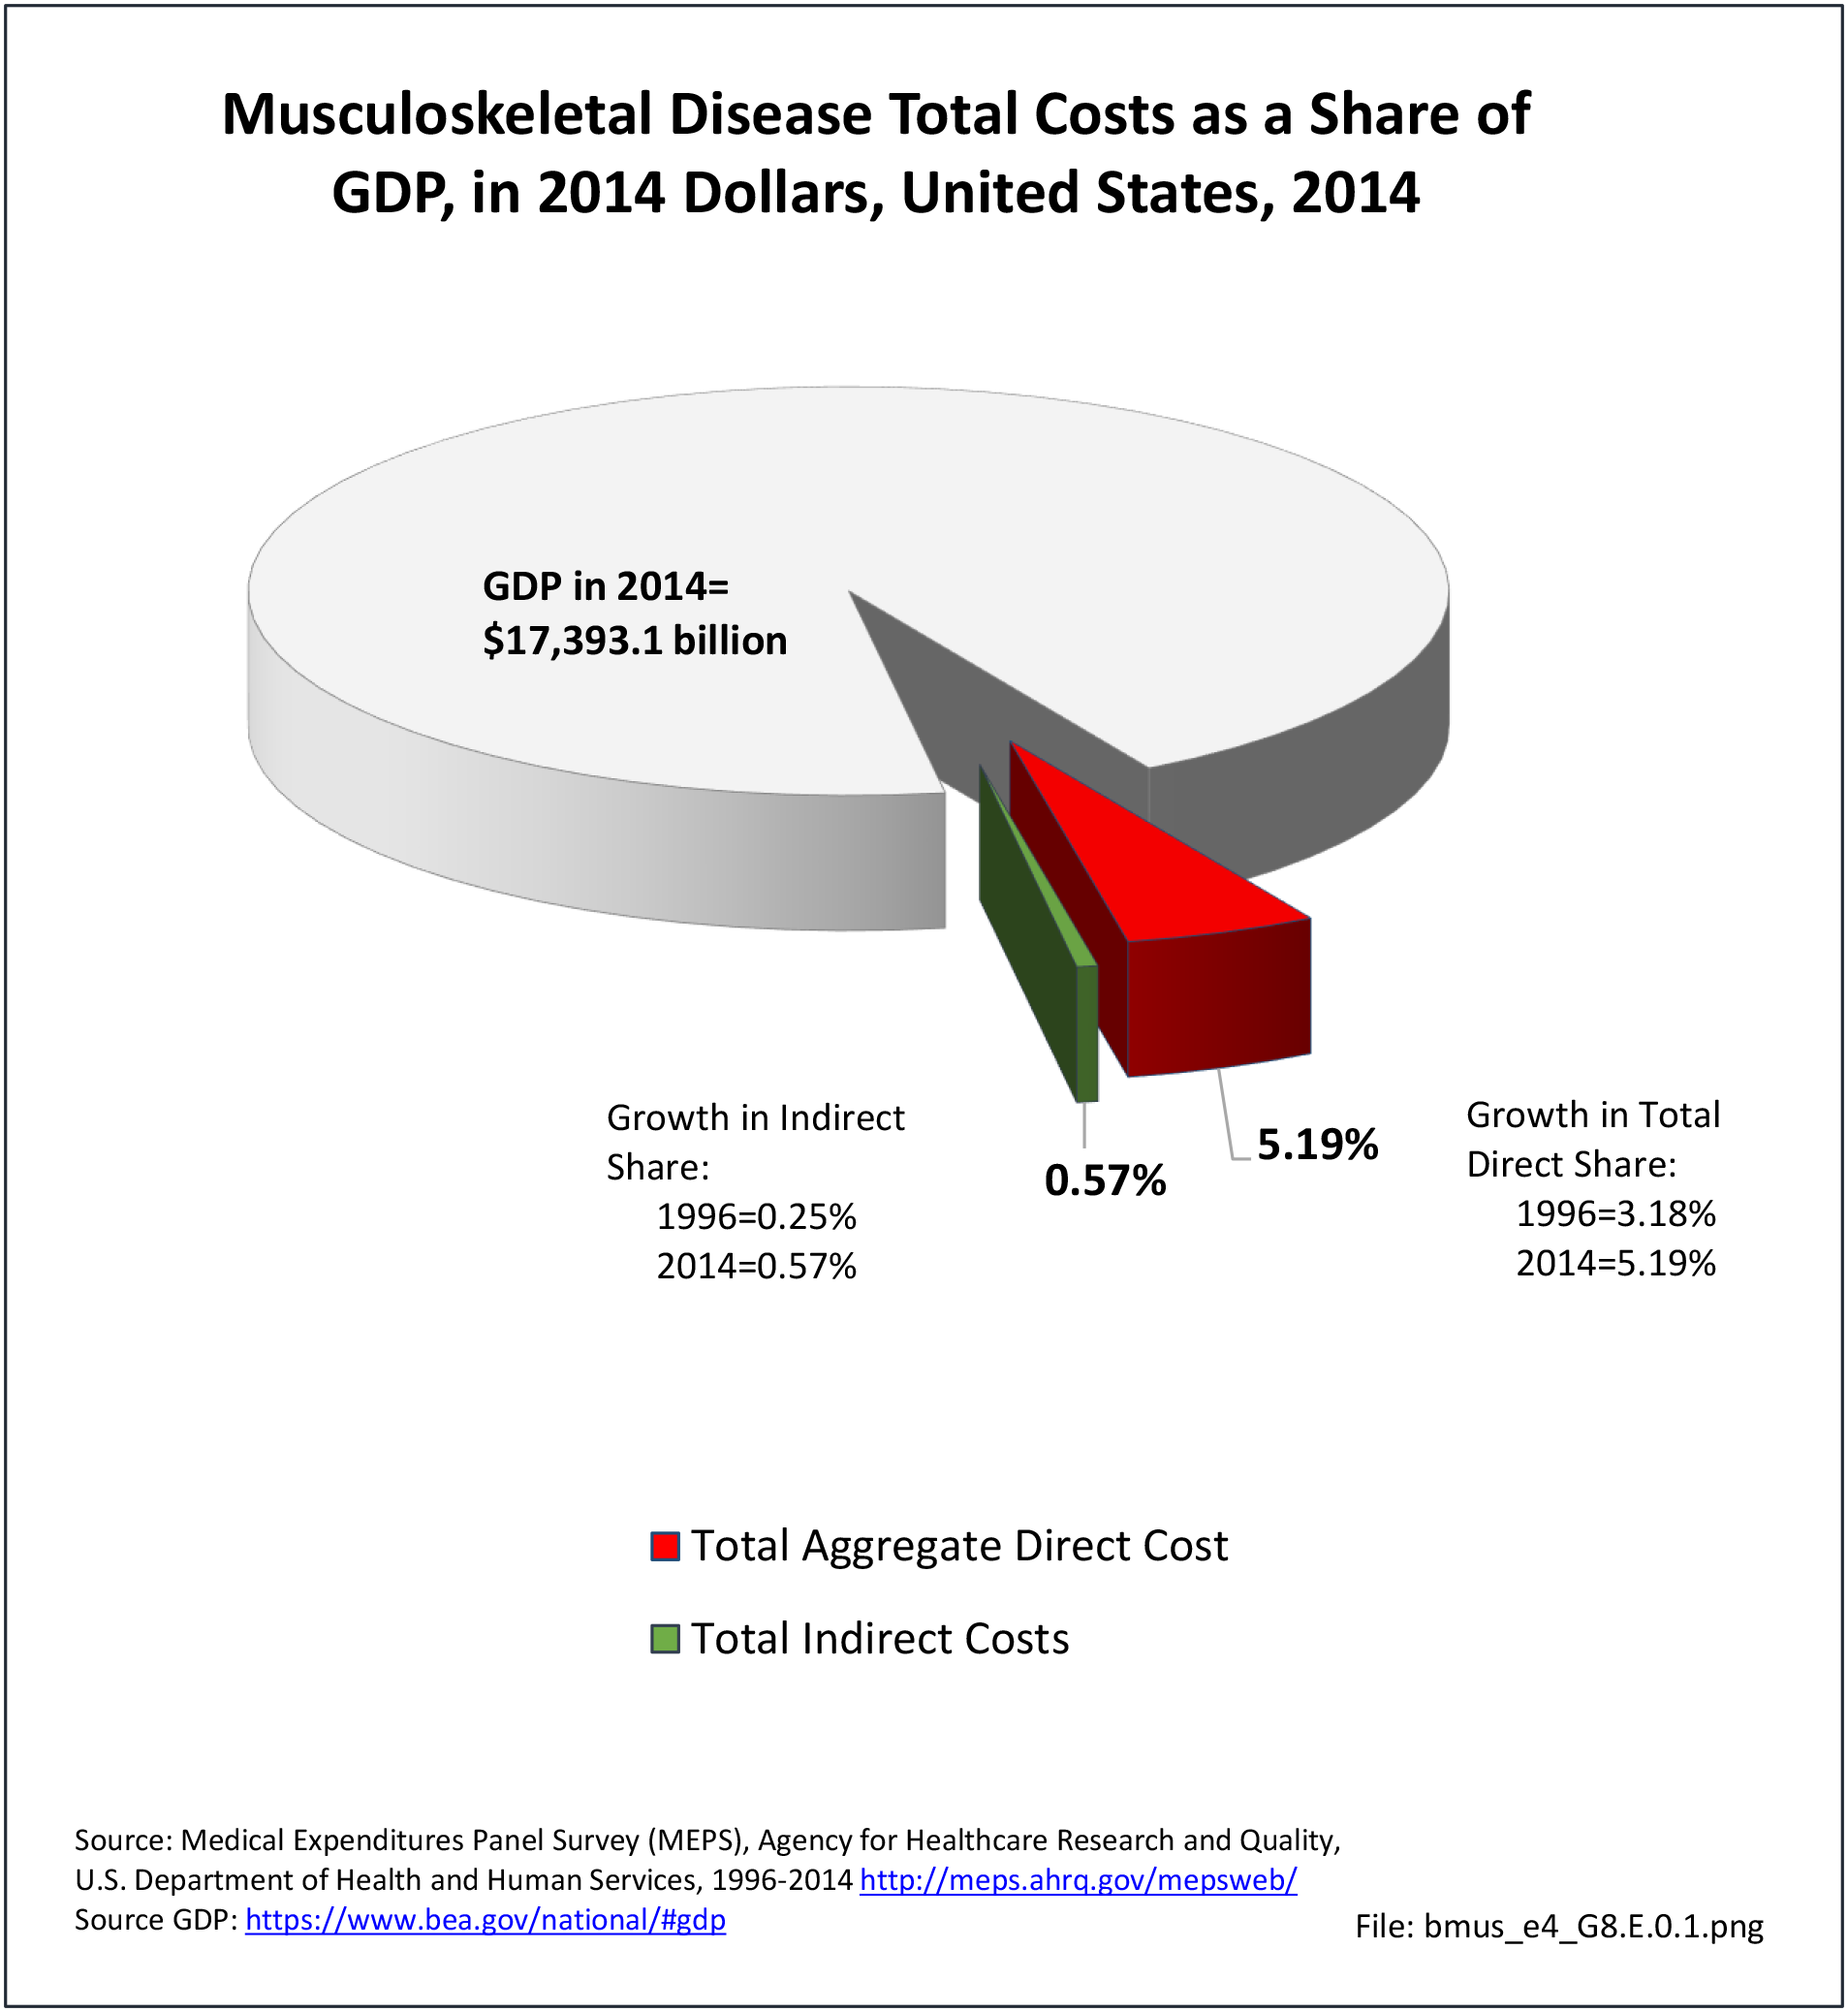
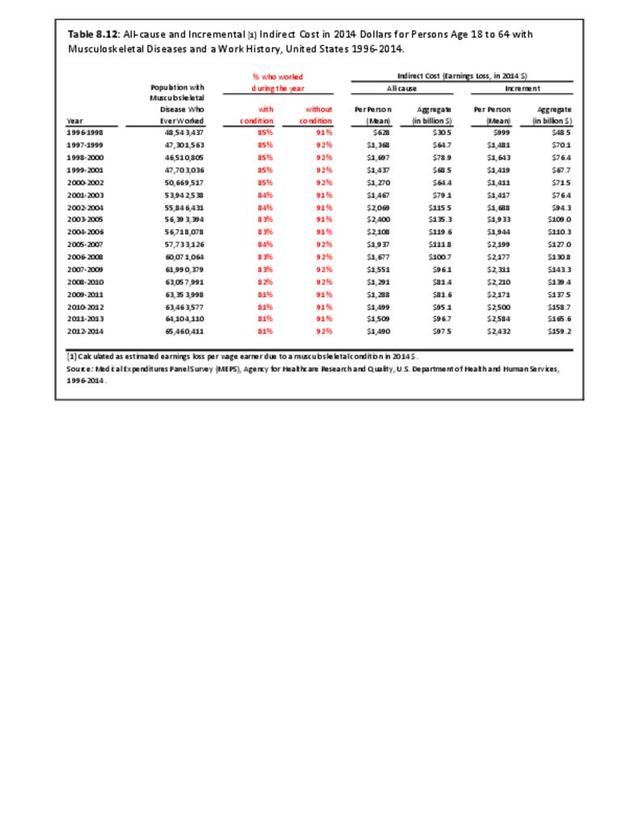
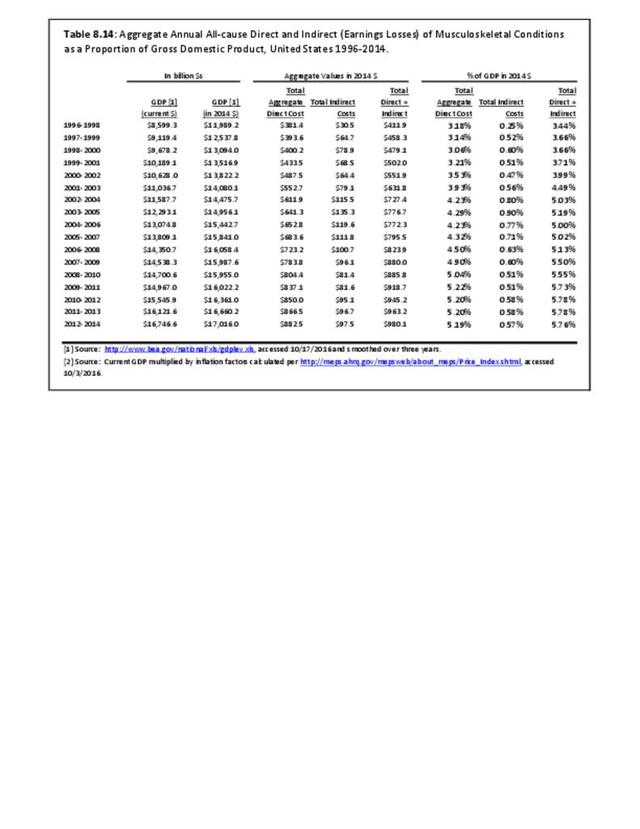
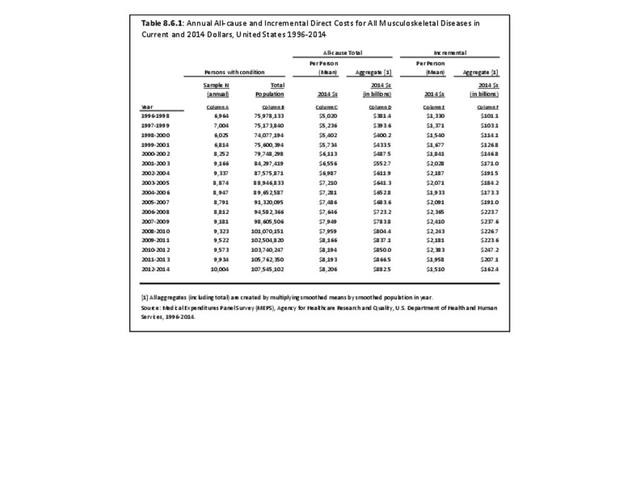
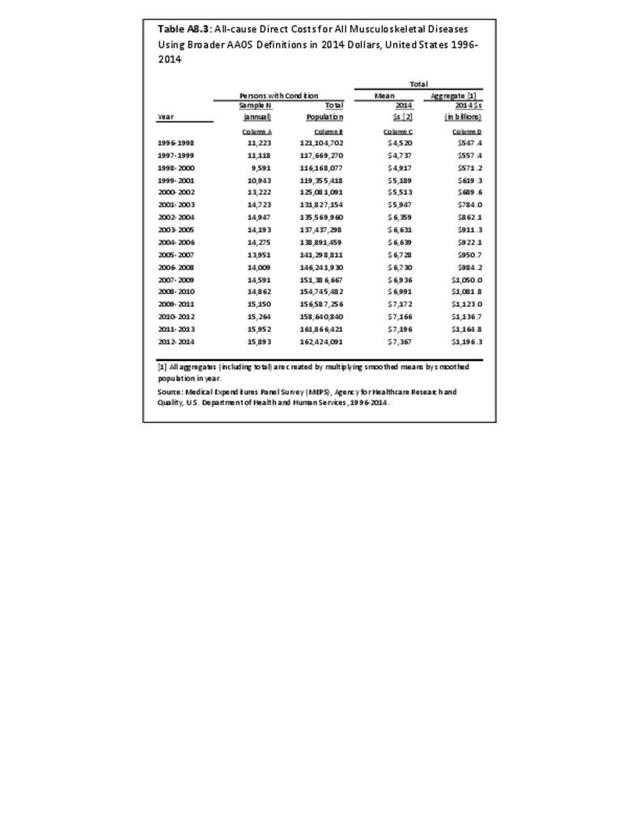
Aggregate all-cause expenditures in 2014 dollars increased from $381.4 billion in 1996-1998 to $882.5 billion in 2012-2014, an increase of more than 130%. (Reference Table 8.6.1 PDF CSV) In 1996-1998, aggregate all-cause expenditures for persons with a musculoskeletal disease, whether for musculoskeletal disease or other conditions, represented 3.2% of the GDP. By 2012-2014, the proportion had grown to 5.2% of the GDP. (Reference Table 8.14 PDF CSV)
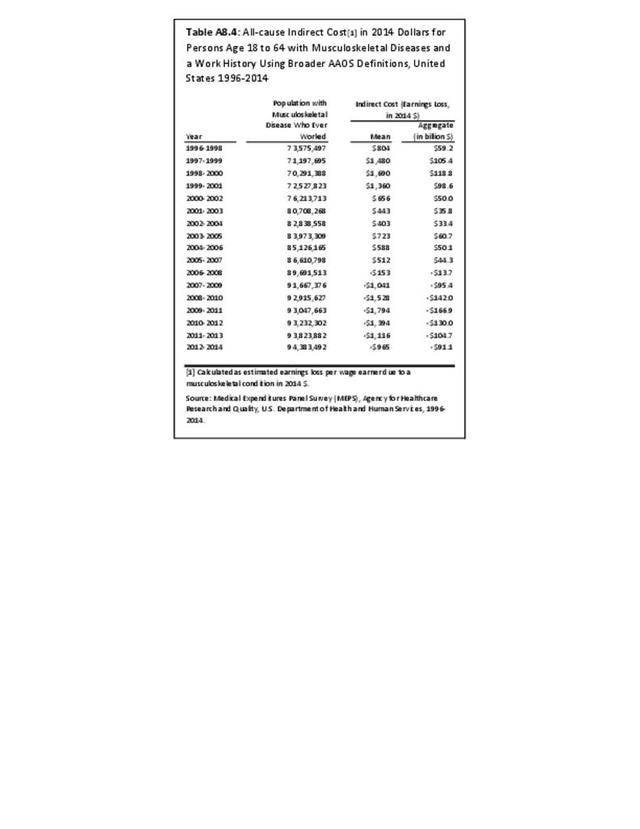
Aggregate incremental expenditures in 2014 dollars increased from $101.1 billion in 1996-1998 to $162.4 billion in 2012-2014, increasing from 0.25% to 0.57% of the GDP. (Reference Table 8.6.1 PDF CSV; Table 8.14 PDF CSV)
 Costs of Musculoskeletal Conditions as a Proportion of Gross Domestic Product (GDP), United States 1996-2014 - Click on image to enlarge")
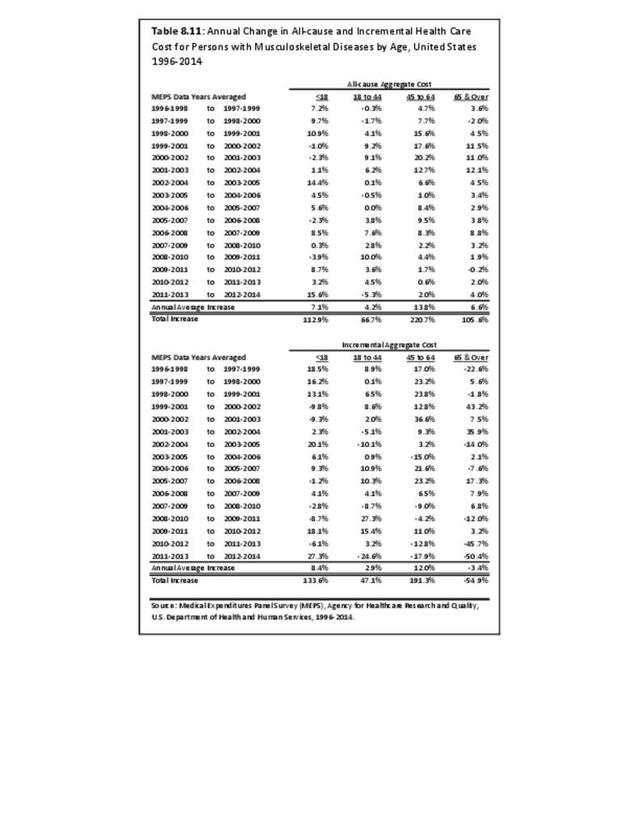
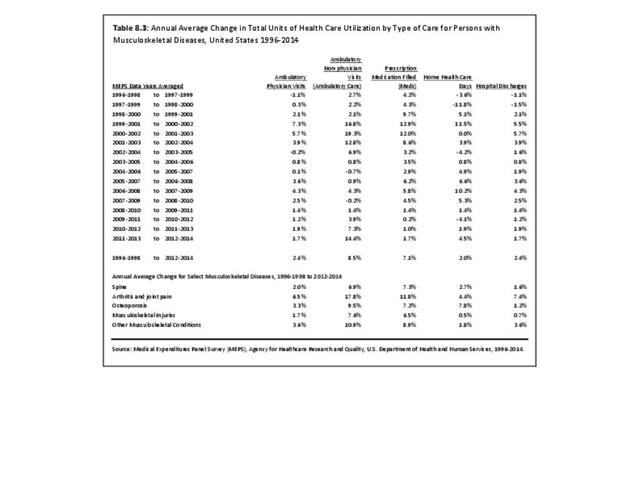
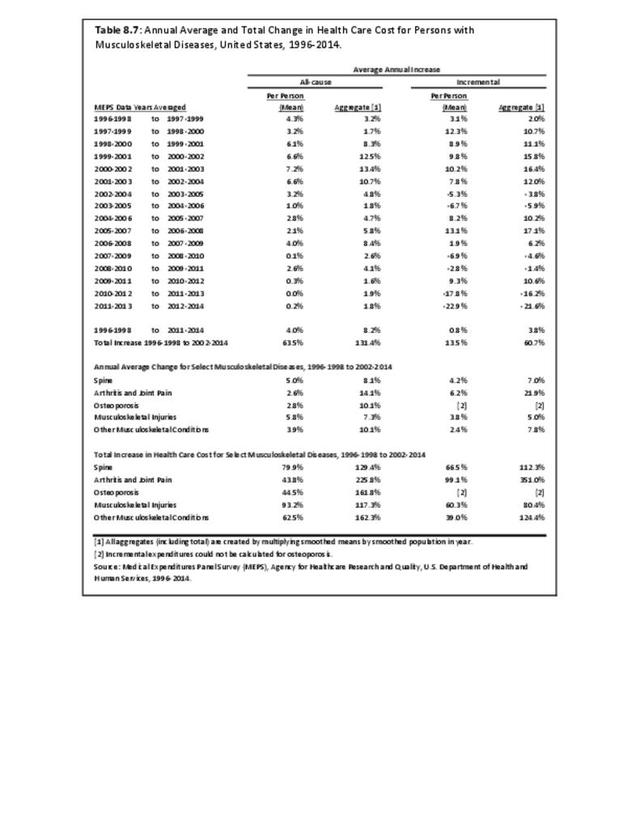
Over the full-time range of 1996-1998 through 2012-2014, the annual average rate of increase in aggregate all-cause and incremental costs for musculoskeletal diseases has been 8.2% and 3.8%, respectively. (Reference Table 8.7 PDF CSV)
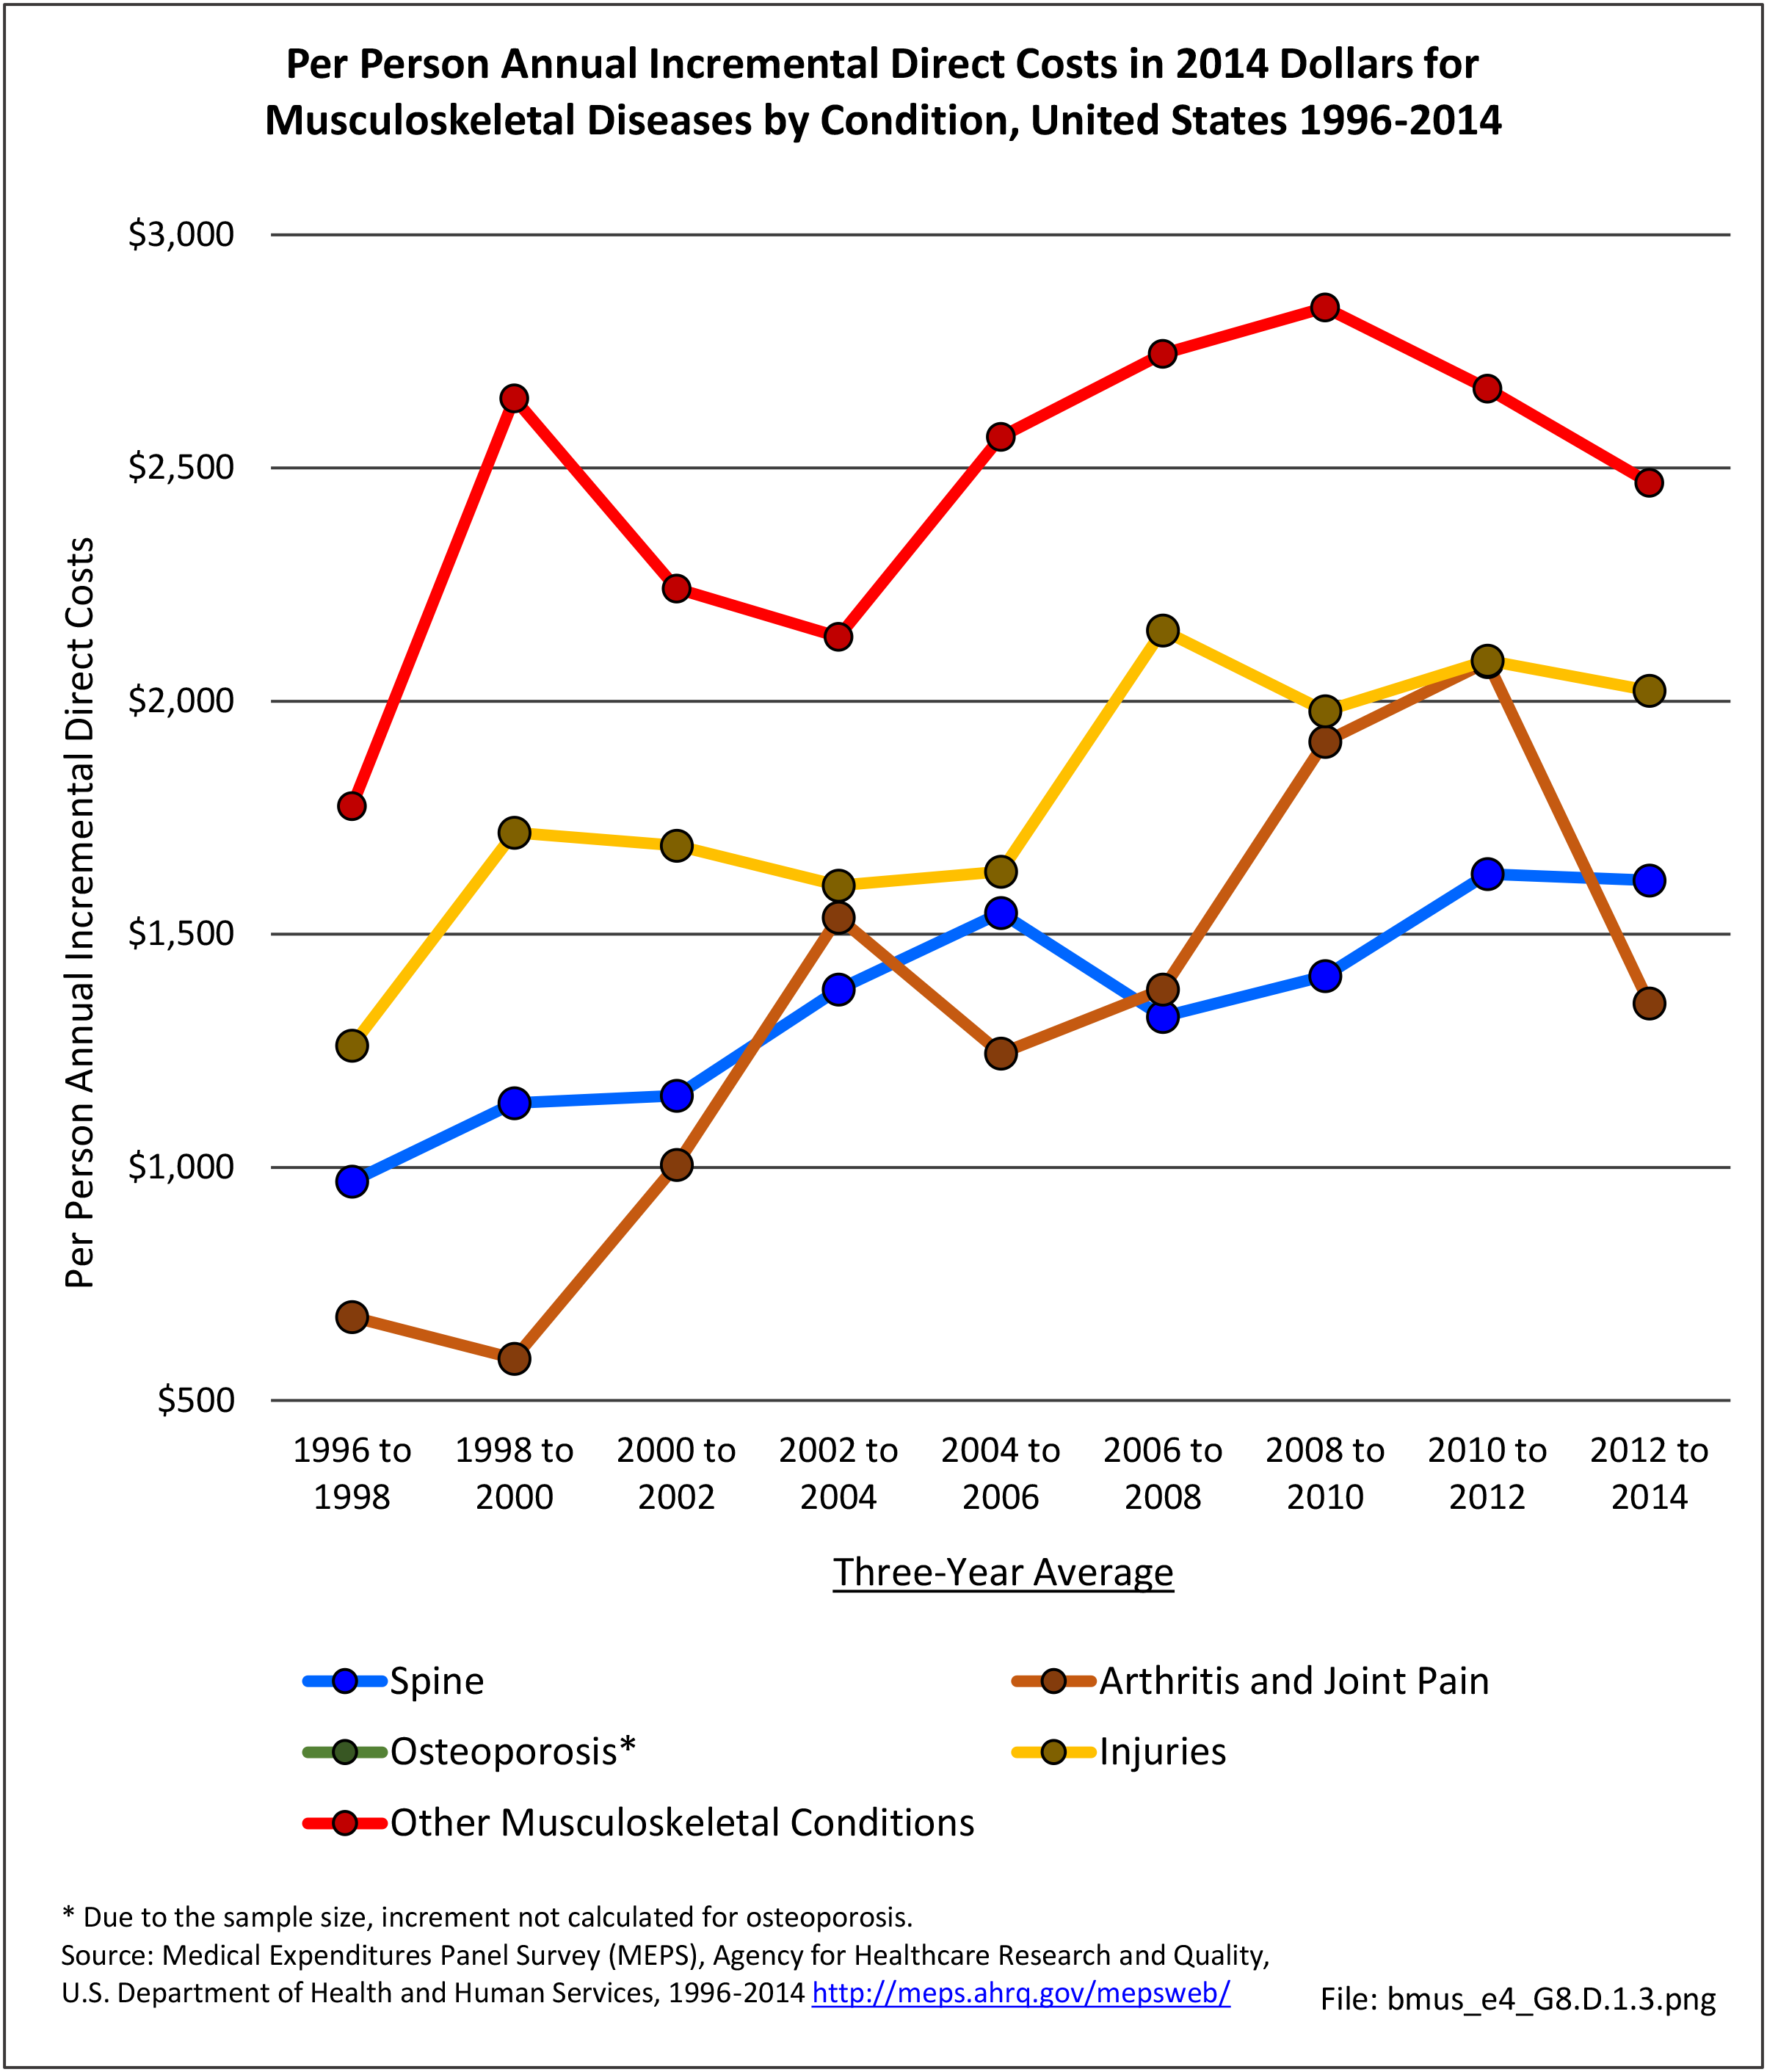
By Condition
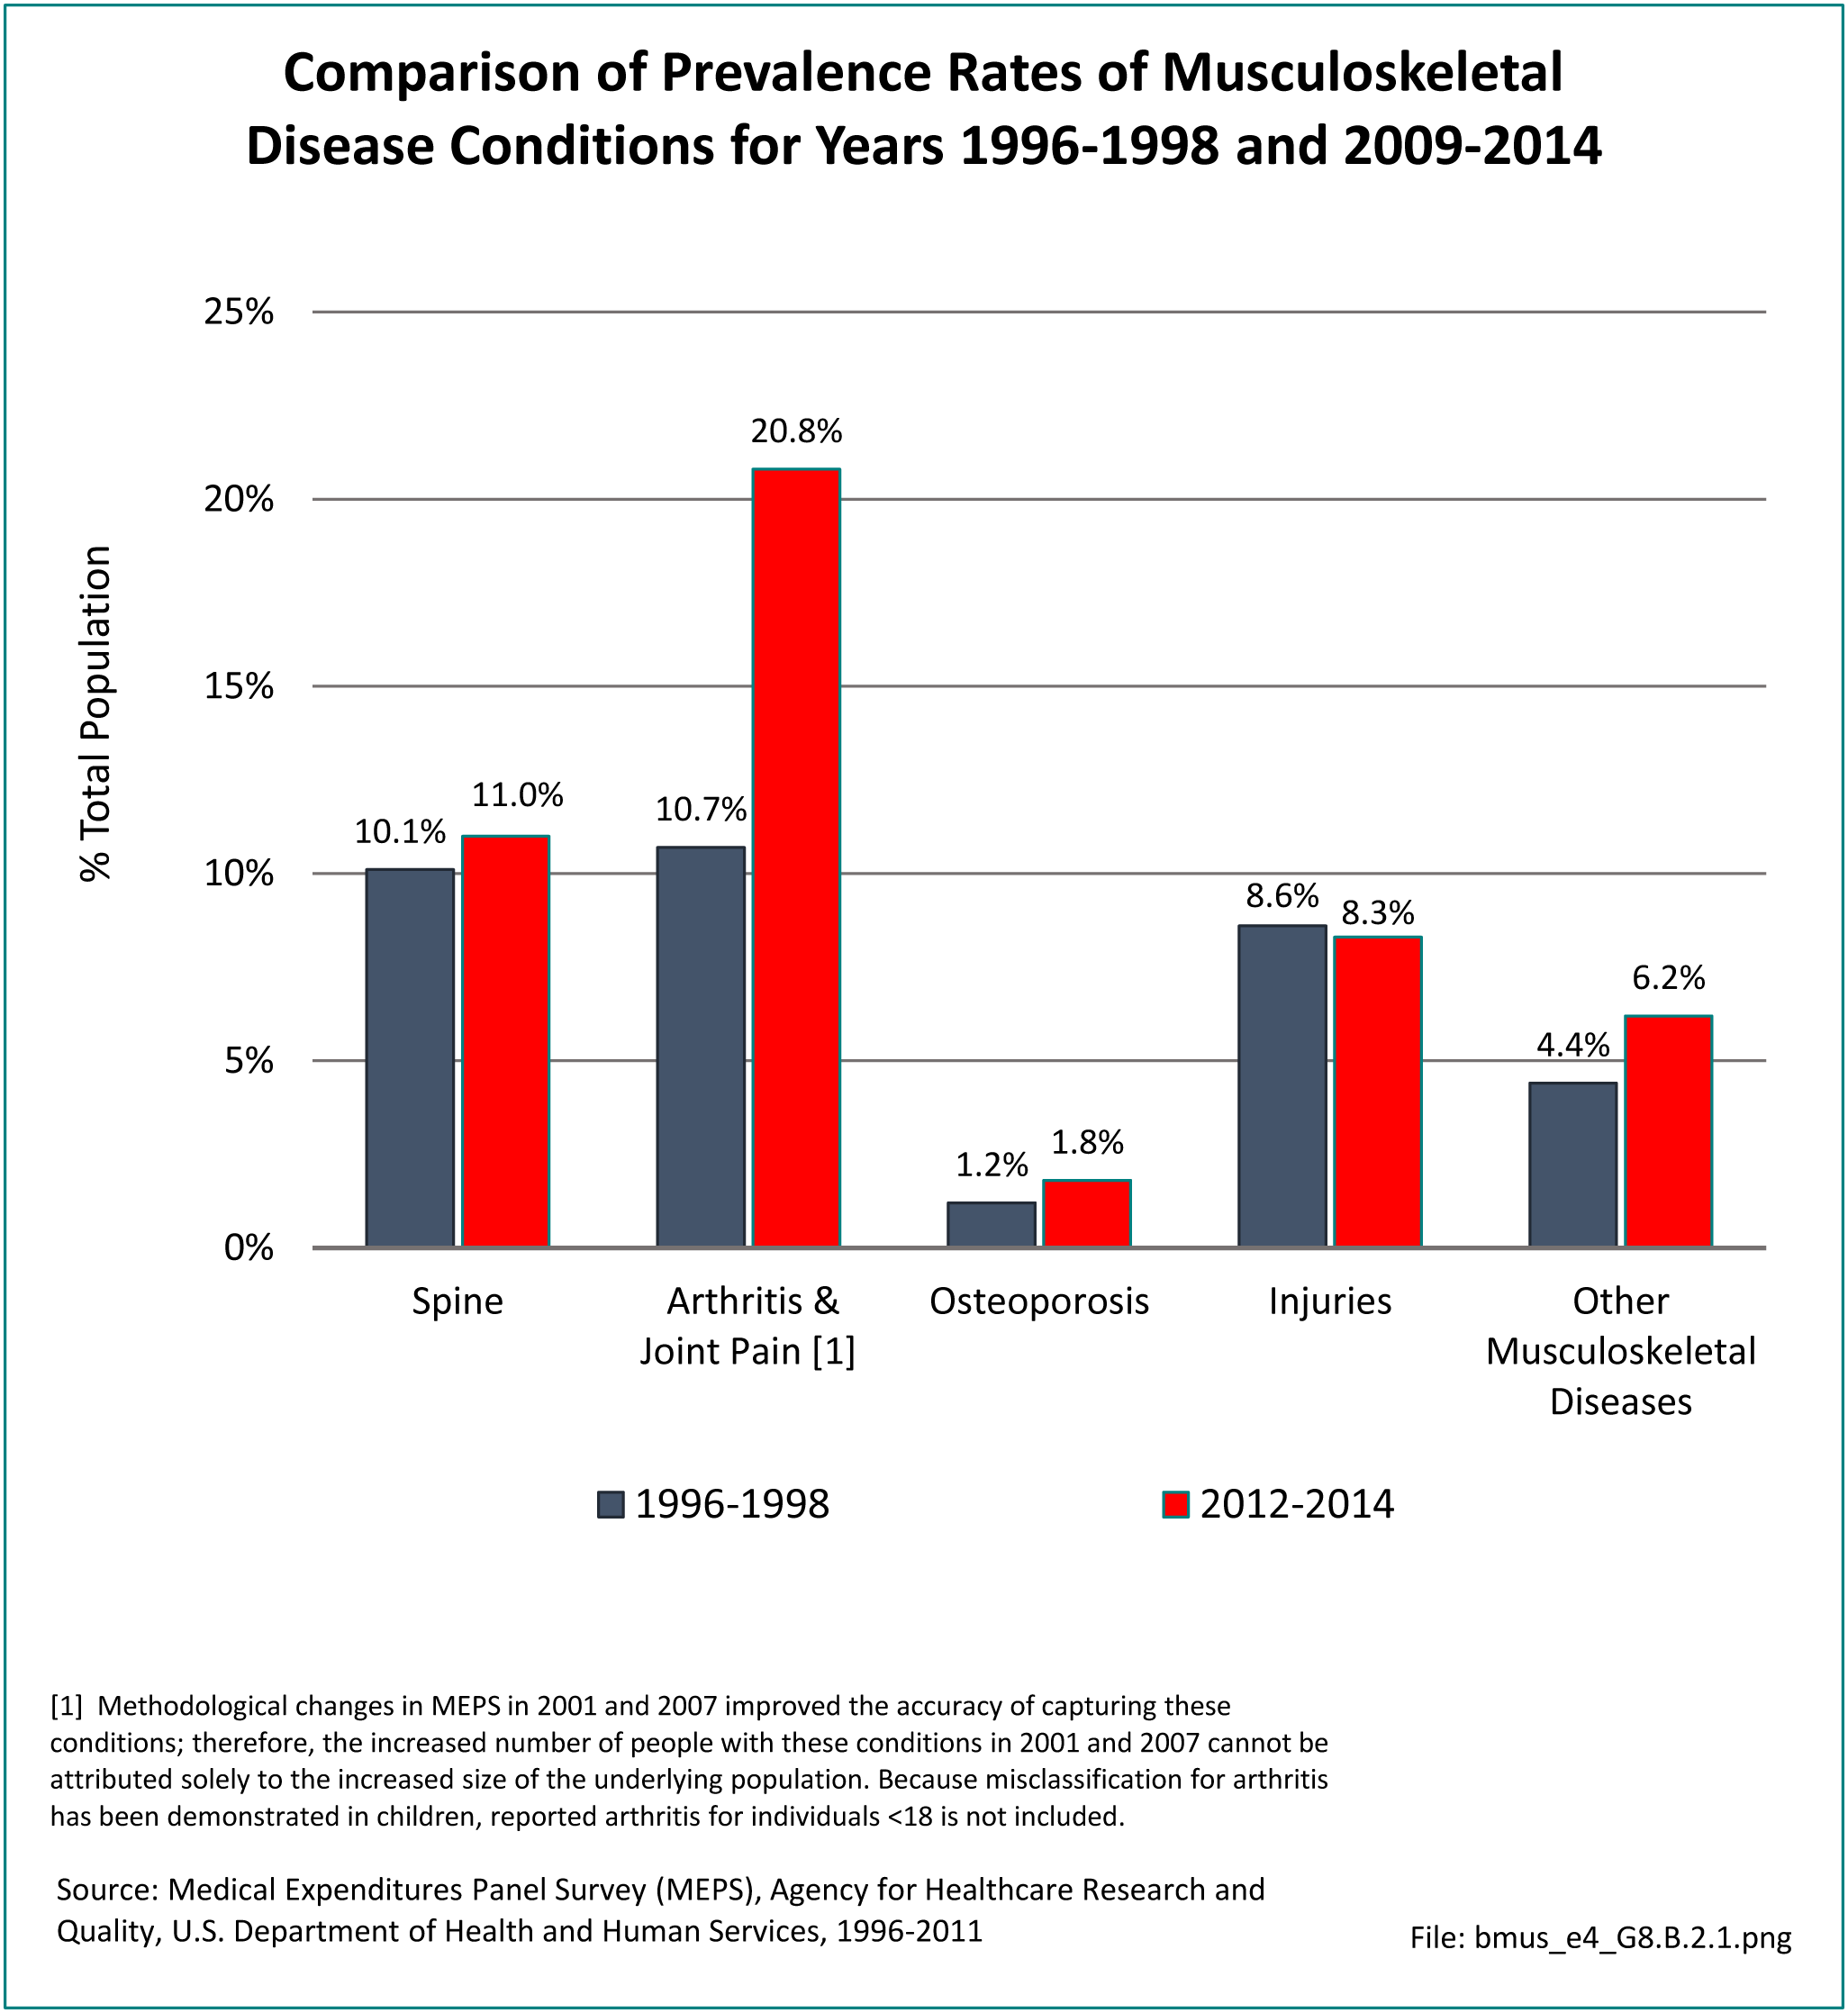
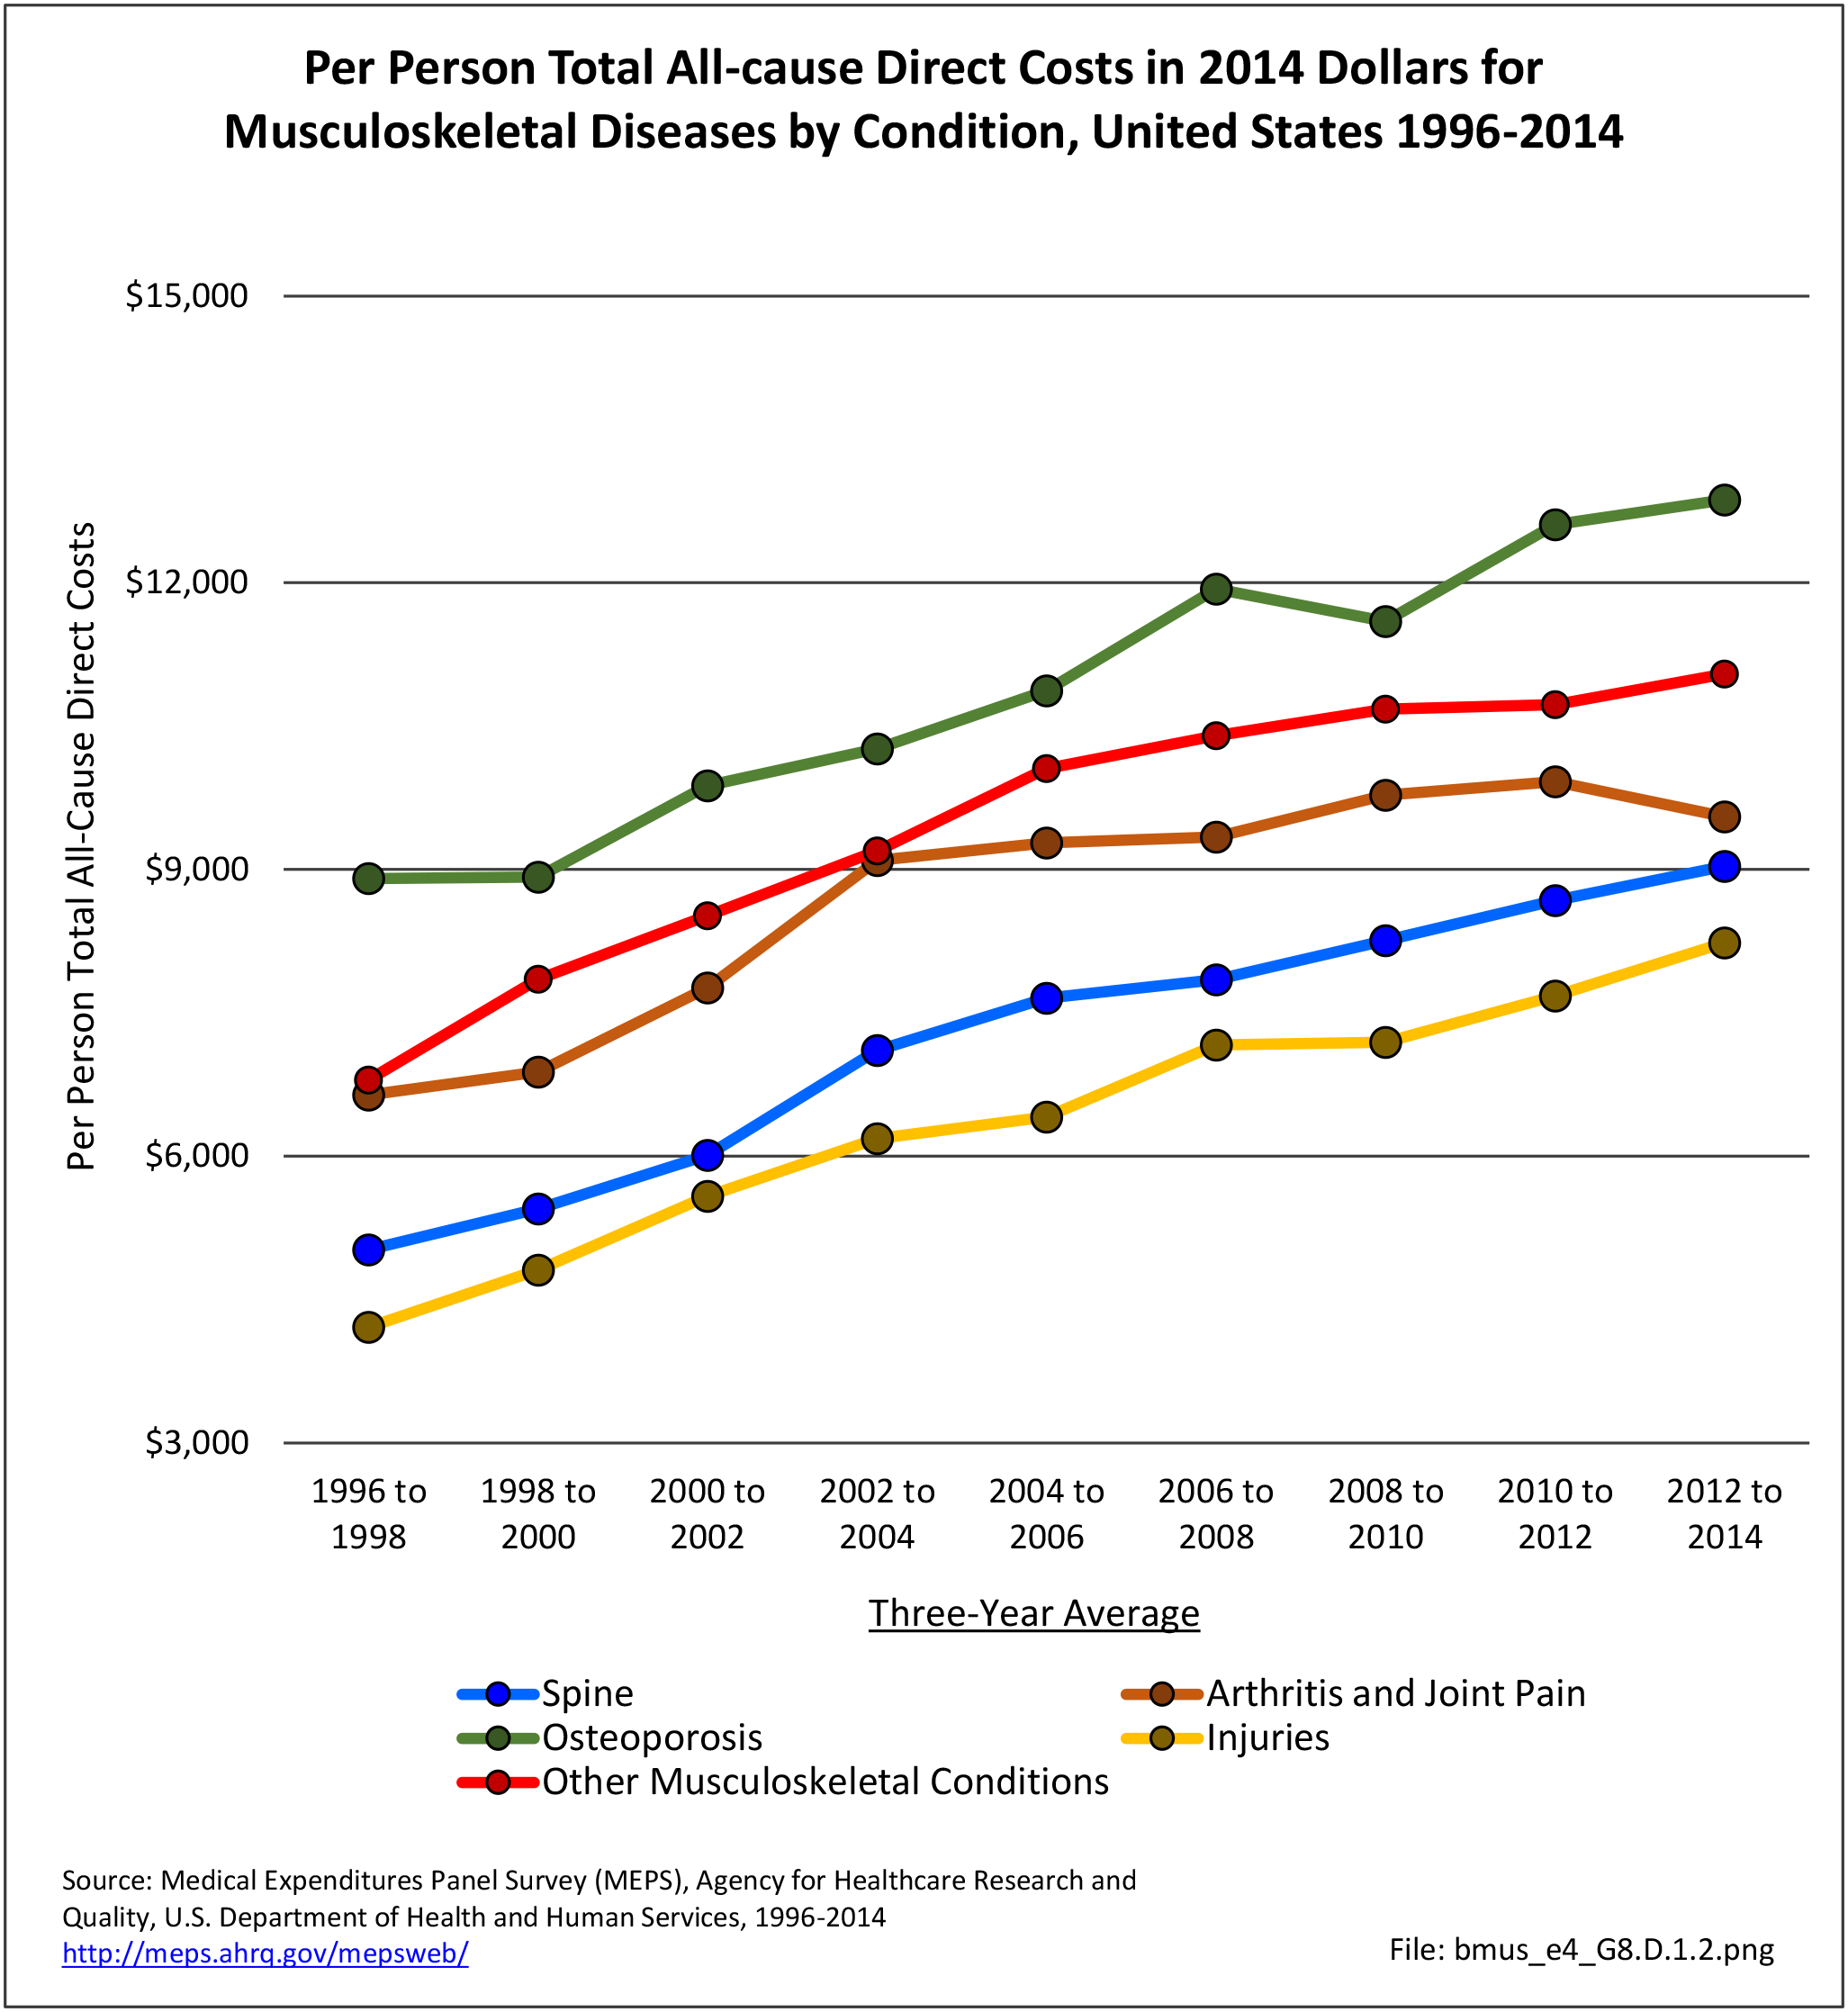
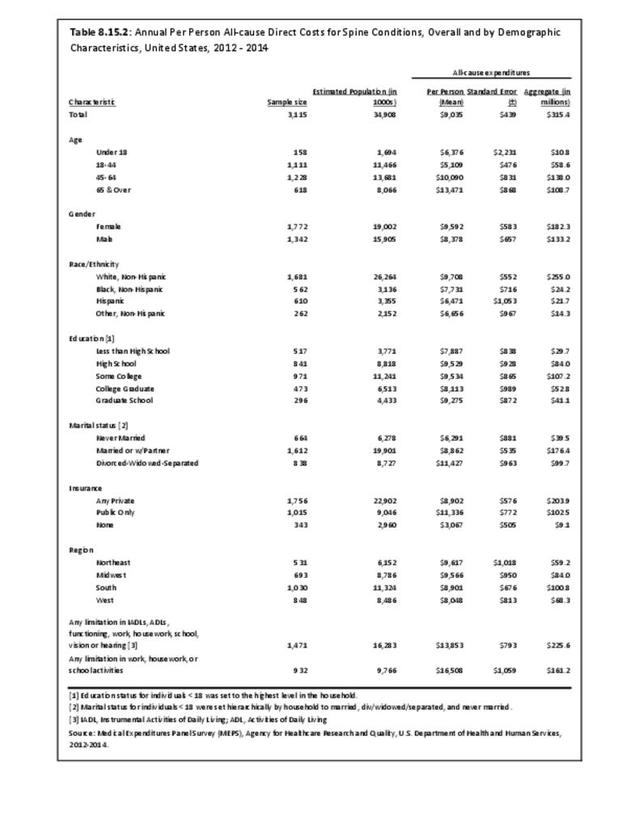
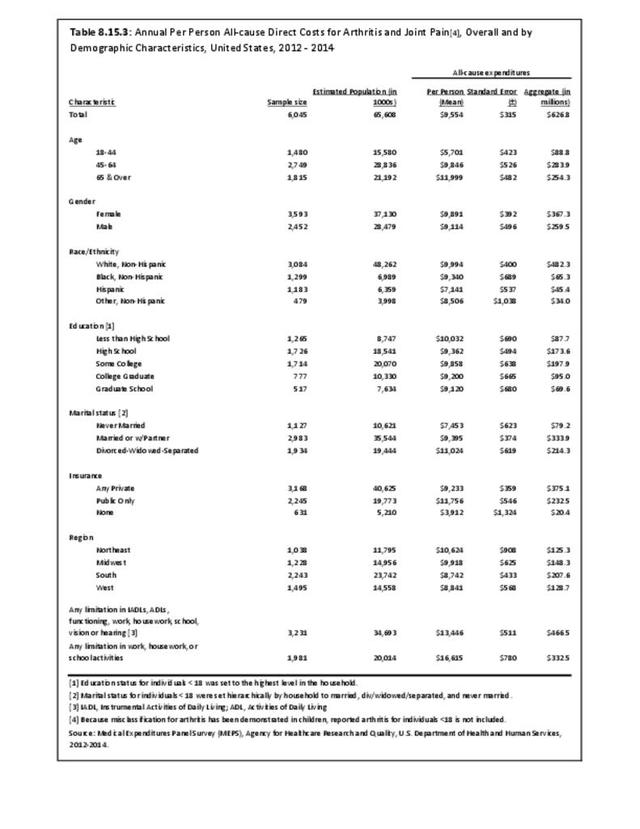
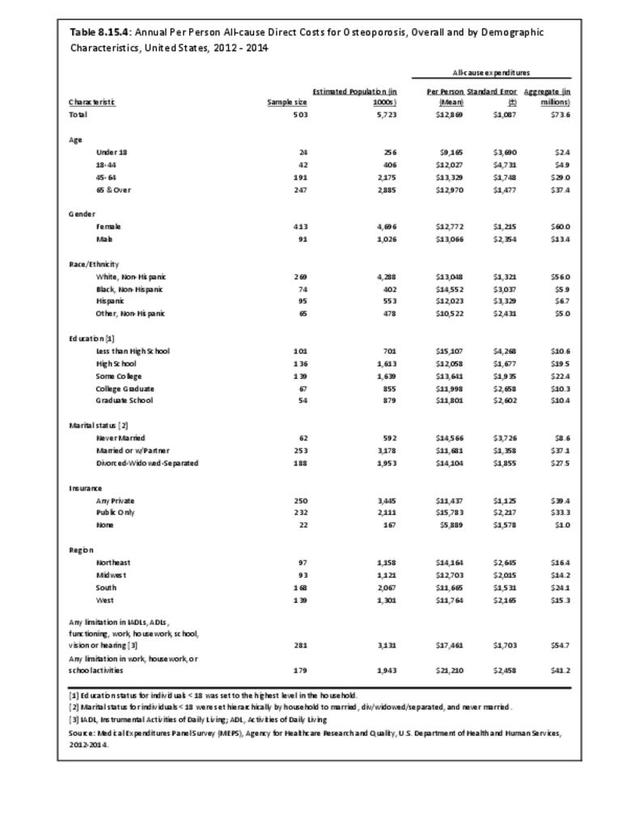
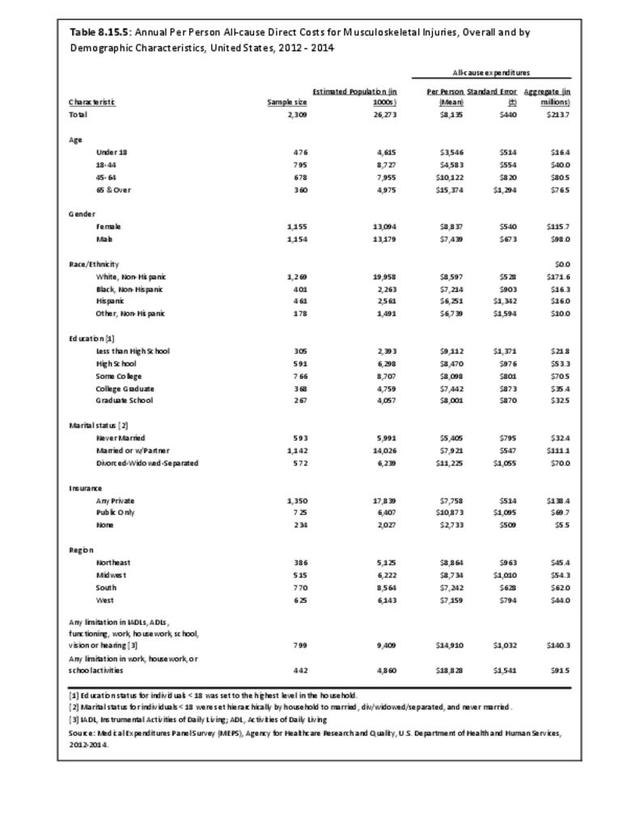
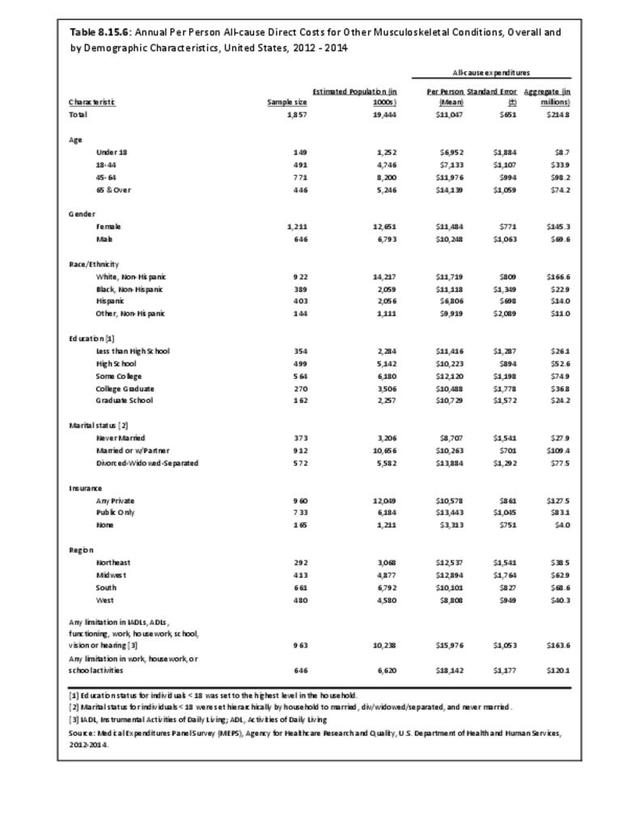
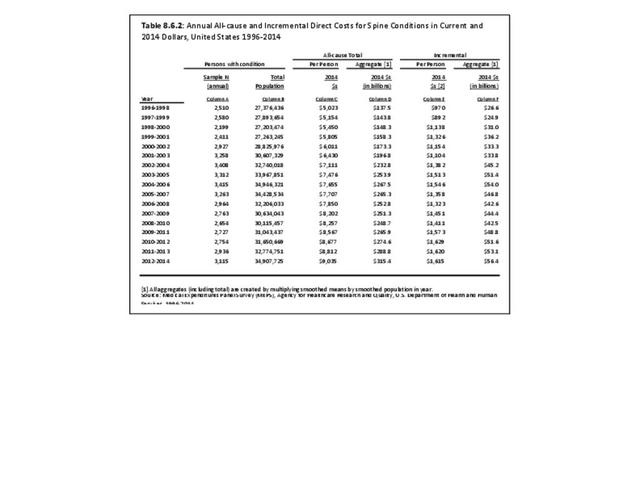
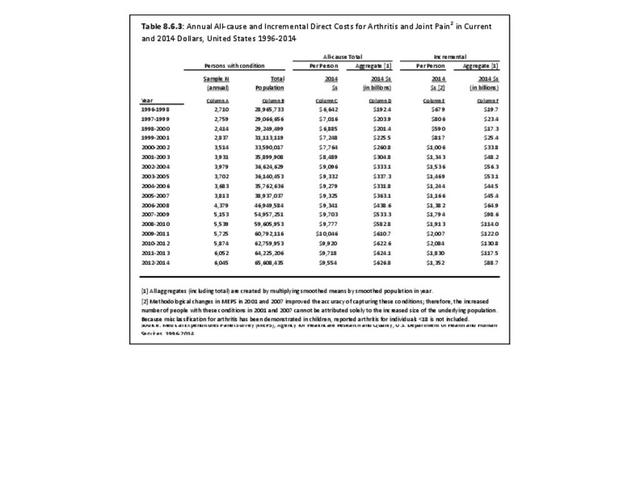
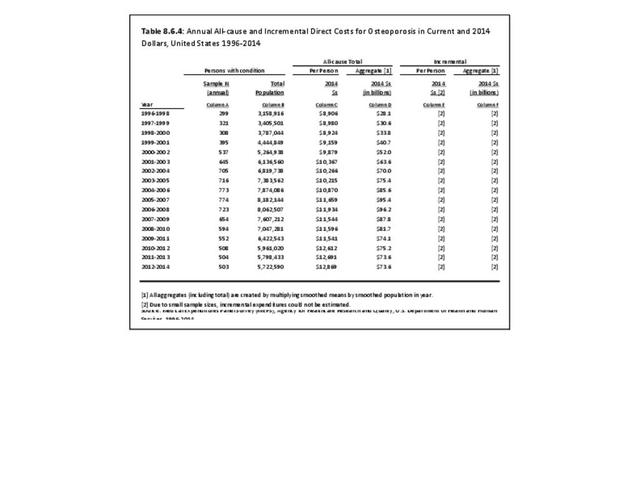
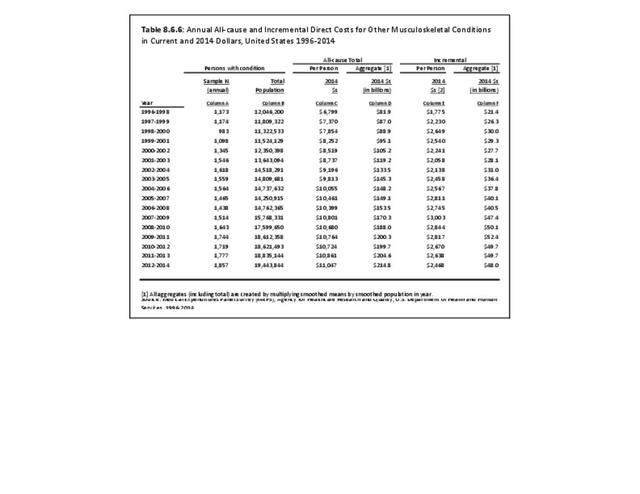
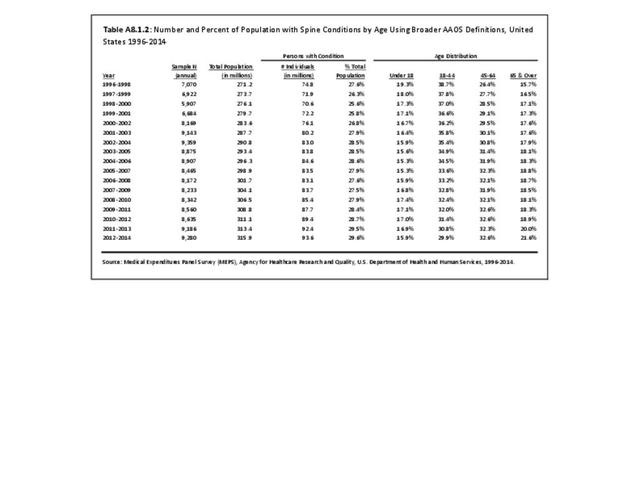
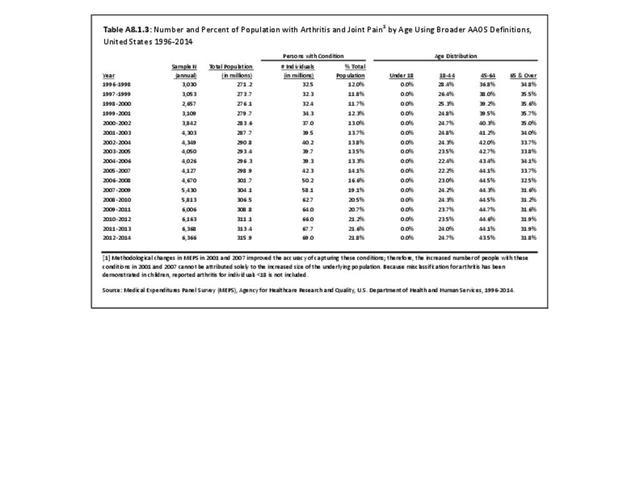
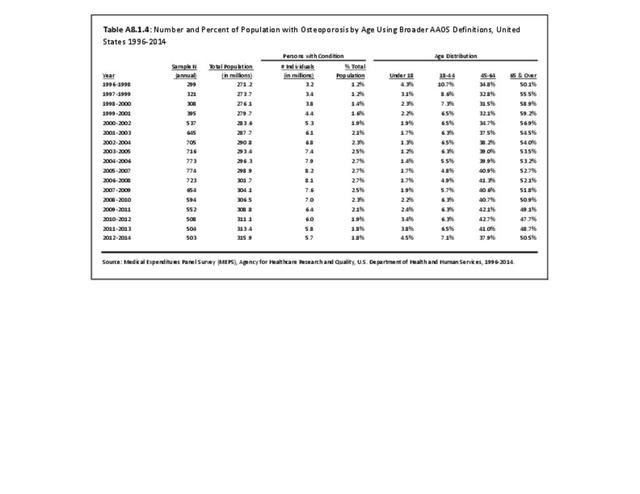
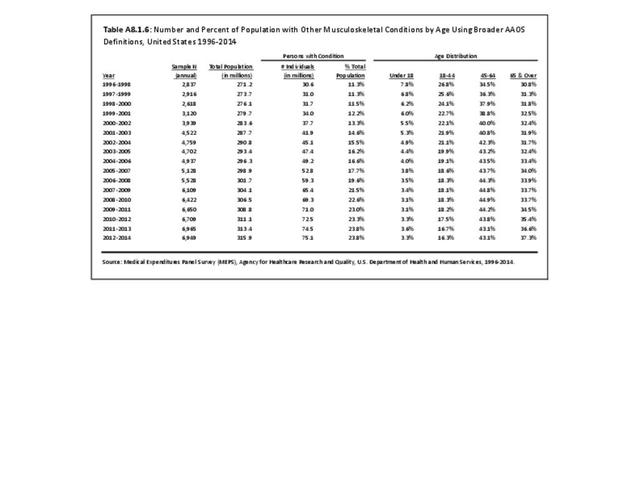
Because of the higher prevalence and relatively high level of expenditures per person, aggregate all-cause expenditures have consistently been greatest for arthritis and joint pain, accounting for $626.8 billion in healthcare costs in 2012-2014. Spine conditions, with an estimated $315.4 billion aggregate cost in 2012-2014, are the second most expensive musculoskeletal healthcare condition. Aggregate costs for injuries and other musculoskeletal conditions were $213.7 and $214.8 billion, respectively, in 2012-2014. Osteoporosis, with $73.6 billion, accounted for the lowest aggregate of all costs. Totals for subconditions, when summed, exceed the overall total due to the potential for persons to be included in more than one condition group.
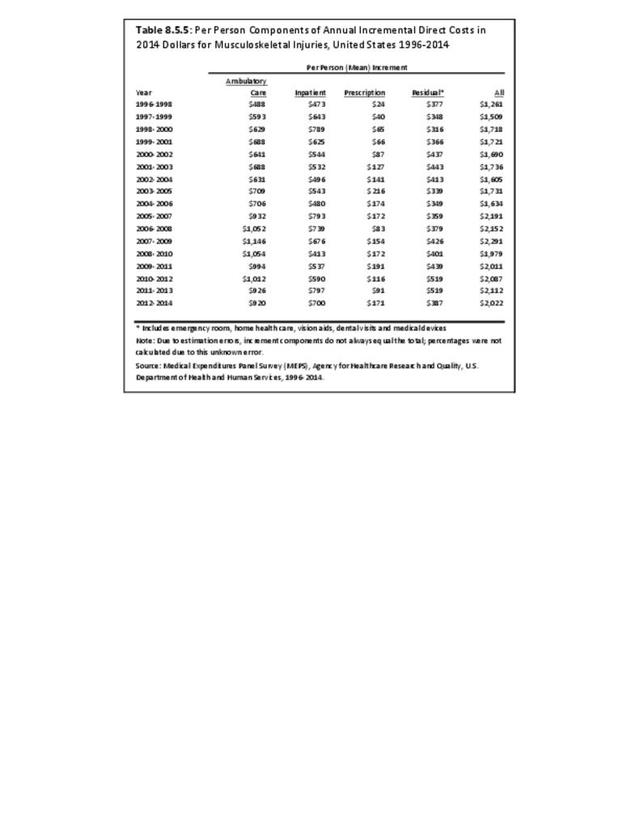
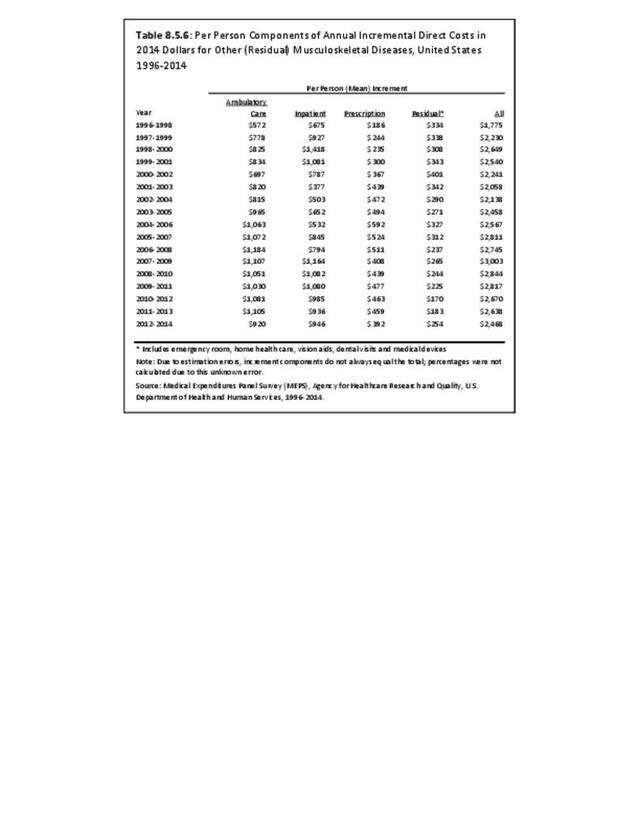
Sampling variability limits inference about time trends in incremental expenditures associated with the subcondition groups. However, while estimates do not have the same precision as those for all musculoskeletal diseases, it is fair to conclude that 2012-2014 aggregate incremental expenditures, at $88.7 billion, were largest for arthritis and joint pain. Further, aggregate incremental expenditures have increased substantially since 1996-1998 for all subcondition groups. (Reference Columns D and F, Table 8.6.2 PDF CSV; Table 8.6.3 PDF CSV; Table 8.6.4 PDF CSV; Table 8.6.5 PDF CSV; Table 8.6.6 PDF CSV)

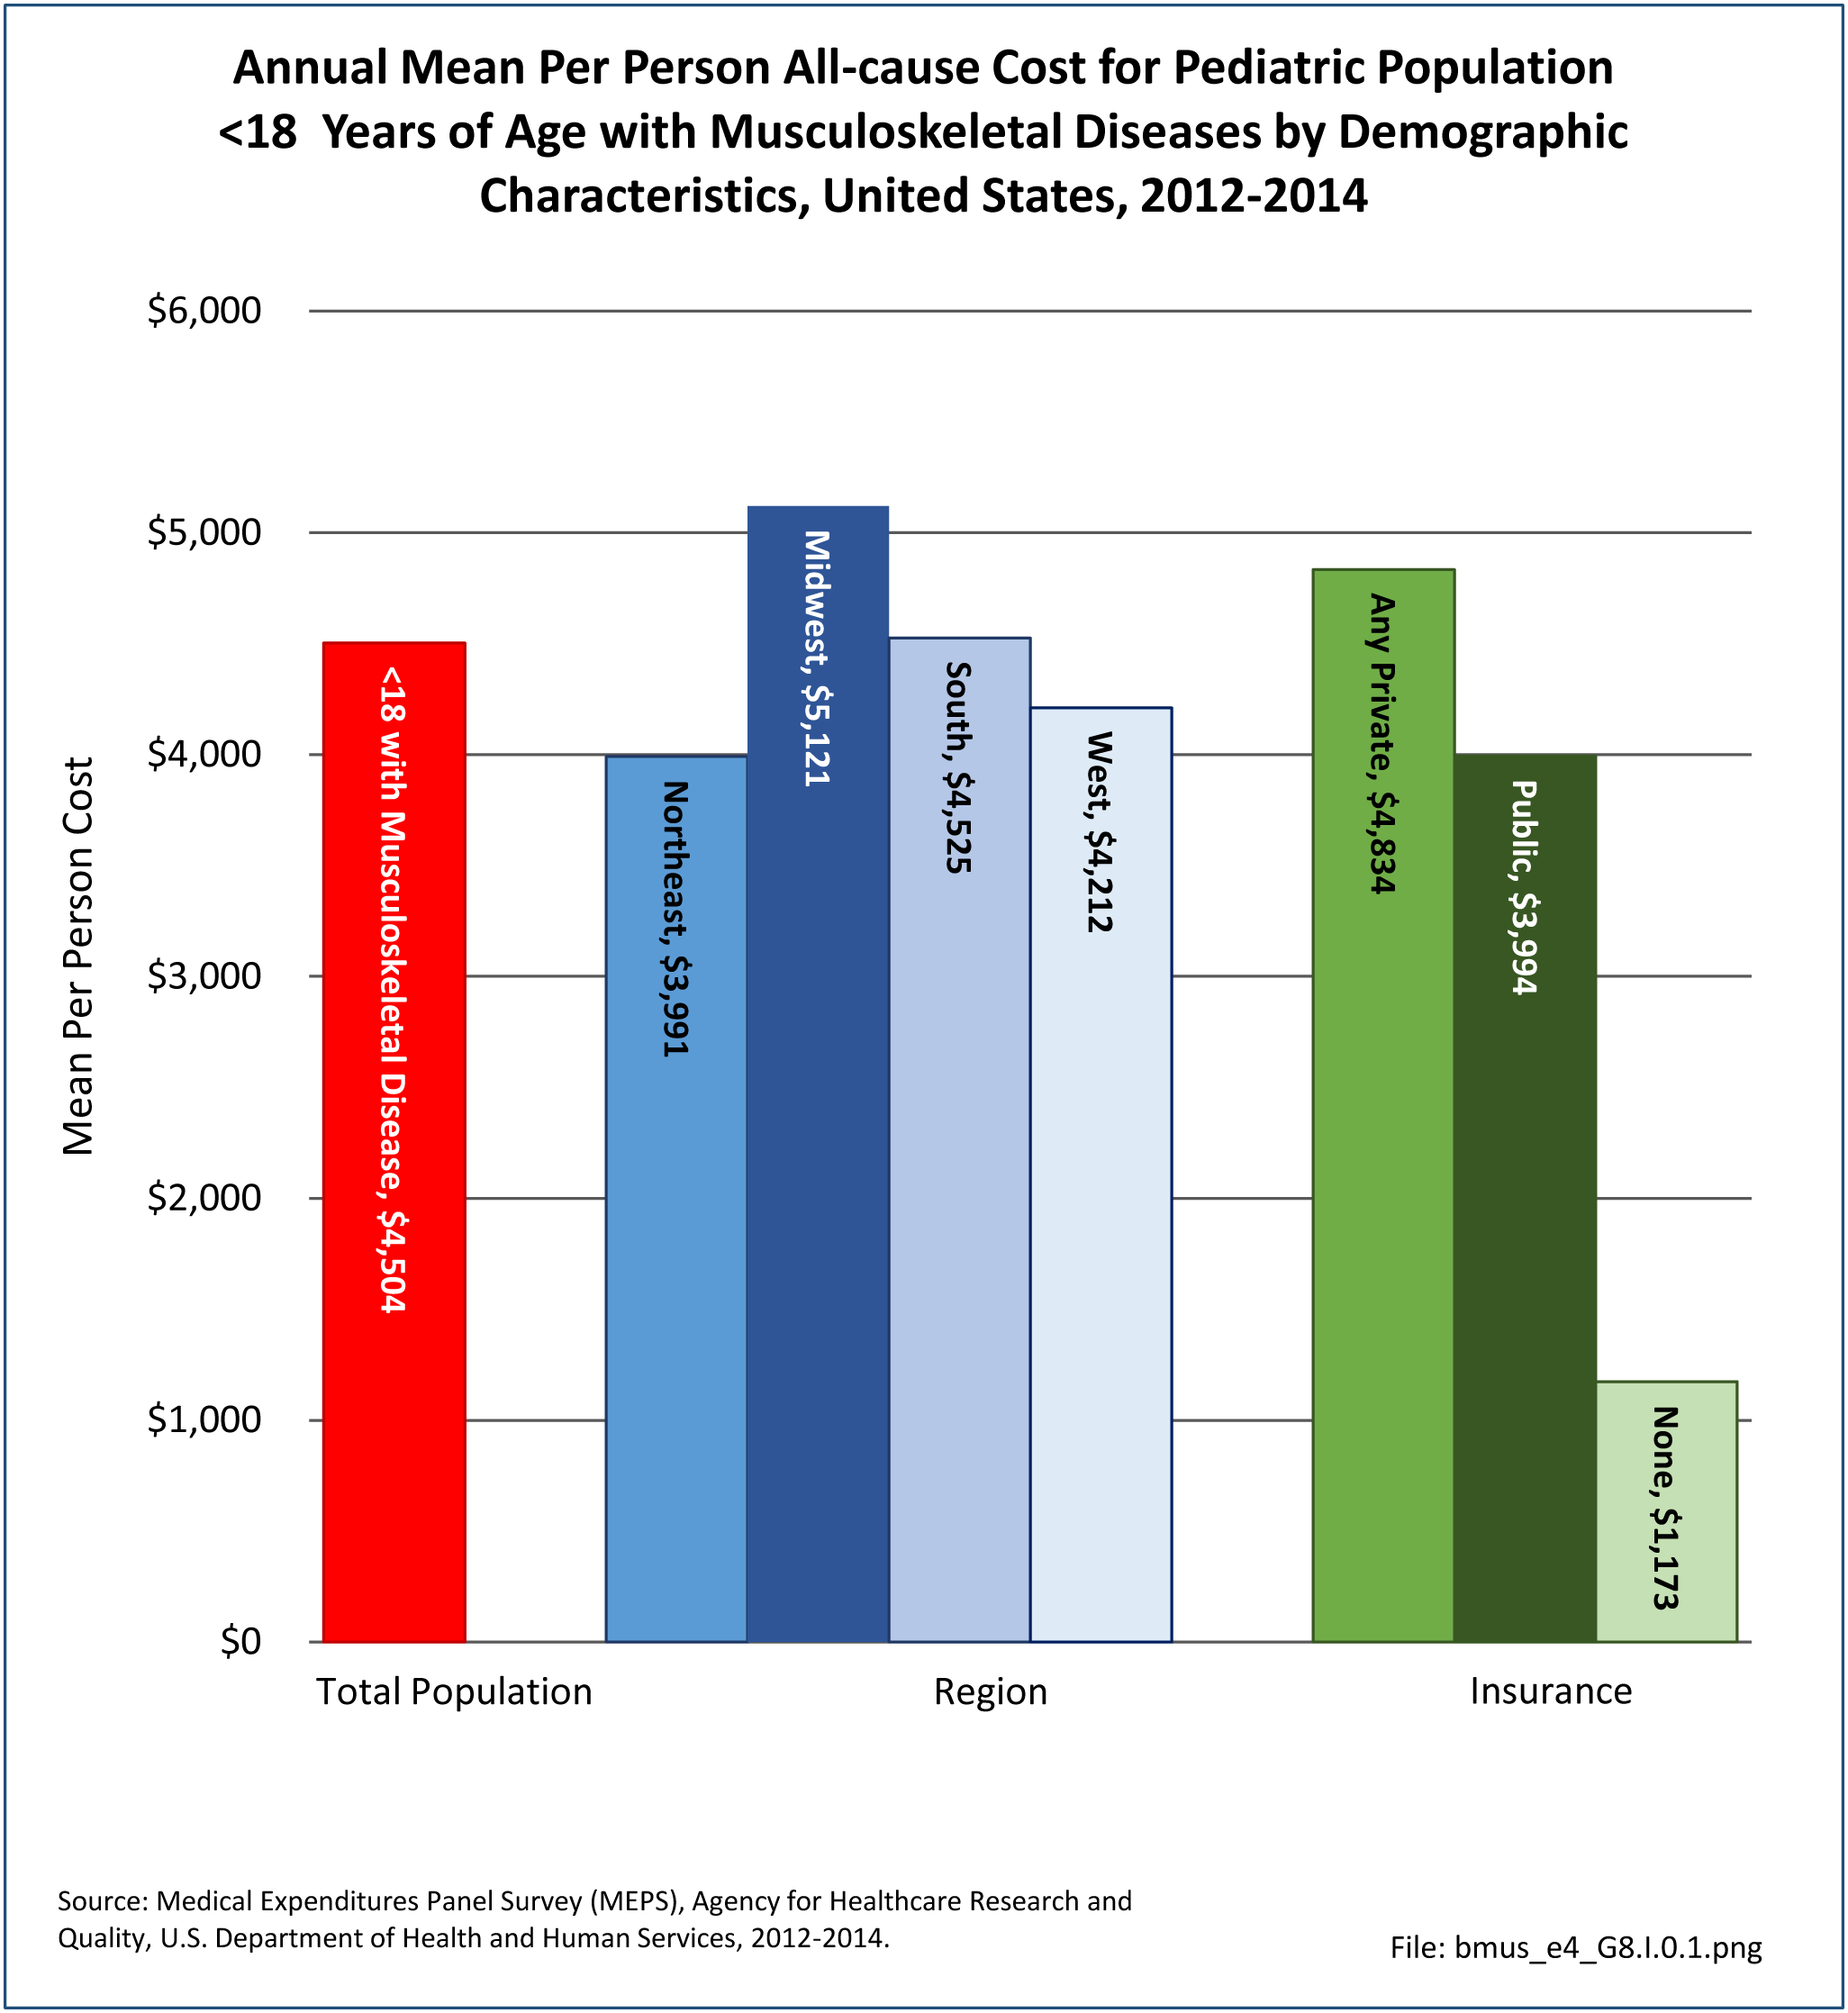
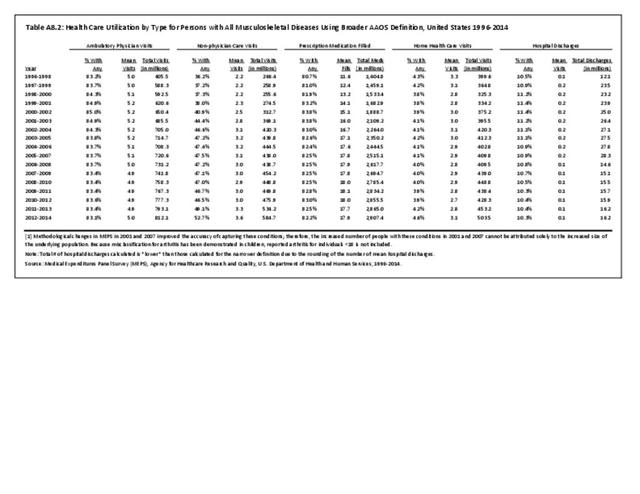
By Insurance and Limitation Status
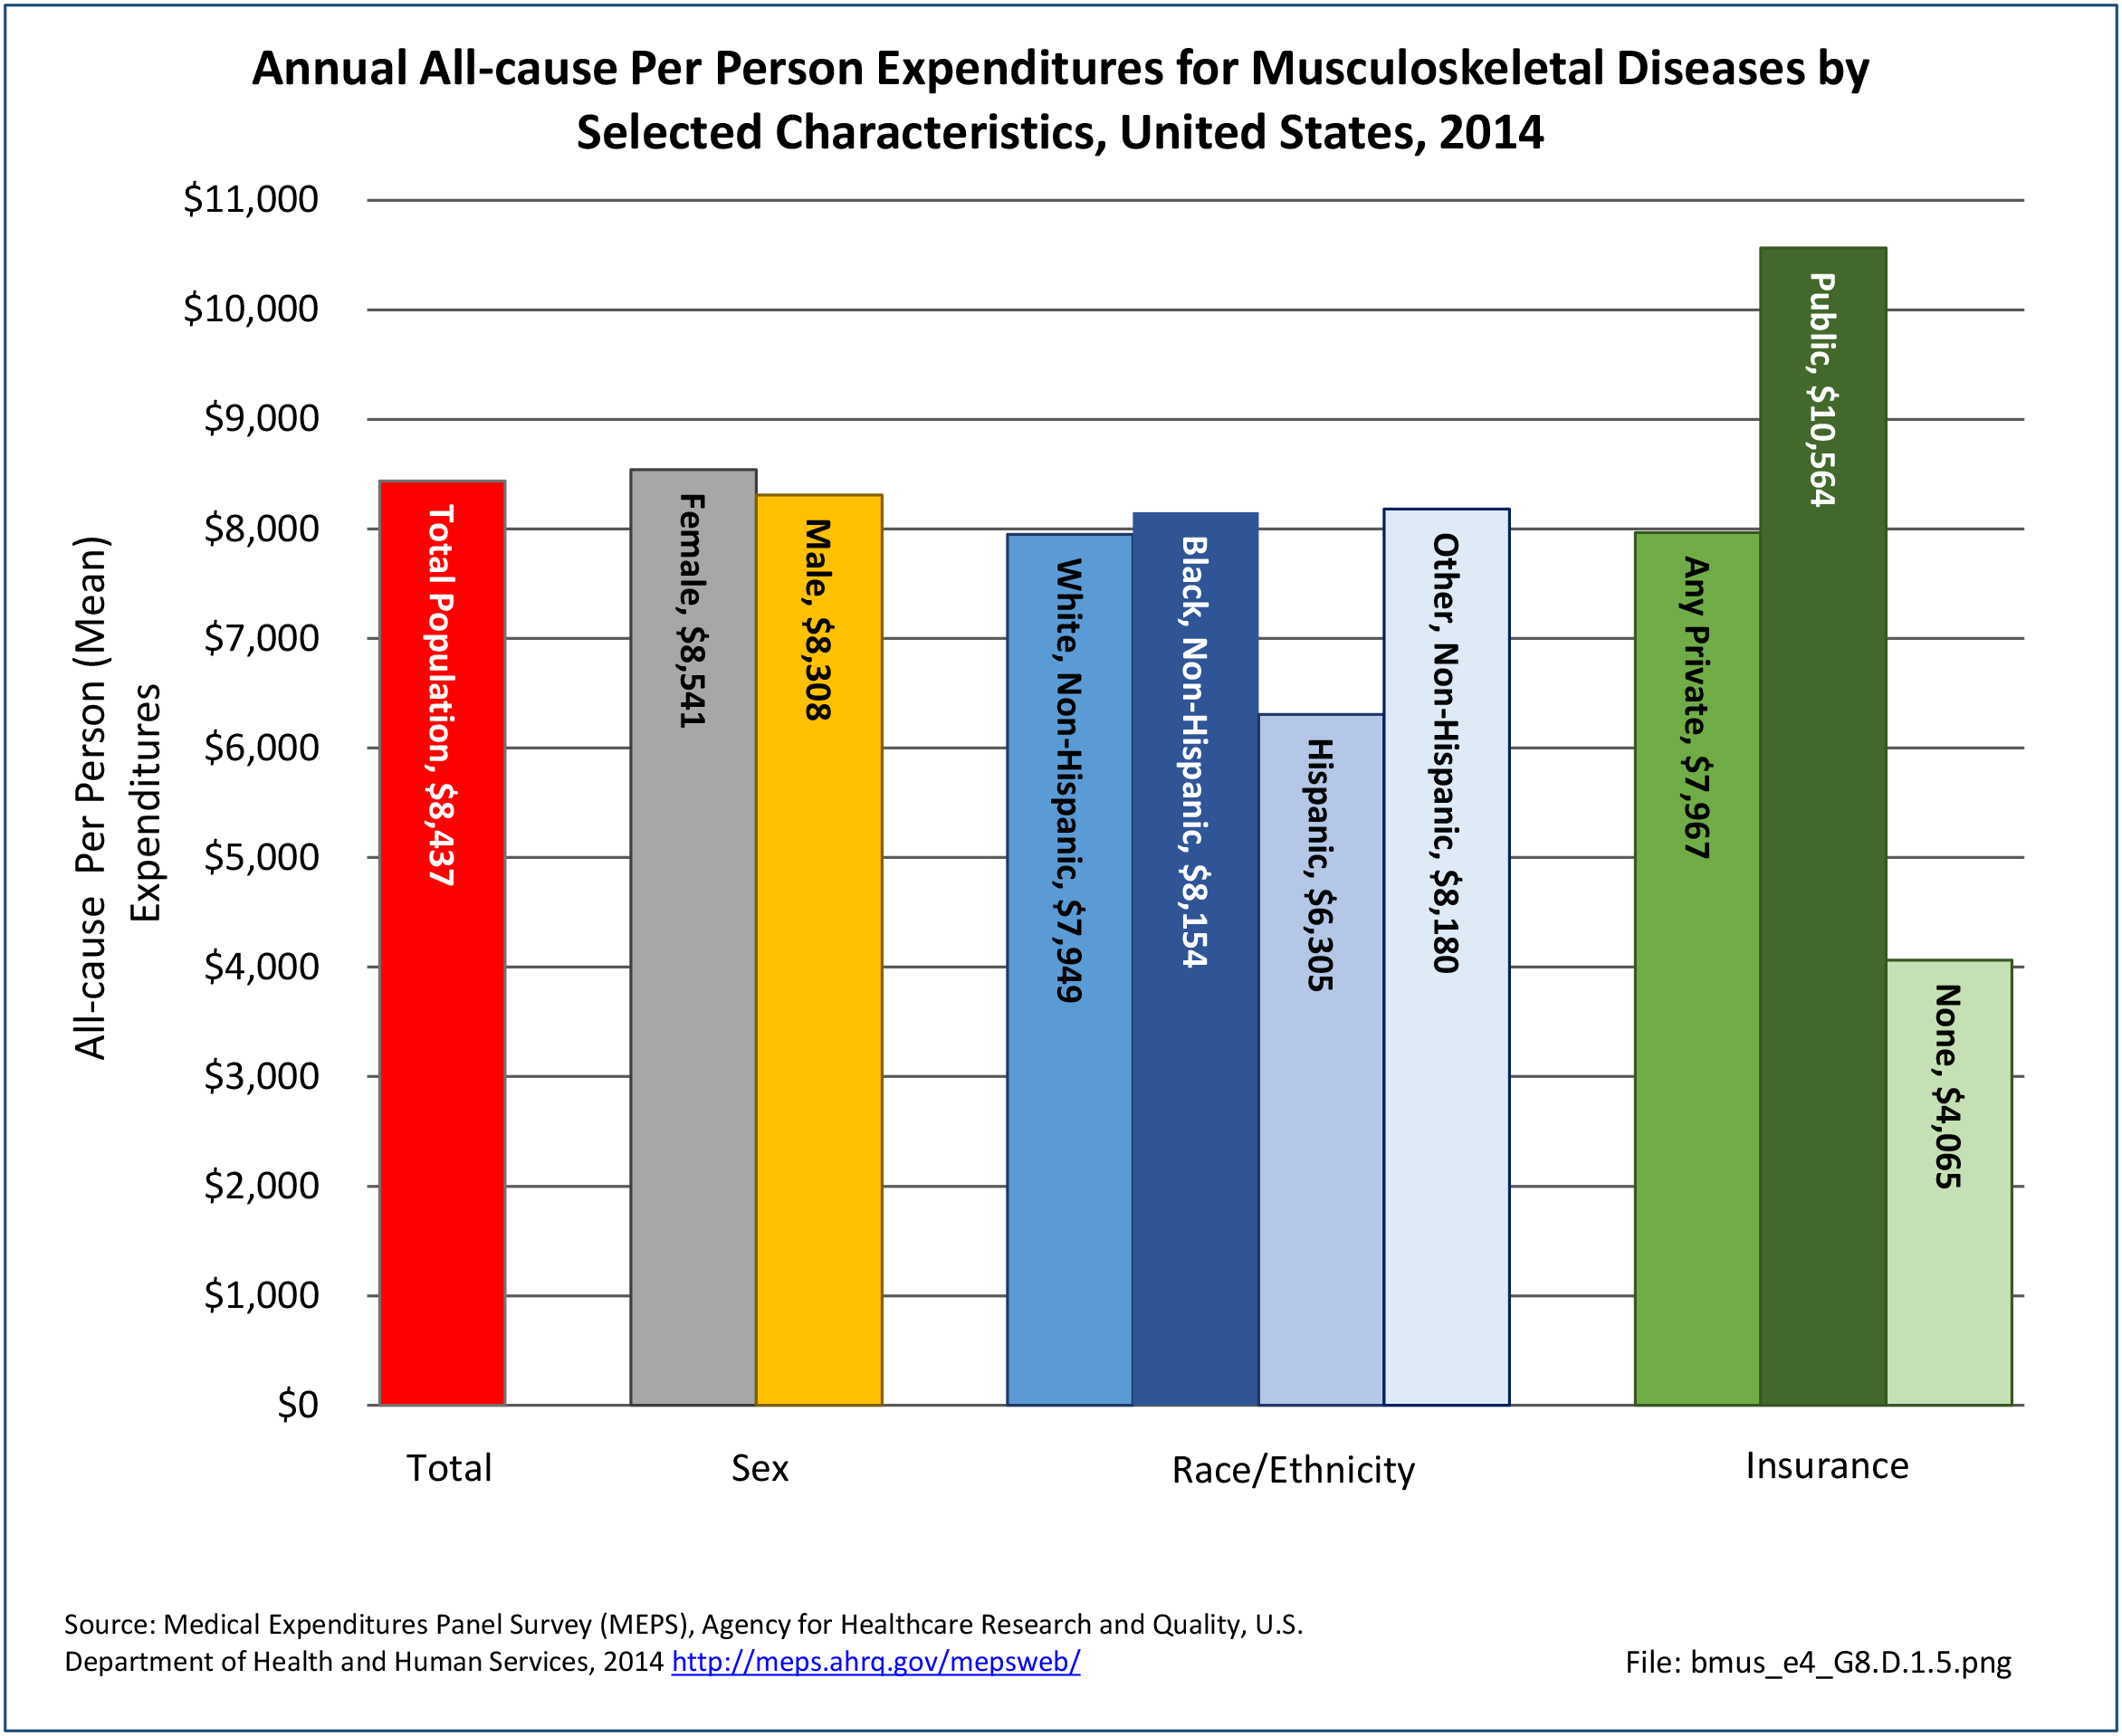
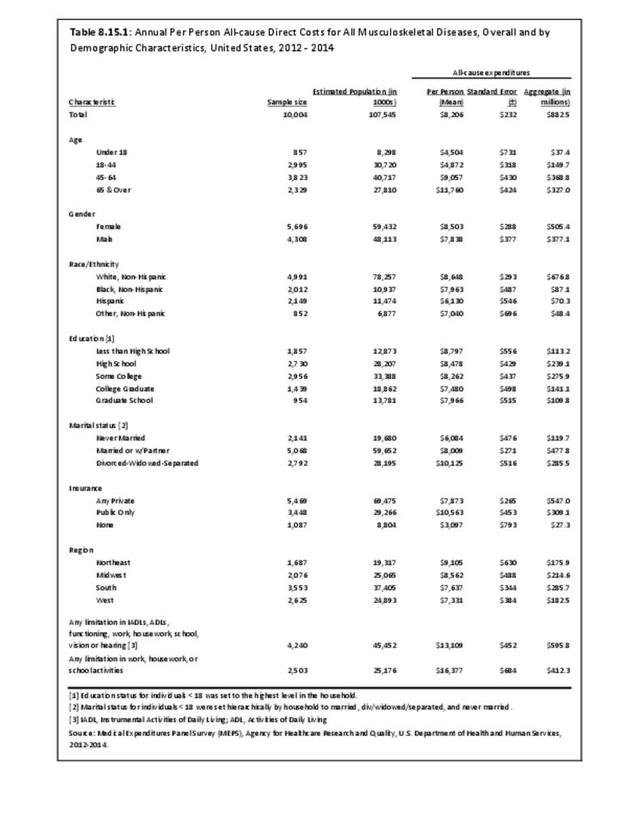
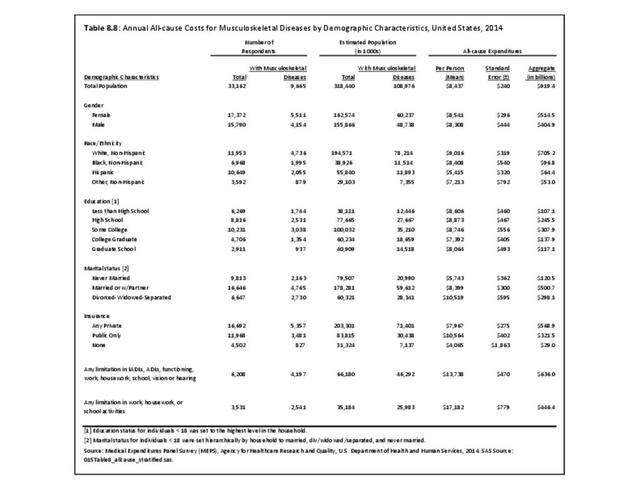
Unlike other tables on economic costs of musculoskeletal conditions that use an average of three years of data for sequential years, analysis based on demographic characteristics uses a single year, resulting in 2014 costs that are somewhat different than those for 2012-2014.
In 2014, aggregate all-cause expenditures for musculoskeletal conditions totaled $919.4 billion, slightly higher than the 2012-2014 total. Because per person all-cause expenditures were lower among those without insurance ($4,065), aggregate expenditures on behalf of the approximately 7.1 million without insurance were only $29.0 billion; the bulk of the aggregate expenditures occurred among the 71.4 million with private insurance ($568.9 billion) or the 30.4 million with public insurance ($321.5 billion).
Of the almost 109 million persons with musculoskeletal diseases in 2014, 46.3 million (42.5%) reported a limitation in functioning, work, housework, or school, or had a limitation in vision and hearing. Such persons incurred aggregate all-cause expenditures of $636.0 billion, or 69.2% of all aggregate expenditures for musculoskeletal diseases. Slightly fewer (about 26 million, 23.8% of persons with musculoskeletal diseases) reported only limitation in work, housework, or school; such persons incurred $446.4 billion, or 48.6% of all-cause aggregate expenditures for these conditions. (Reference Table 8.8 PDF CSV)

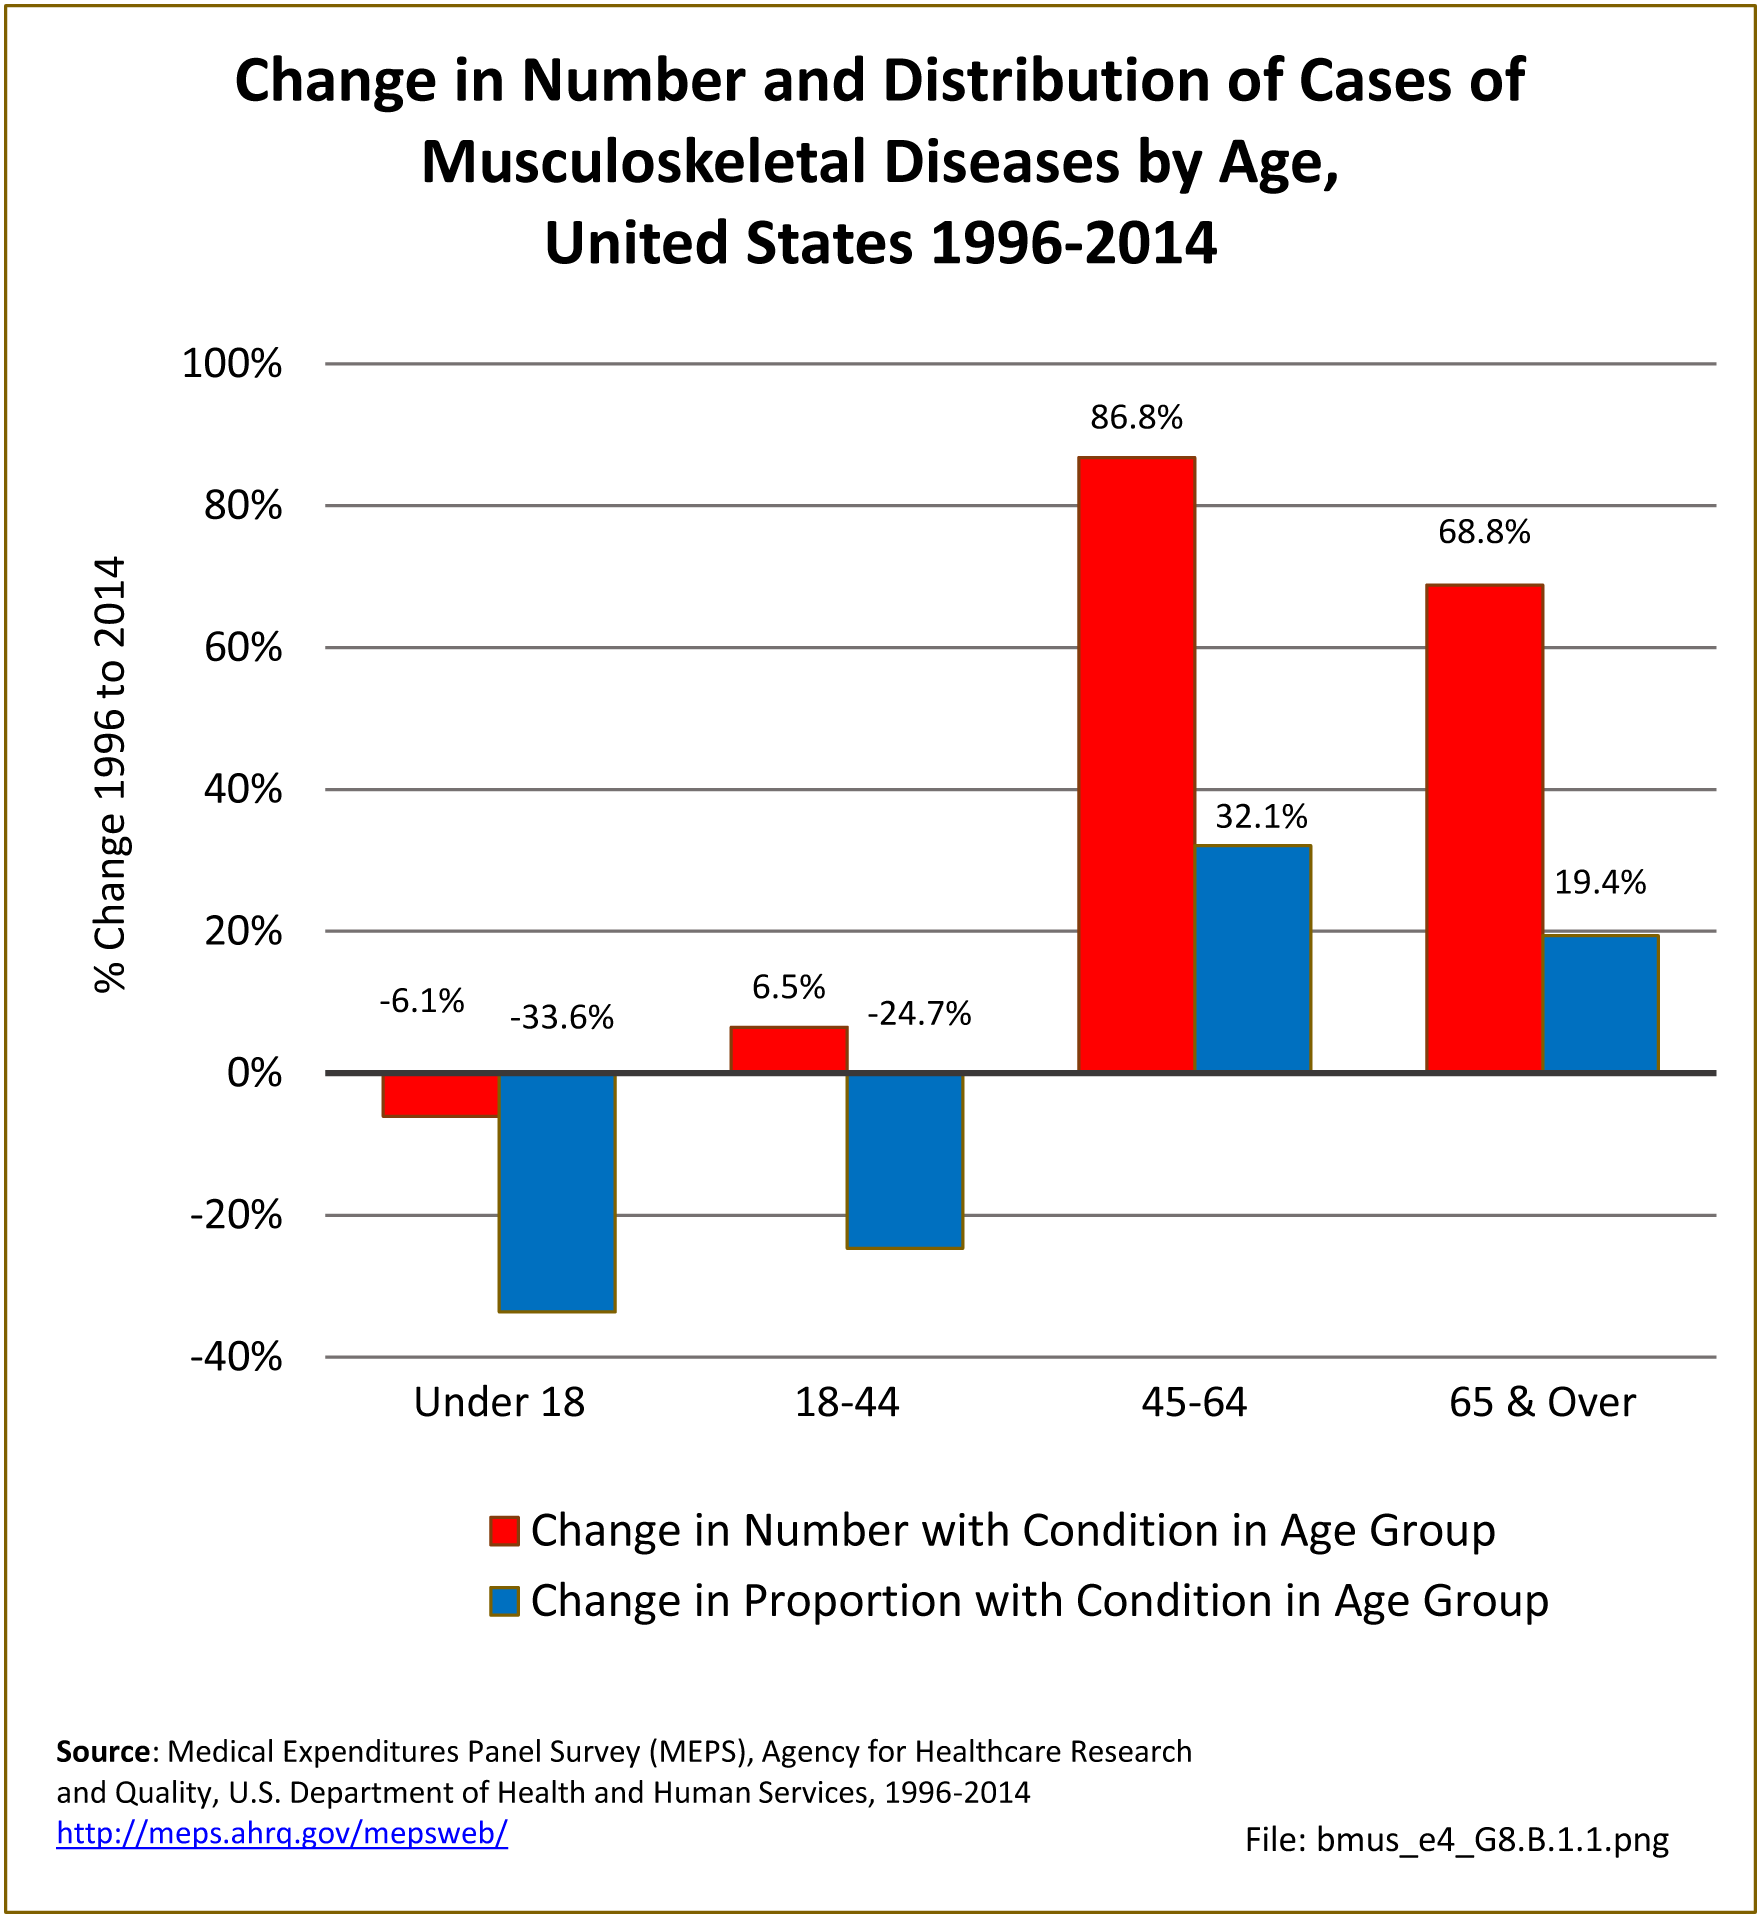
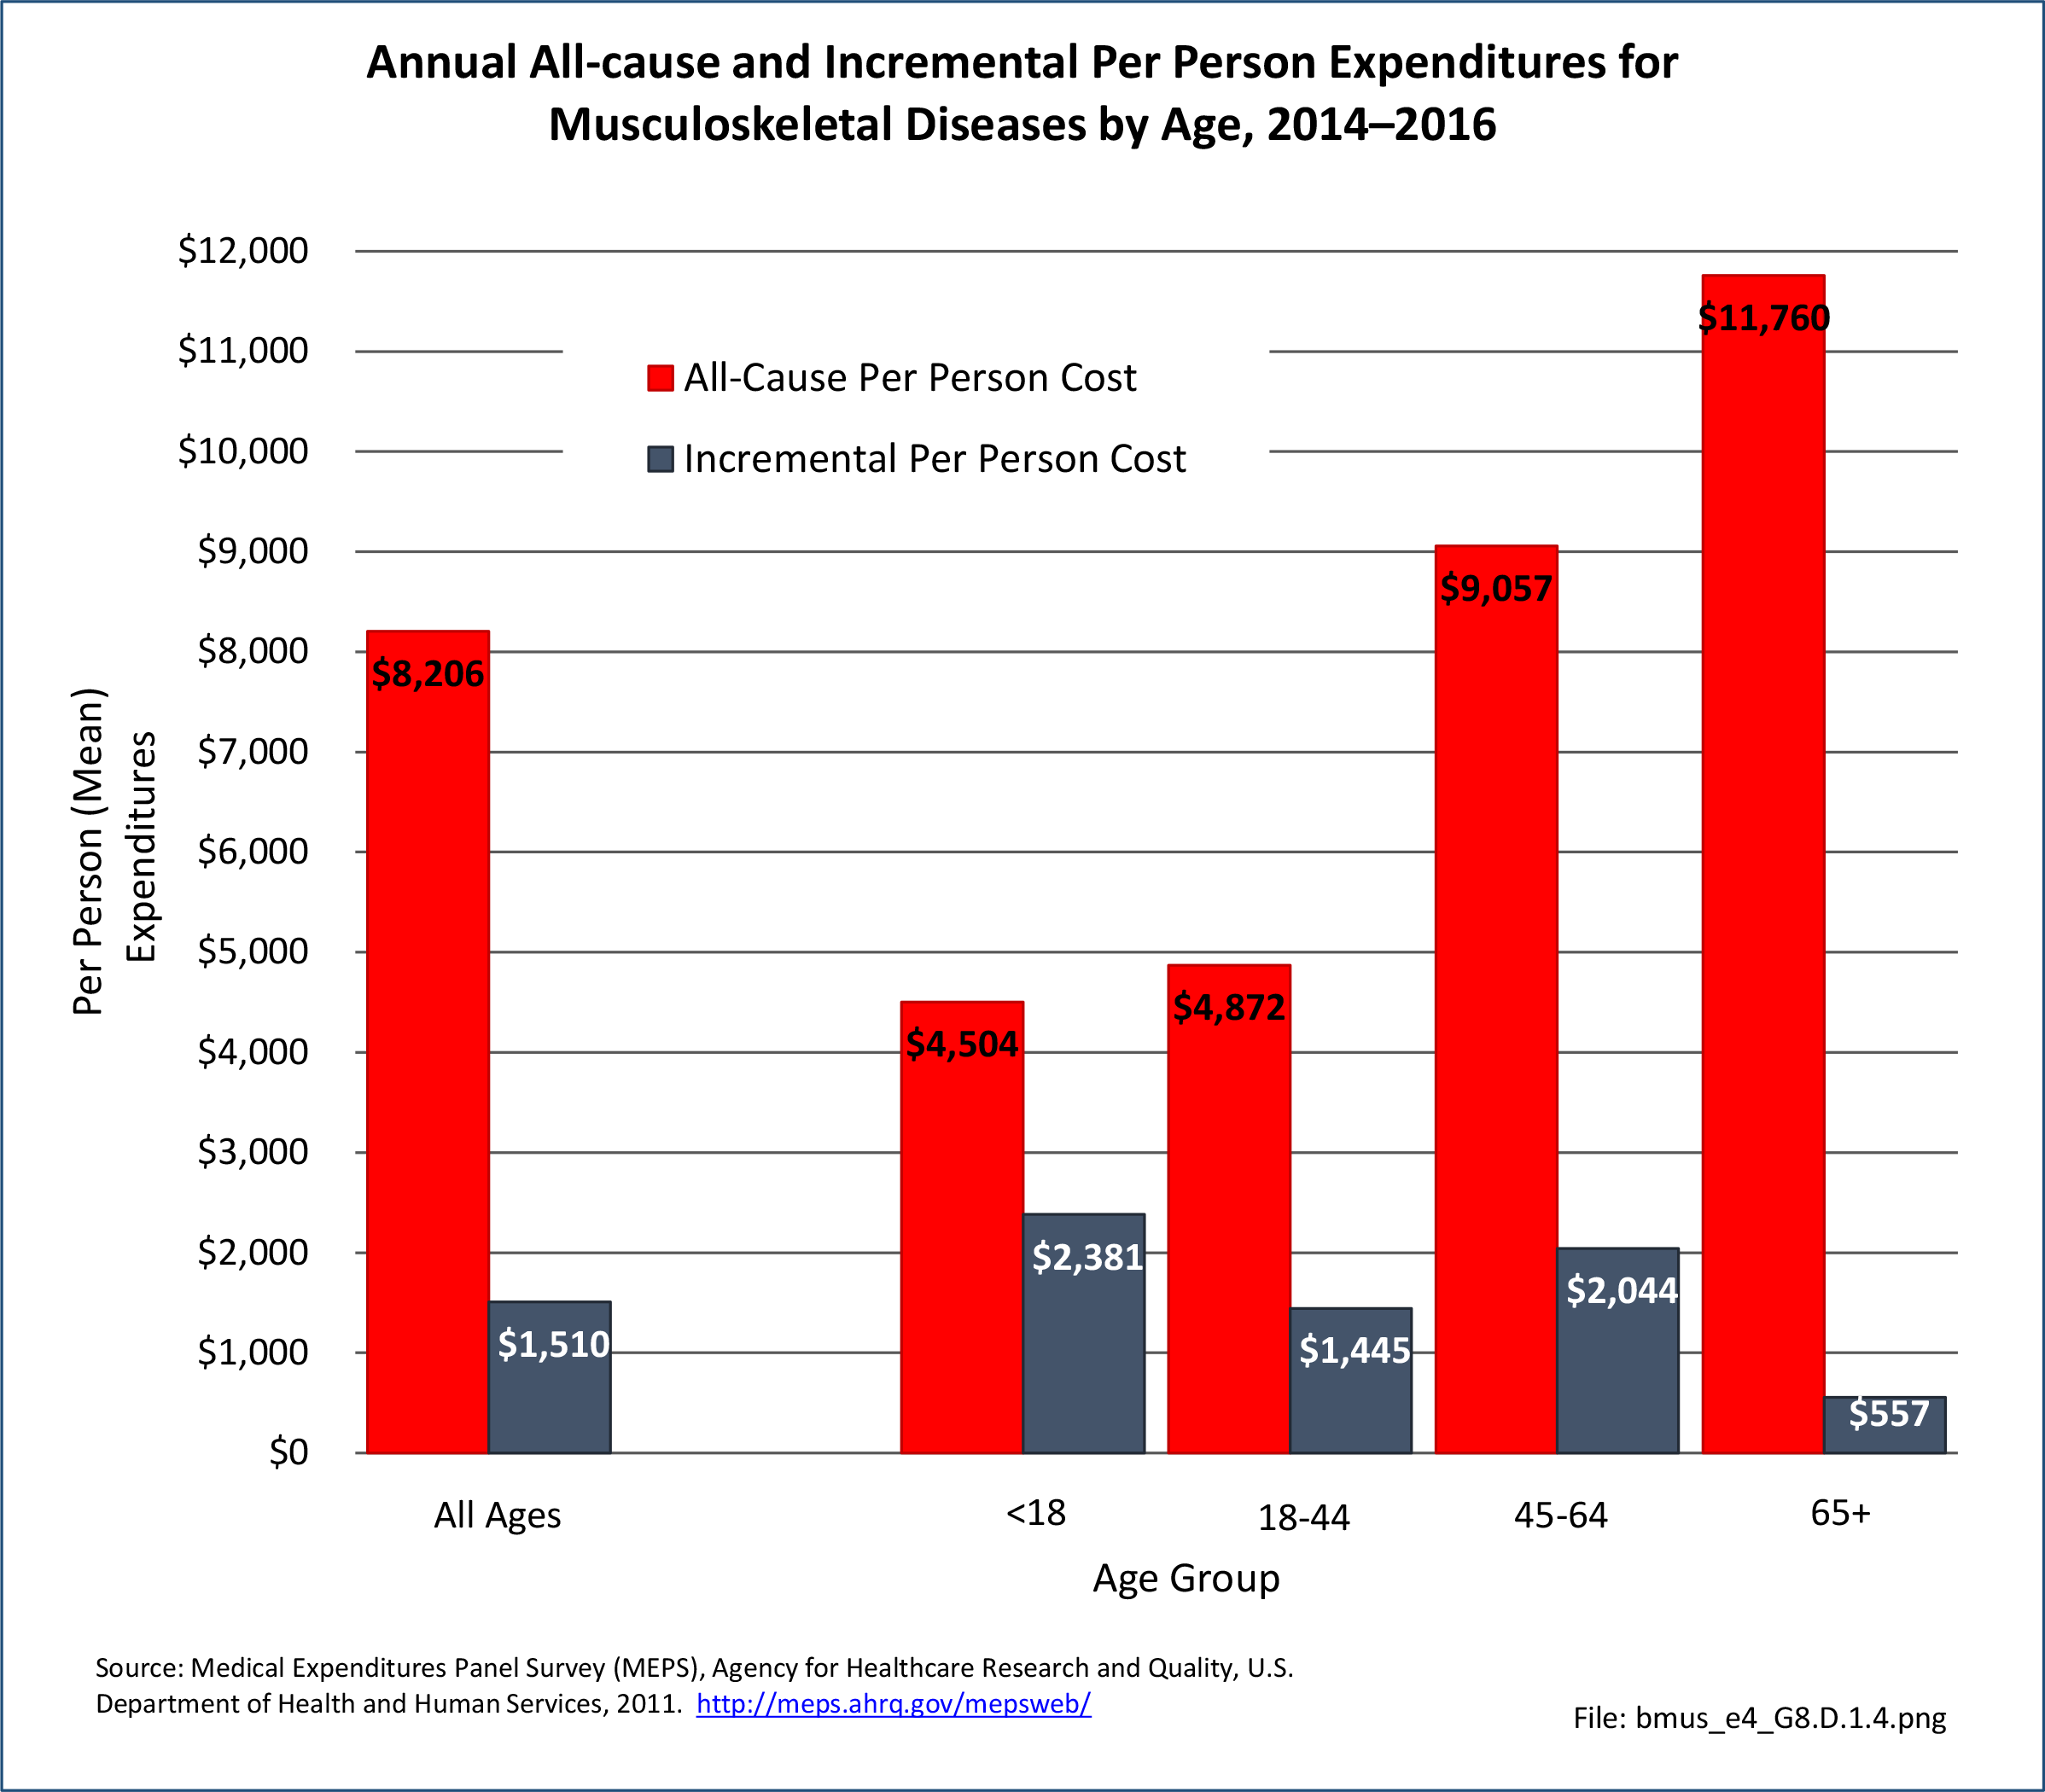
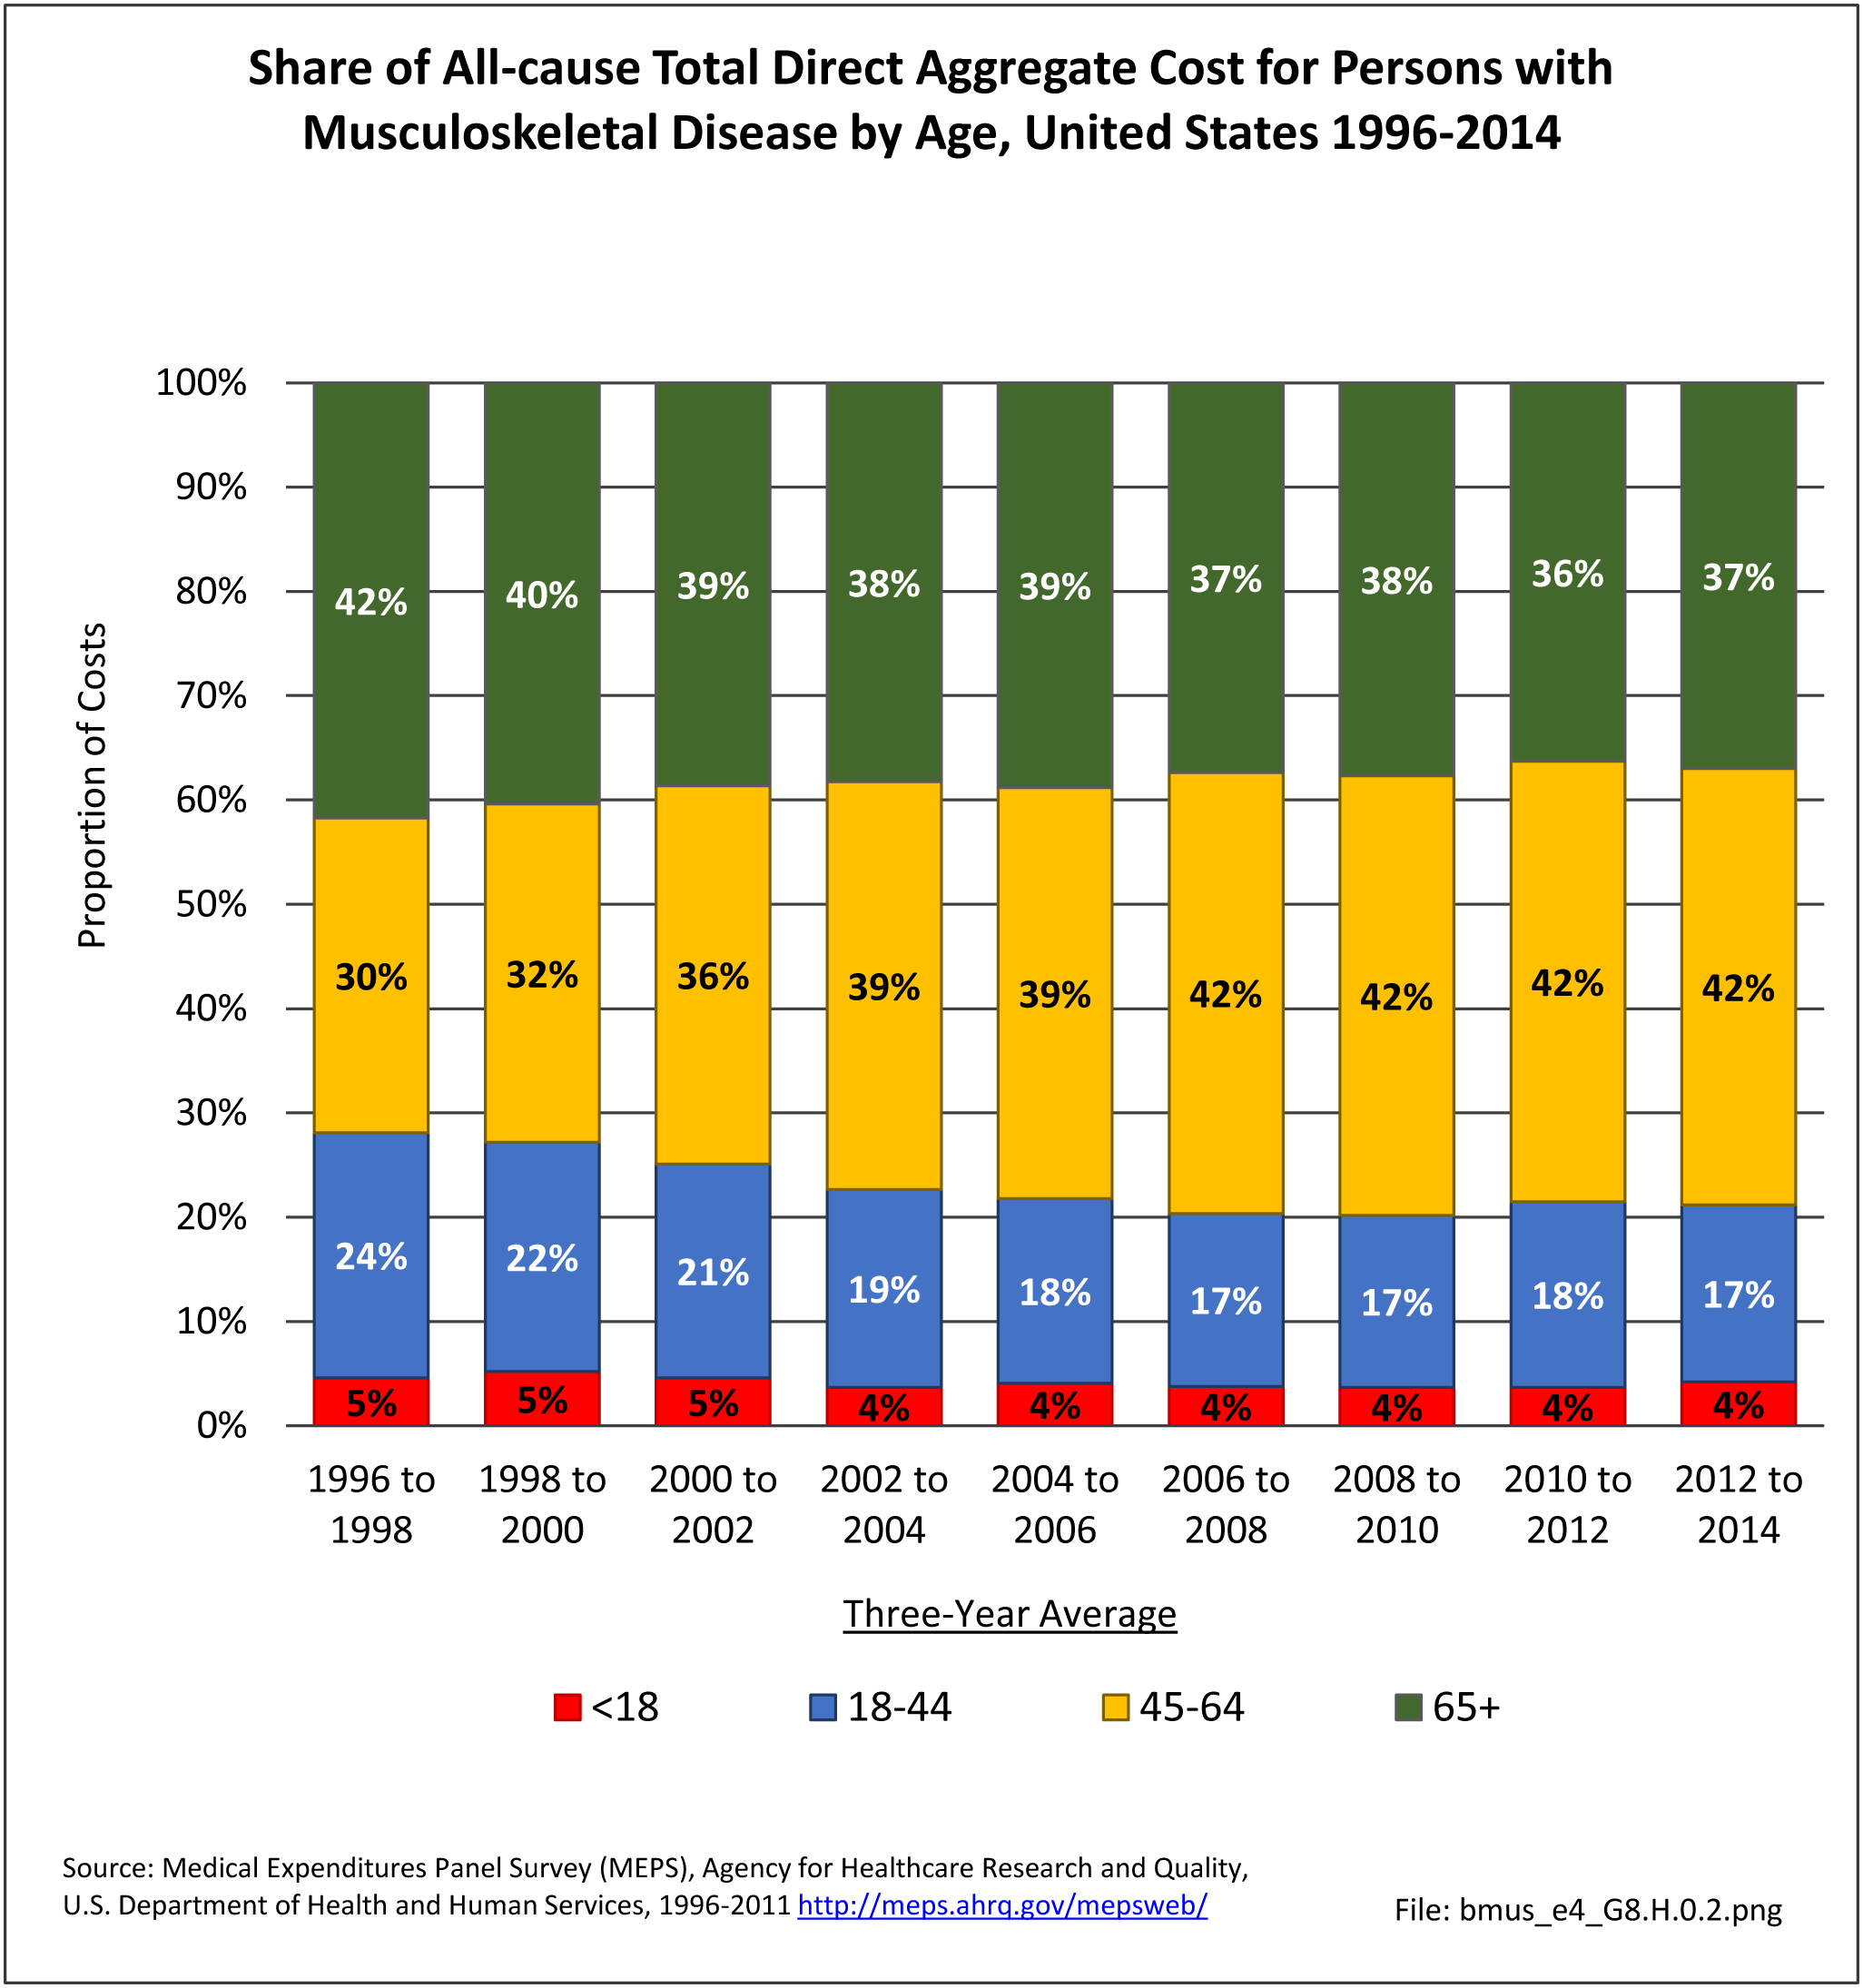
By Age
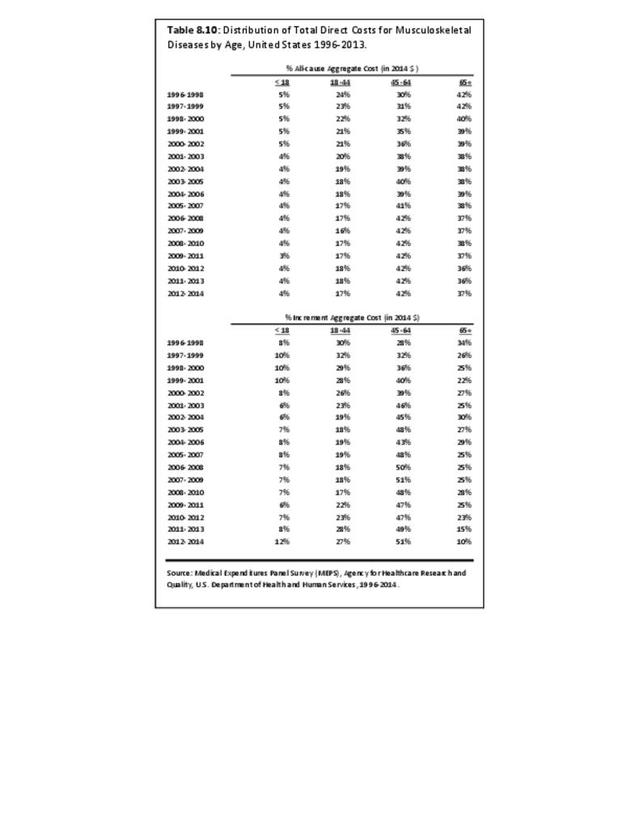
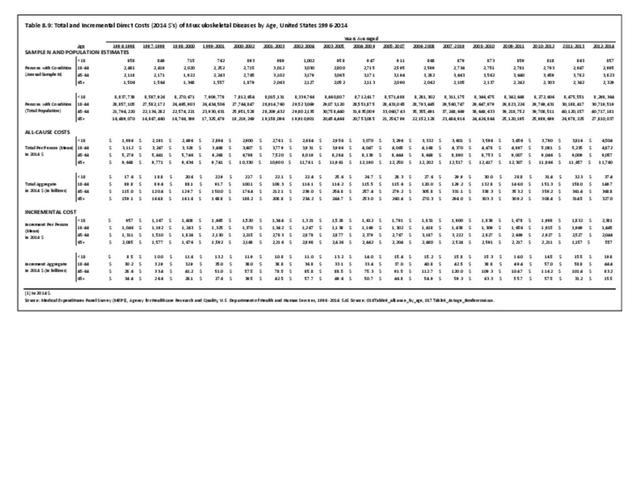
Aggregate costs by age group generally reflect the trends previously described in per person expenditures, except for total all-cause aggregate costs. Although persons aged 65 and over had the highest mean per person cost, persons aged 45-64 accounted for the largest share of aggregate costs due to the large size of this cohort. (Reference Table 8.9 PDF CSV)

Edition:
- Fourth Edition