Osteoarthritis (OA) is widely recognized as the most common form of arthritis, and a major cause of pain and disability among US adults. Estimates of prevalence vary depending on how OA is defined: radiographic, symptomatic radiographic, or symptomatic only (self-reported presence of pain, aching, or stiffness). Radiographic OA is reported at higher prevalence levels than symptomatic, but symptomatic OA is more often cited from the self-reported databases.
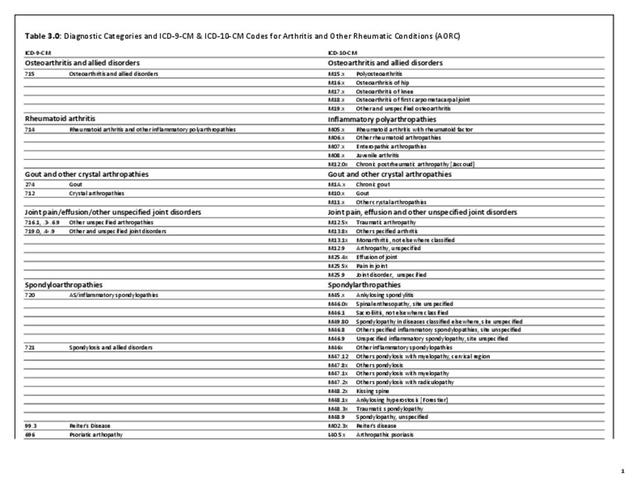
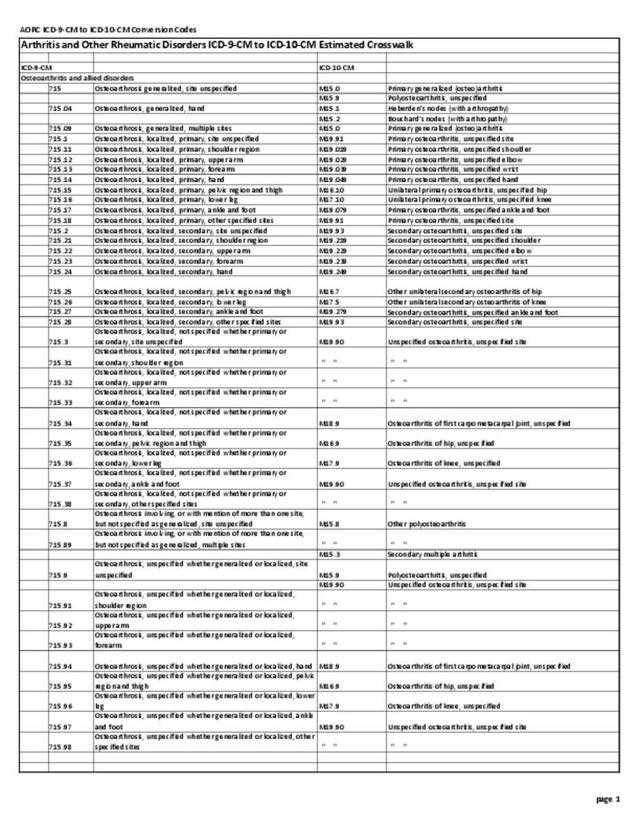
From 2008 to 2014, 32.5 million US adults, or one in seven persons (14%), reported osteoarthritis and allied disorders, including joint pain with other specified or unspecified arthropathy, (herein called “osteoarthritis”) annually. Per previous research on the definition of osteoarthritis in the Medical Expenditure Panel Survey (MEPS),1 OA was defined as the presence of ICD-9-CM code 715 or a self-reported diagnosis of arthritis excluding rheumatoid arthritis and presence of ICD-9-CM 716 or ICD-9-CM 719. (Reference Table 8.13 PDF CSV)
Across socio-demographic and health status characteristics, the following five groups represented the largest number of adults with OA by demographic classification: non-Hispanic whites (25.3 million), middle age (45-64 years) (14.8 million) or older adults (≥ 65 years) (13.8 million), those with private insurance (18.8 million), and those who were married/had a partner (17.8 million). (Reference Table 8.22 PDF CSV)

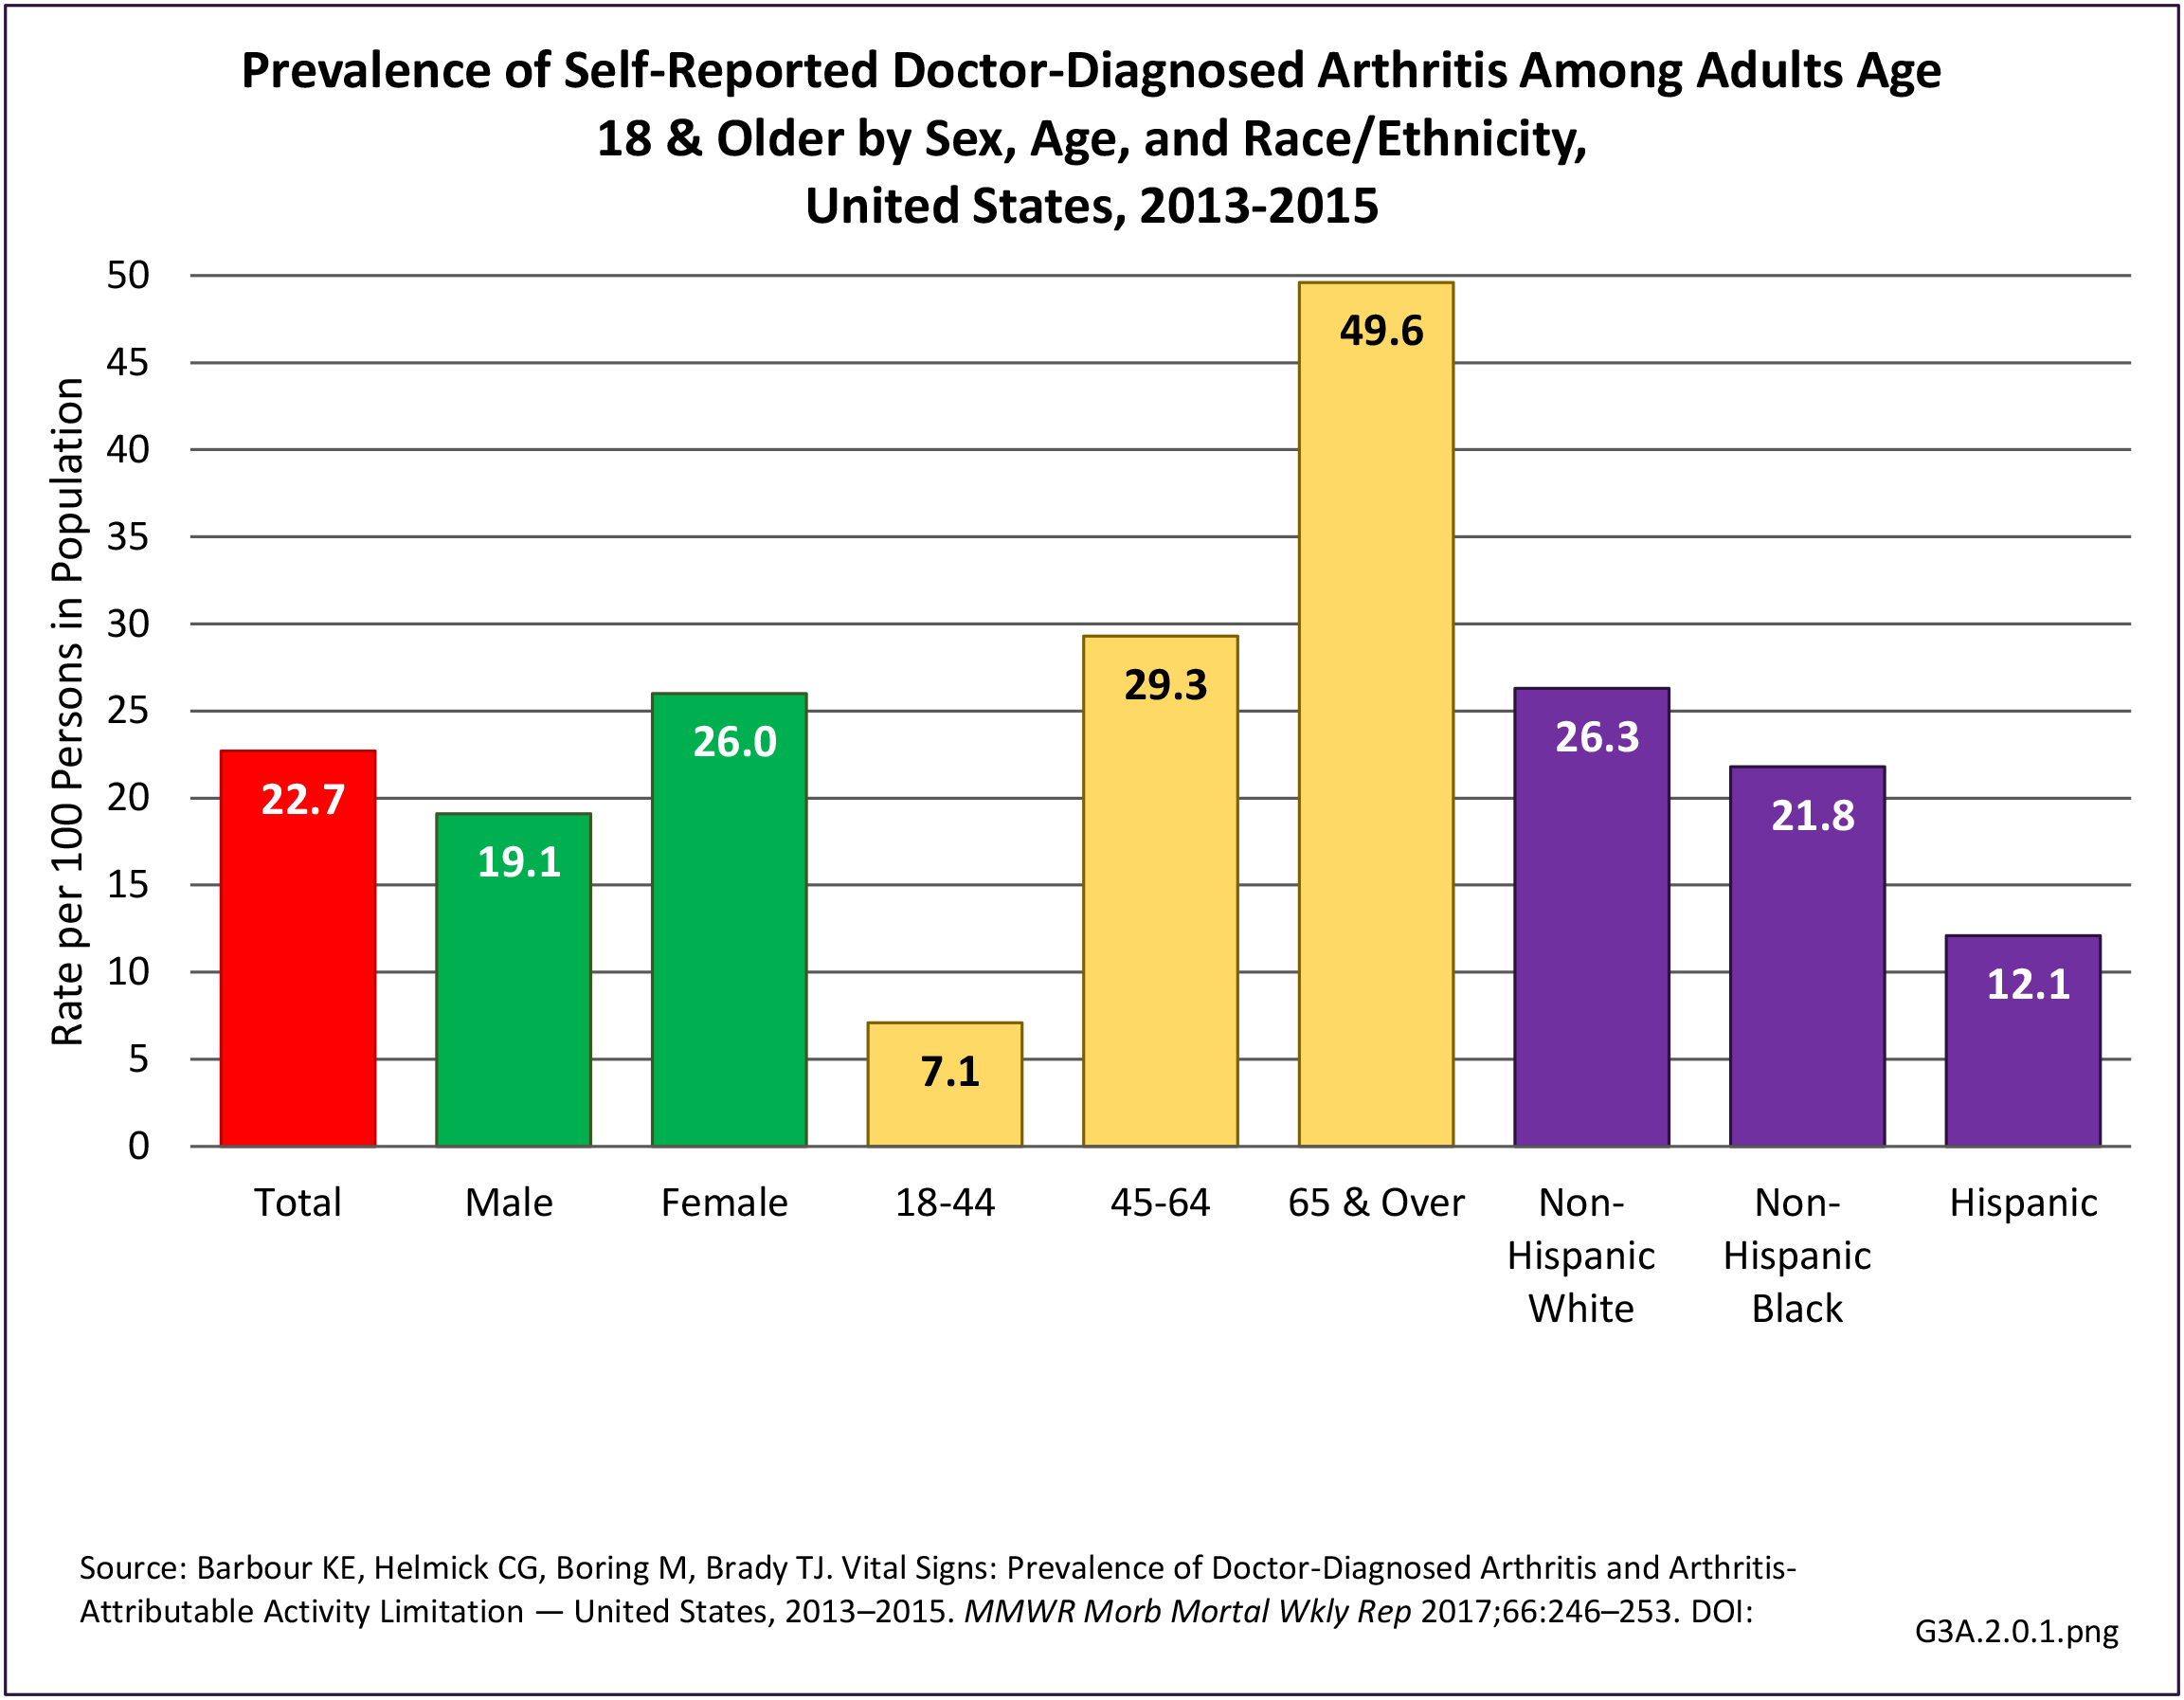
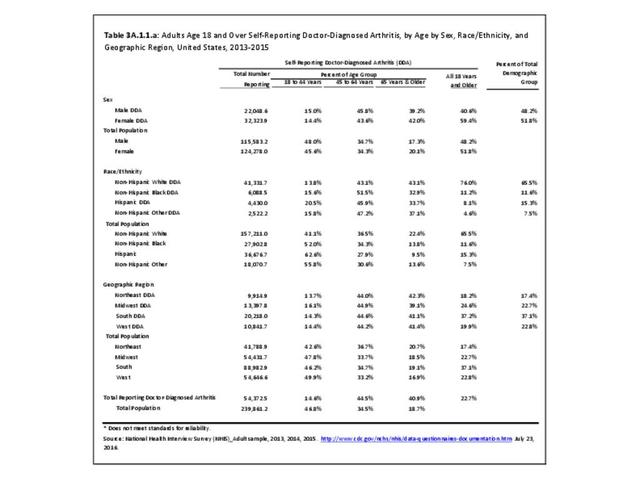
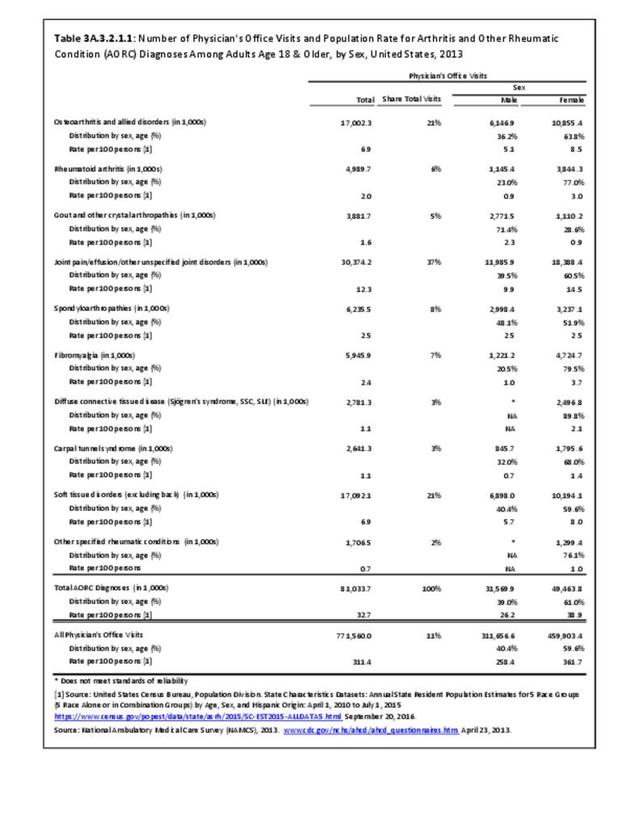
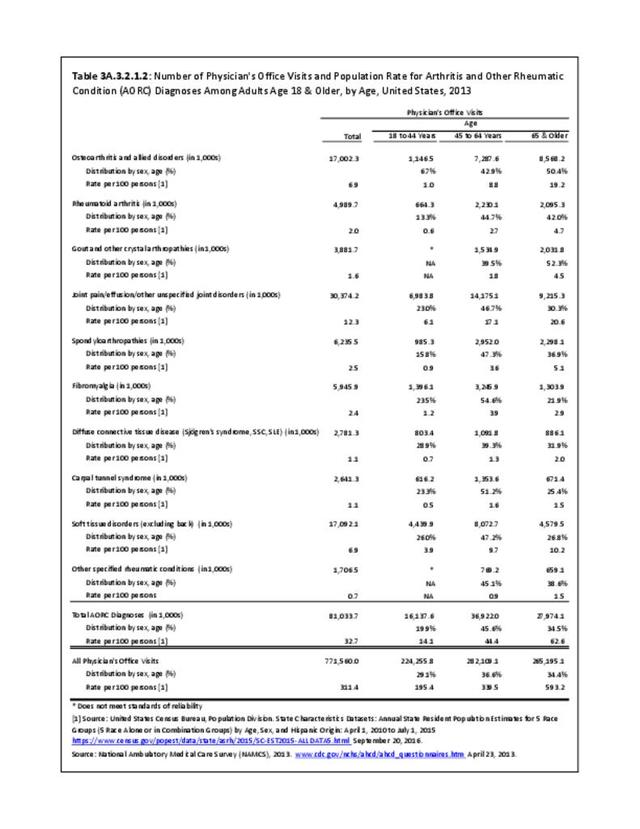
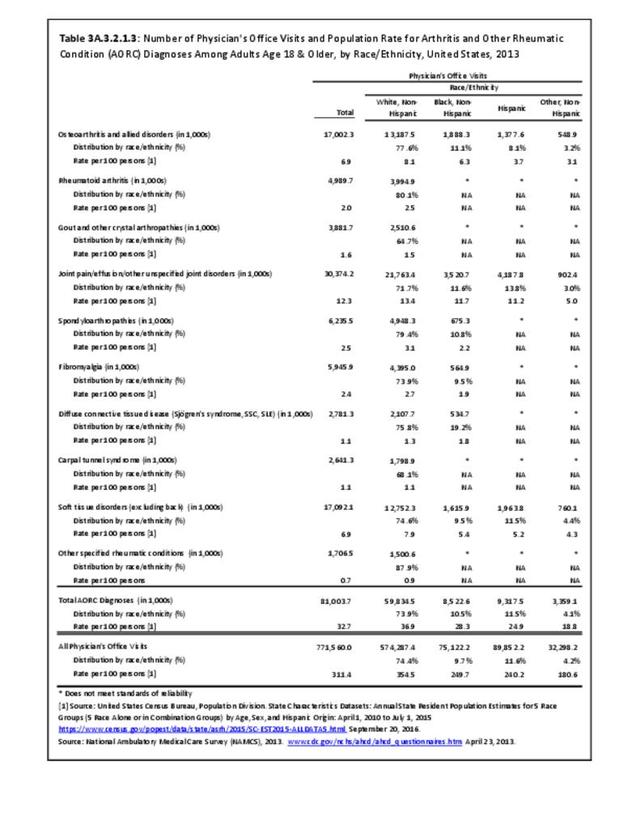
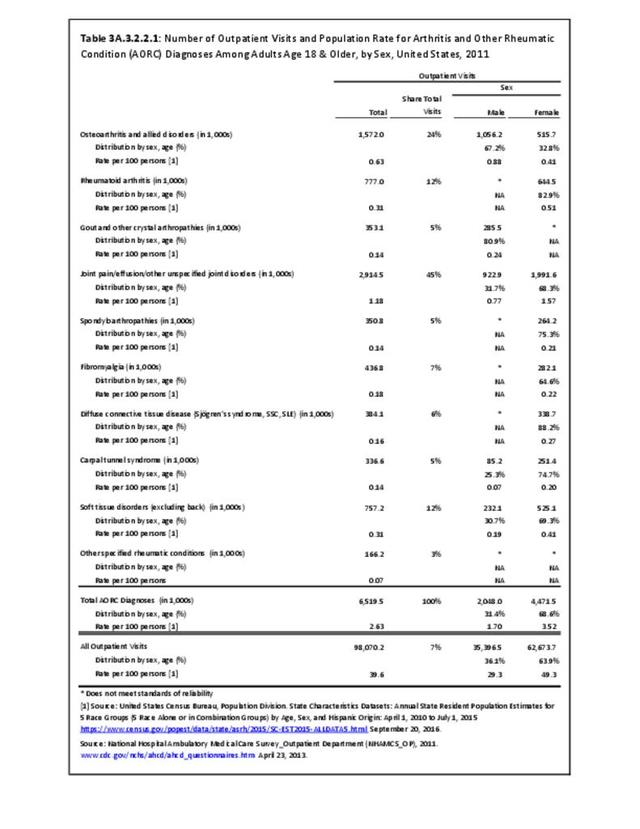
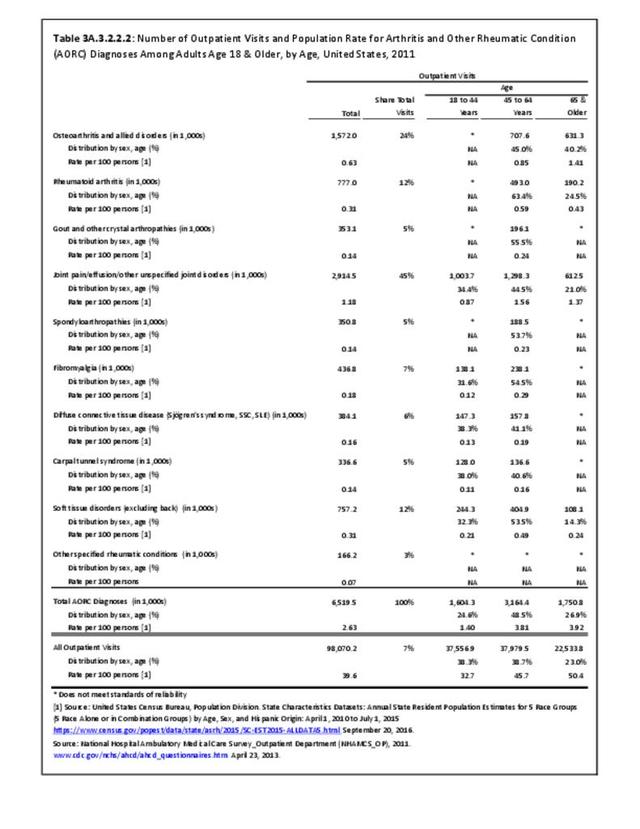
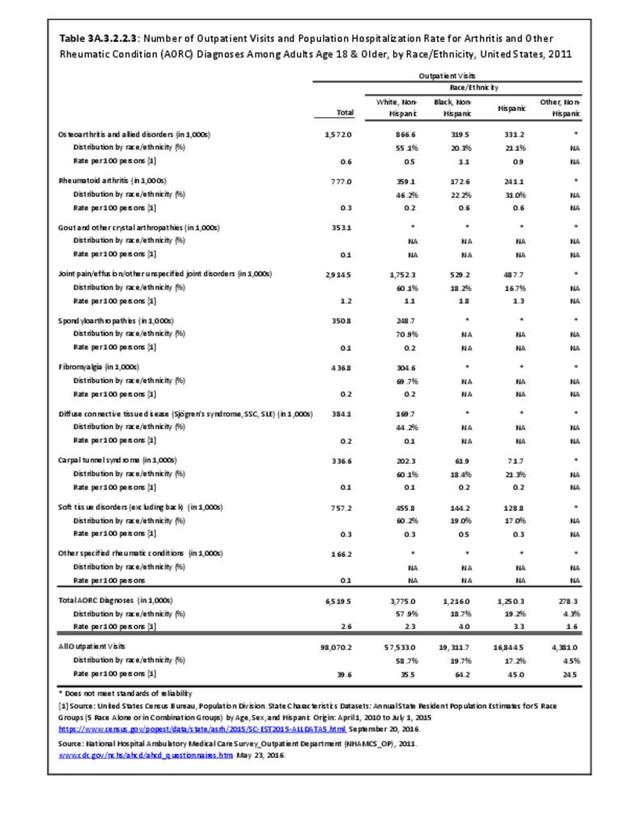
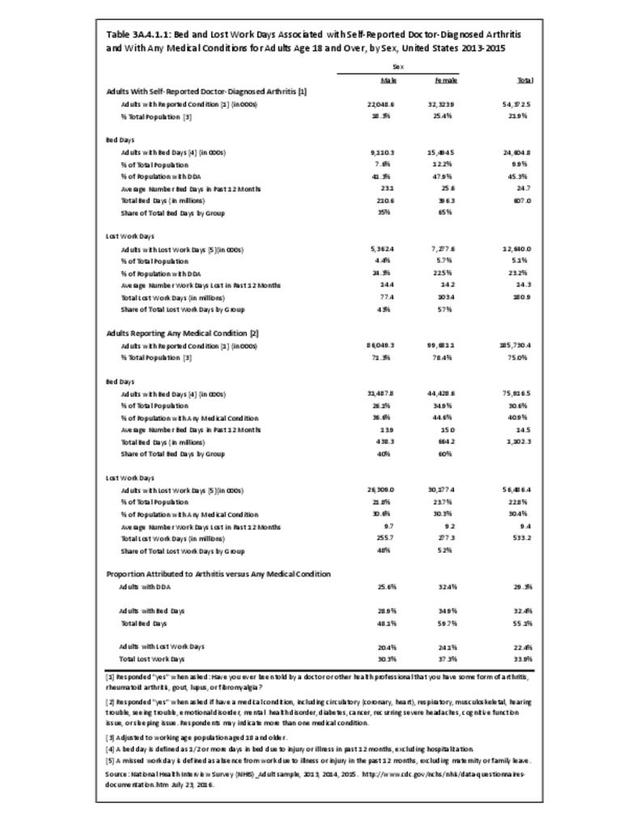
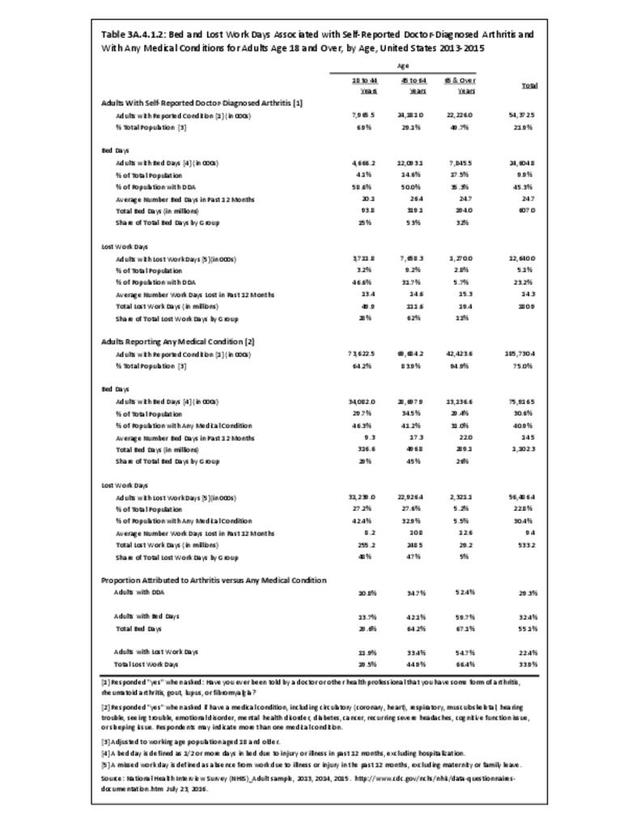
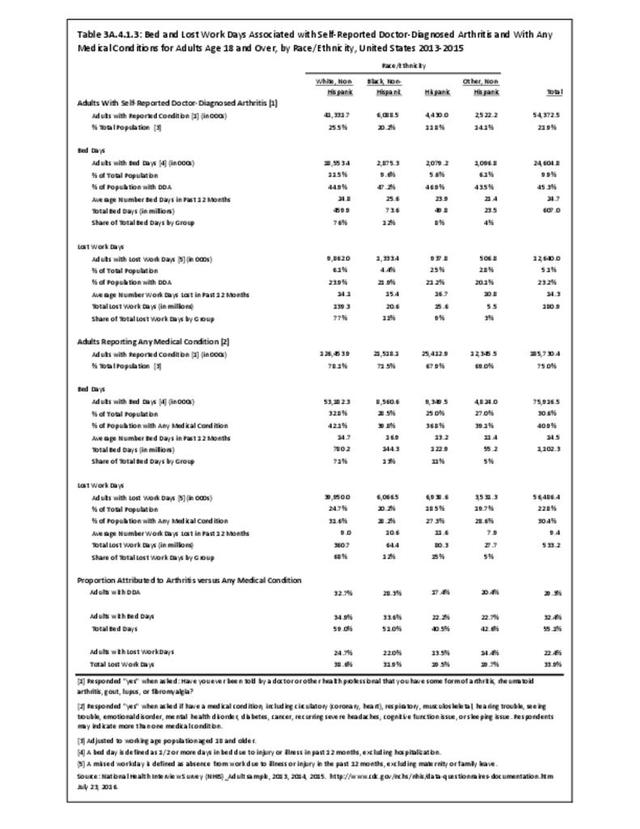
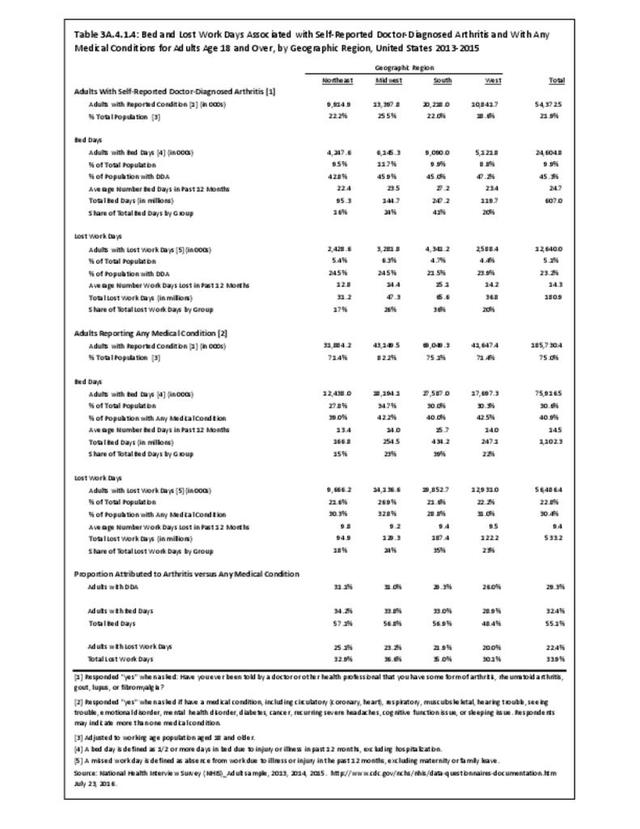
However, total numbers do not reflect the share of the population group with OA. For example, females represent about 51% of the adult population in any given year, but comprise 78% of adults with OA. An even more disproportionate share of 18% of the population age 65 and older have OA (43%). This compares to 46% with osteoarthritis in the 34% of the population age 45 to 64 years. Non-Hispanic whites still have the highest share by race/ethnicity, comprising 65% of the population but 78% of those with OA, while Hispanics have the lowest (15% of population to 7% of adults with OA). Geographic region is not a major factor for OA, although the Midwest has a higher proportion of cases than it represents in the US population.

Share of the total OA population, however, does not give the whole picture. Since OA is closely linked to age, race/ethnicity and geographical regions with younger population segments will exhibit a lower overall share of OA patients. Both non-Hispanic black and Hispanic populations have a higher share of adults age 45 and older reporting OA than is found among non-Hispanic white adults. Hence, while non-Hispanic white adults represent the largest group of adults with OA, other race/ethnic groups have higher rates of OA. This same pattern can be seen in geographic regions, where the West has a younger population but higher rate of OA in the 65 and older population than is found in other regions. (Reference Table T3A.1.1.a PDF CSV)

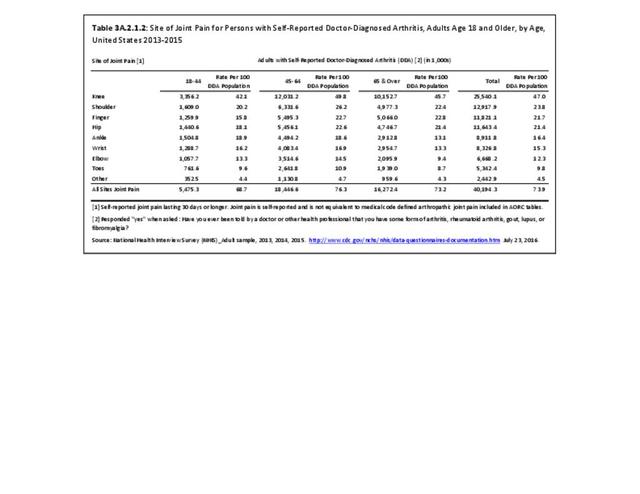
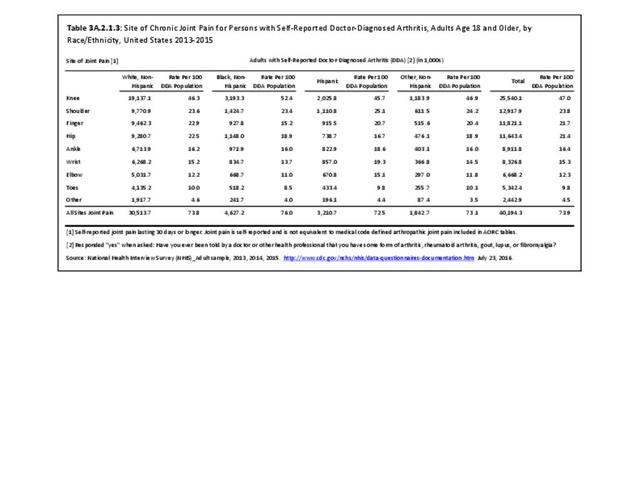
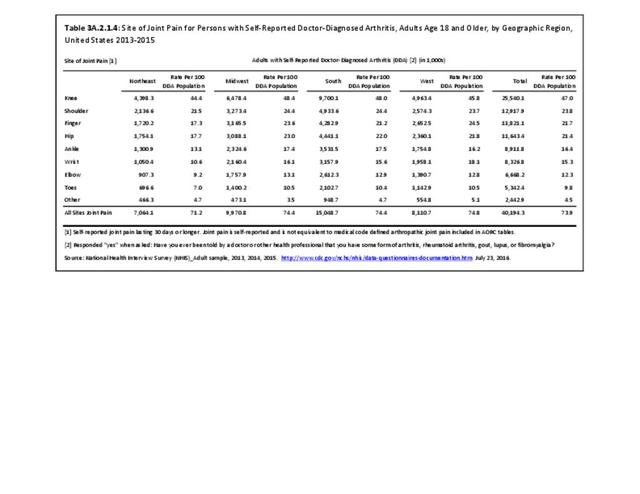
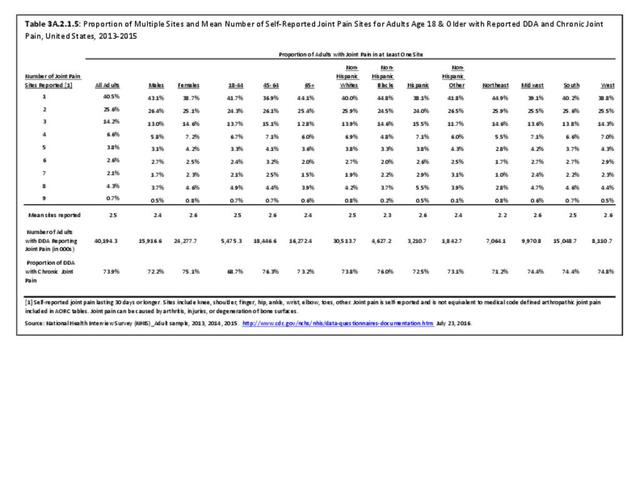
Joint Involvement in Osteoarthritis
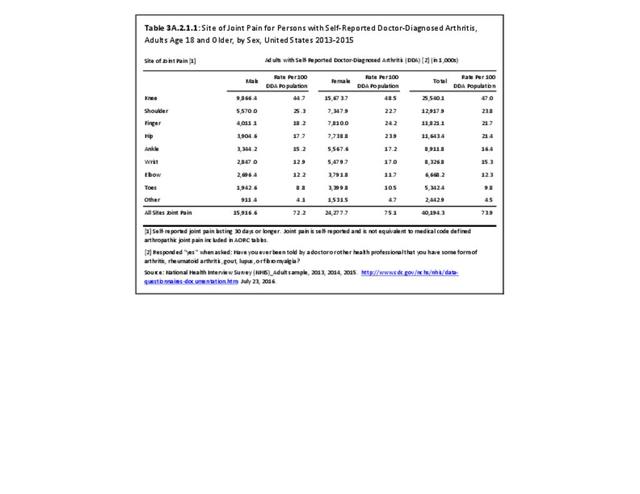
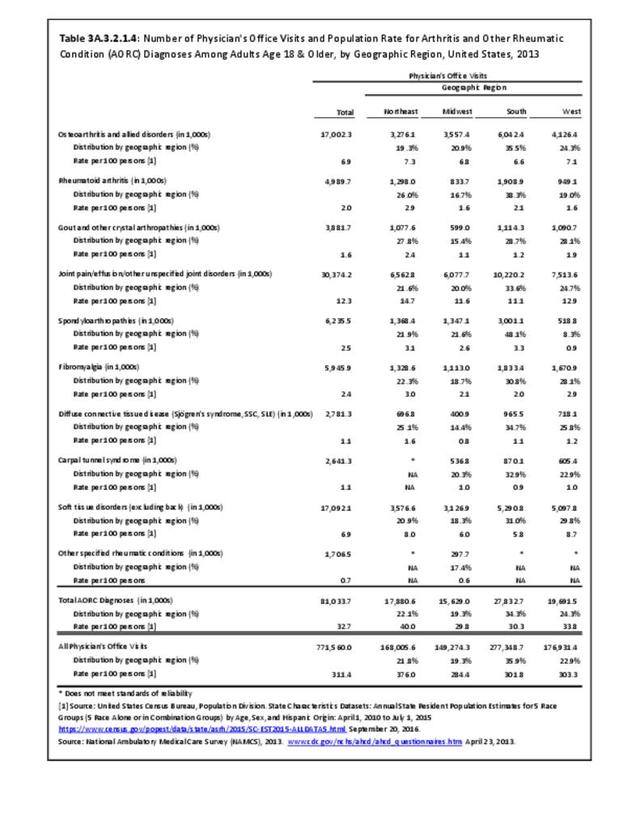
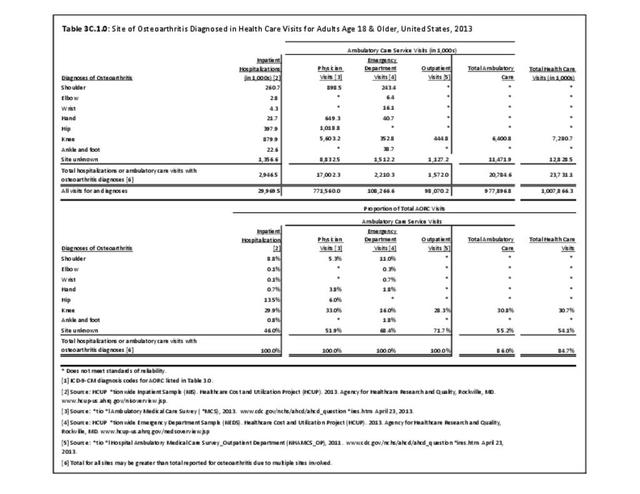
Most OA diagnoses in both a hospital and outpatient setting do not specify the bodily site for which a healthcare visit is made. However, among those that are diagnosed with a specific site, the knee is the most common, followed by the hip. The knee accounts for about one-third (31%) of OA visits in all settings and is the only site identified in the data that meets reliability standards in all outpatient settings. Osteoarthritis in the hip accounts for 14% of hospital discharges, and 6% of physician office visits. (Reference Table 3C.1.0 PDF CSV)
Healthcare Utilization
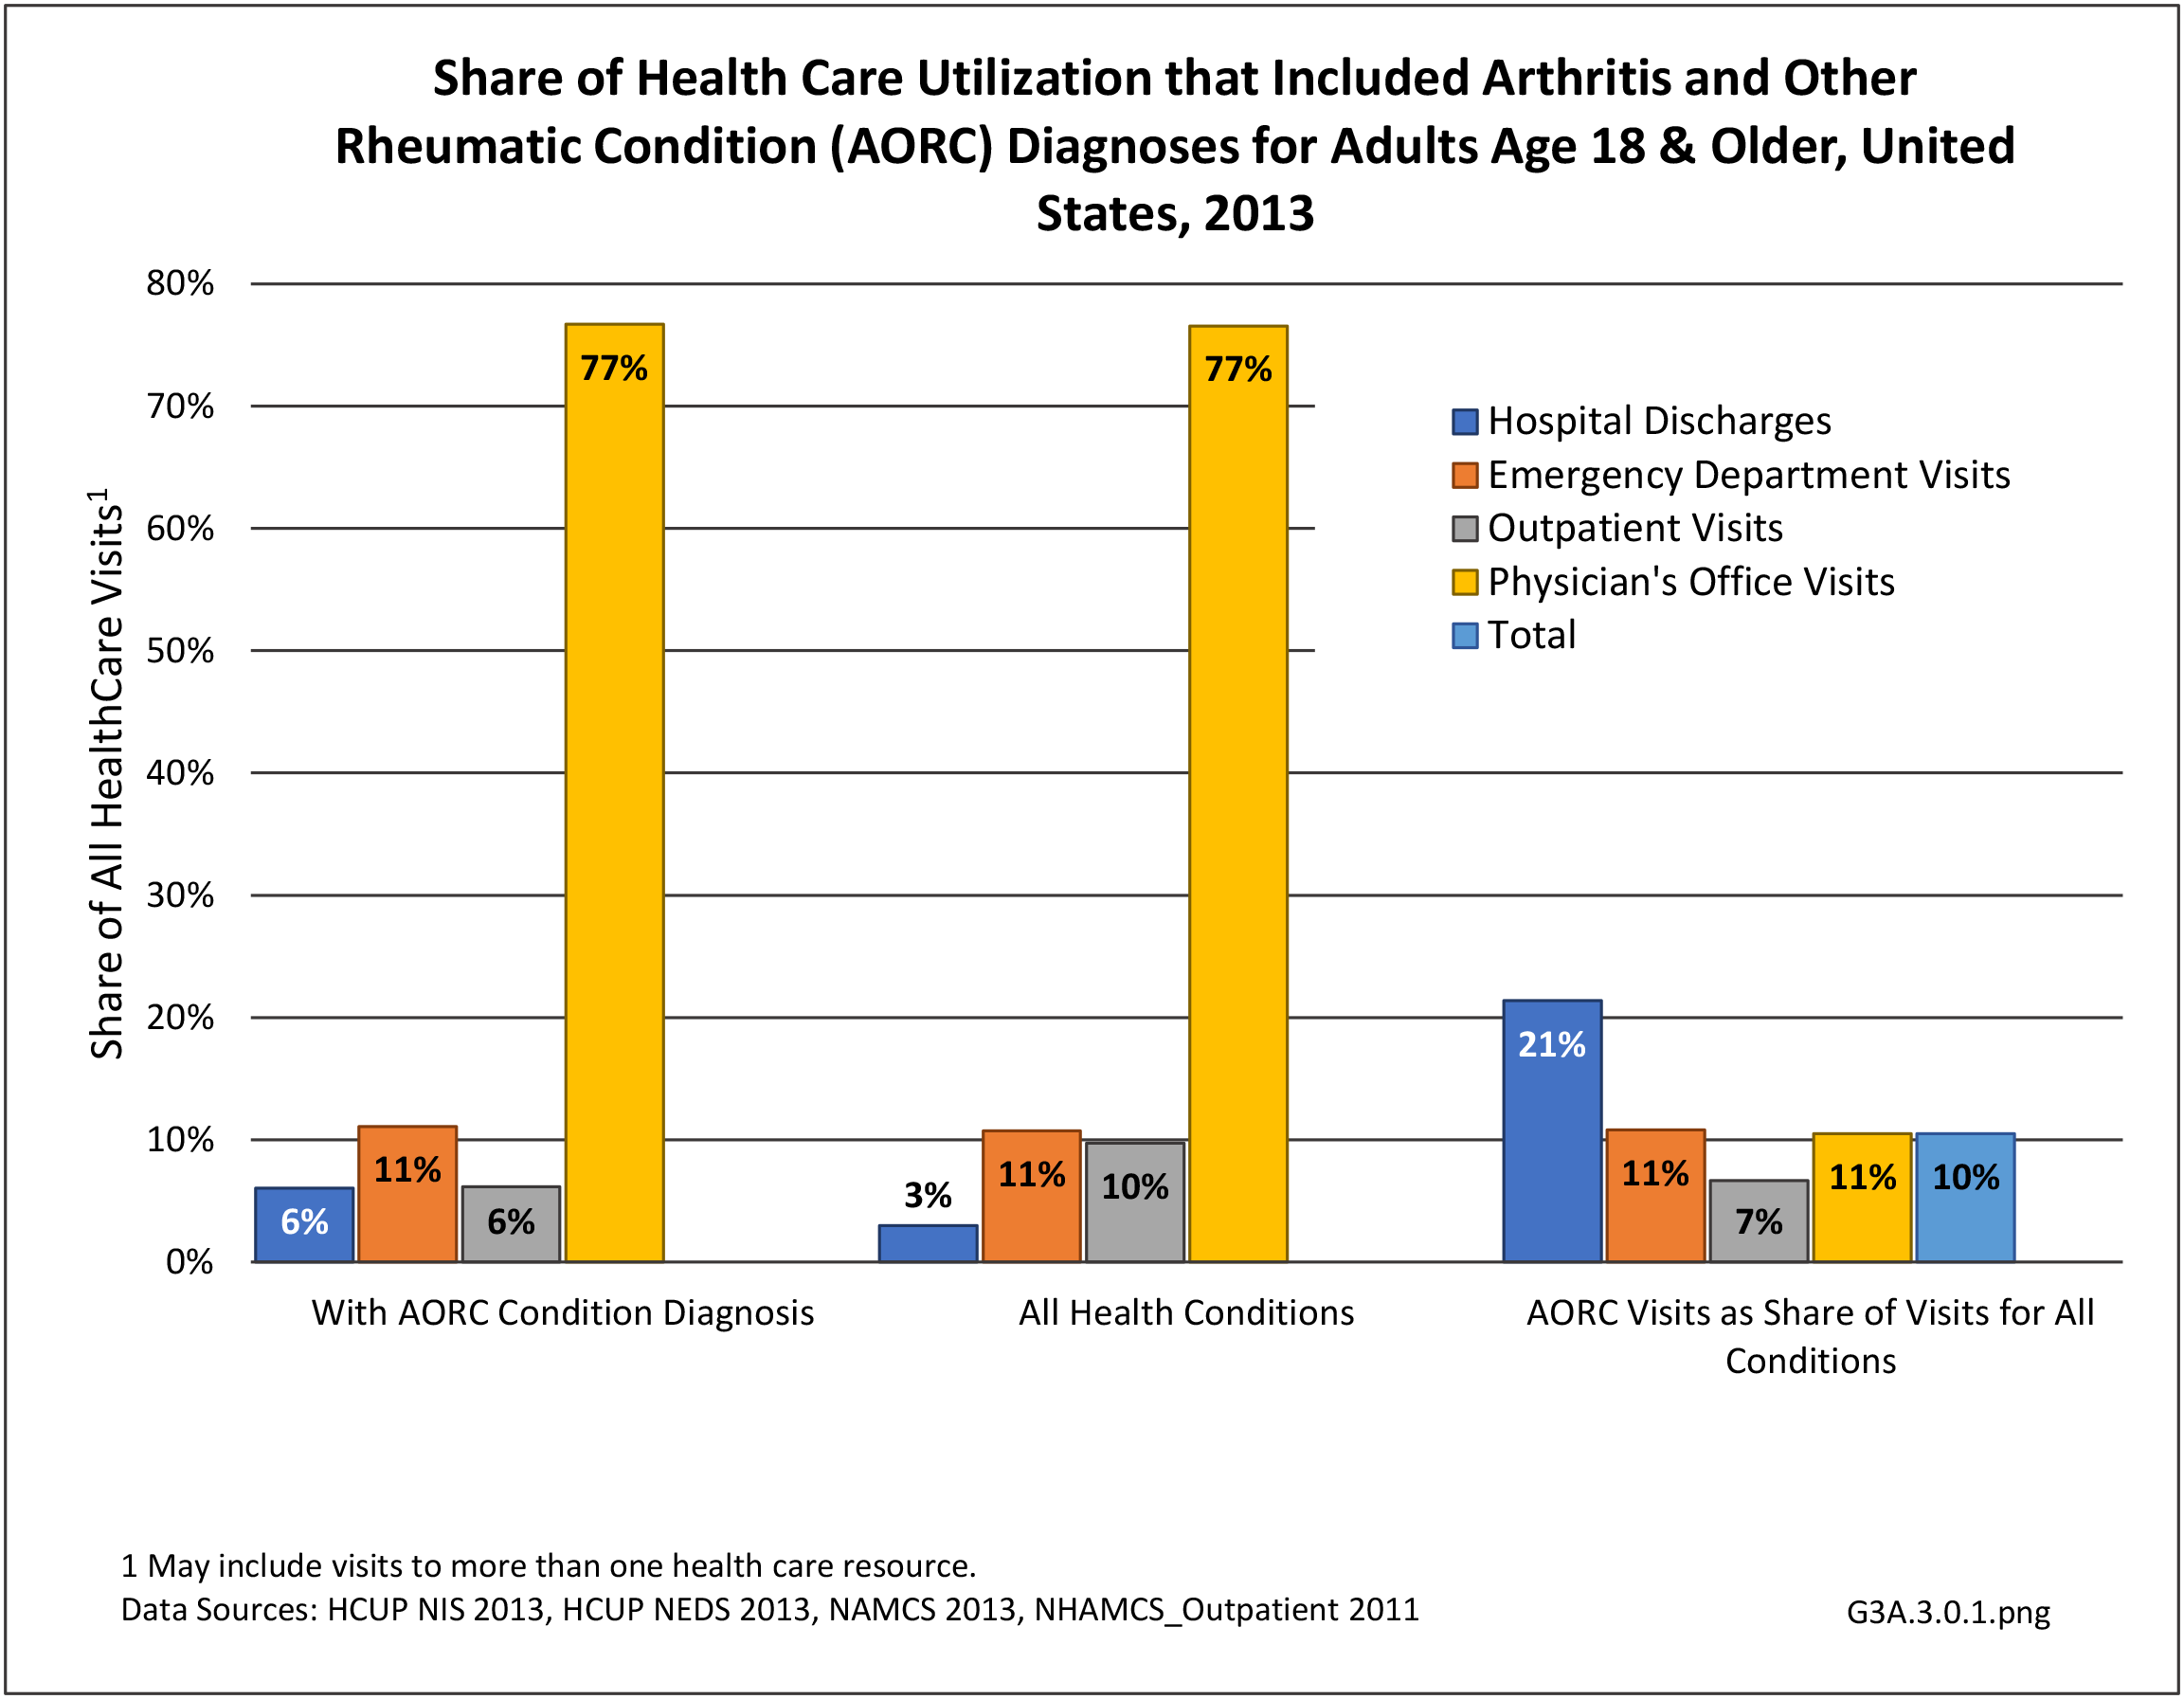
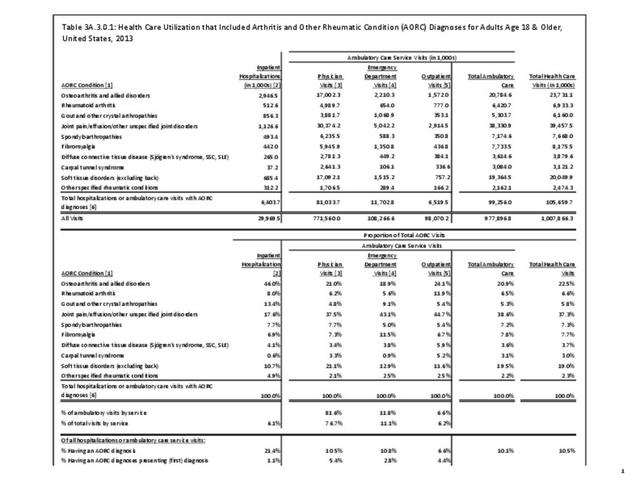
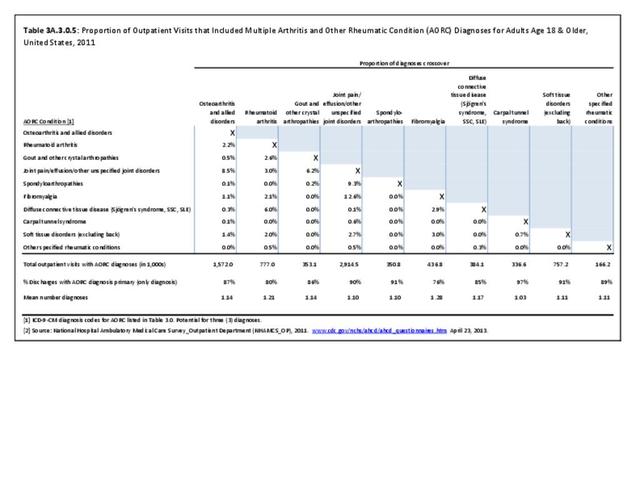
Osteoarthritis was diagnosed in 23.7 million healthcare visits in 2013, or 2.4% of all healthcare visits for any cause (Reference Table 3A.3.0.1 PDF CSV). It accounted for 10% of all hospitalizations and 2% of ambulatory visits.
Hospitalization
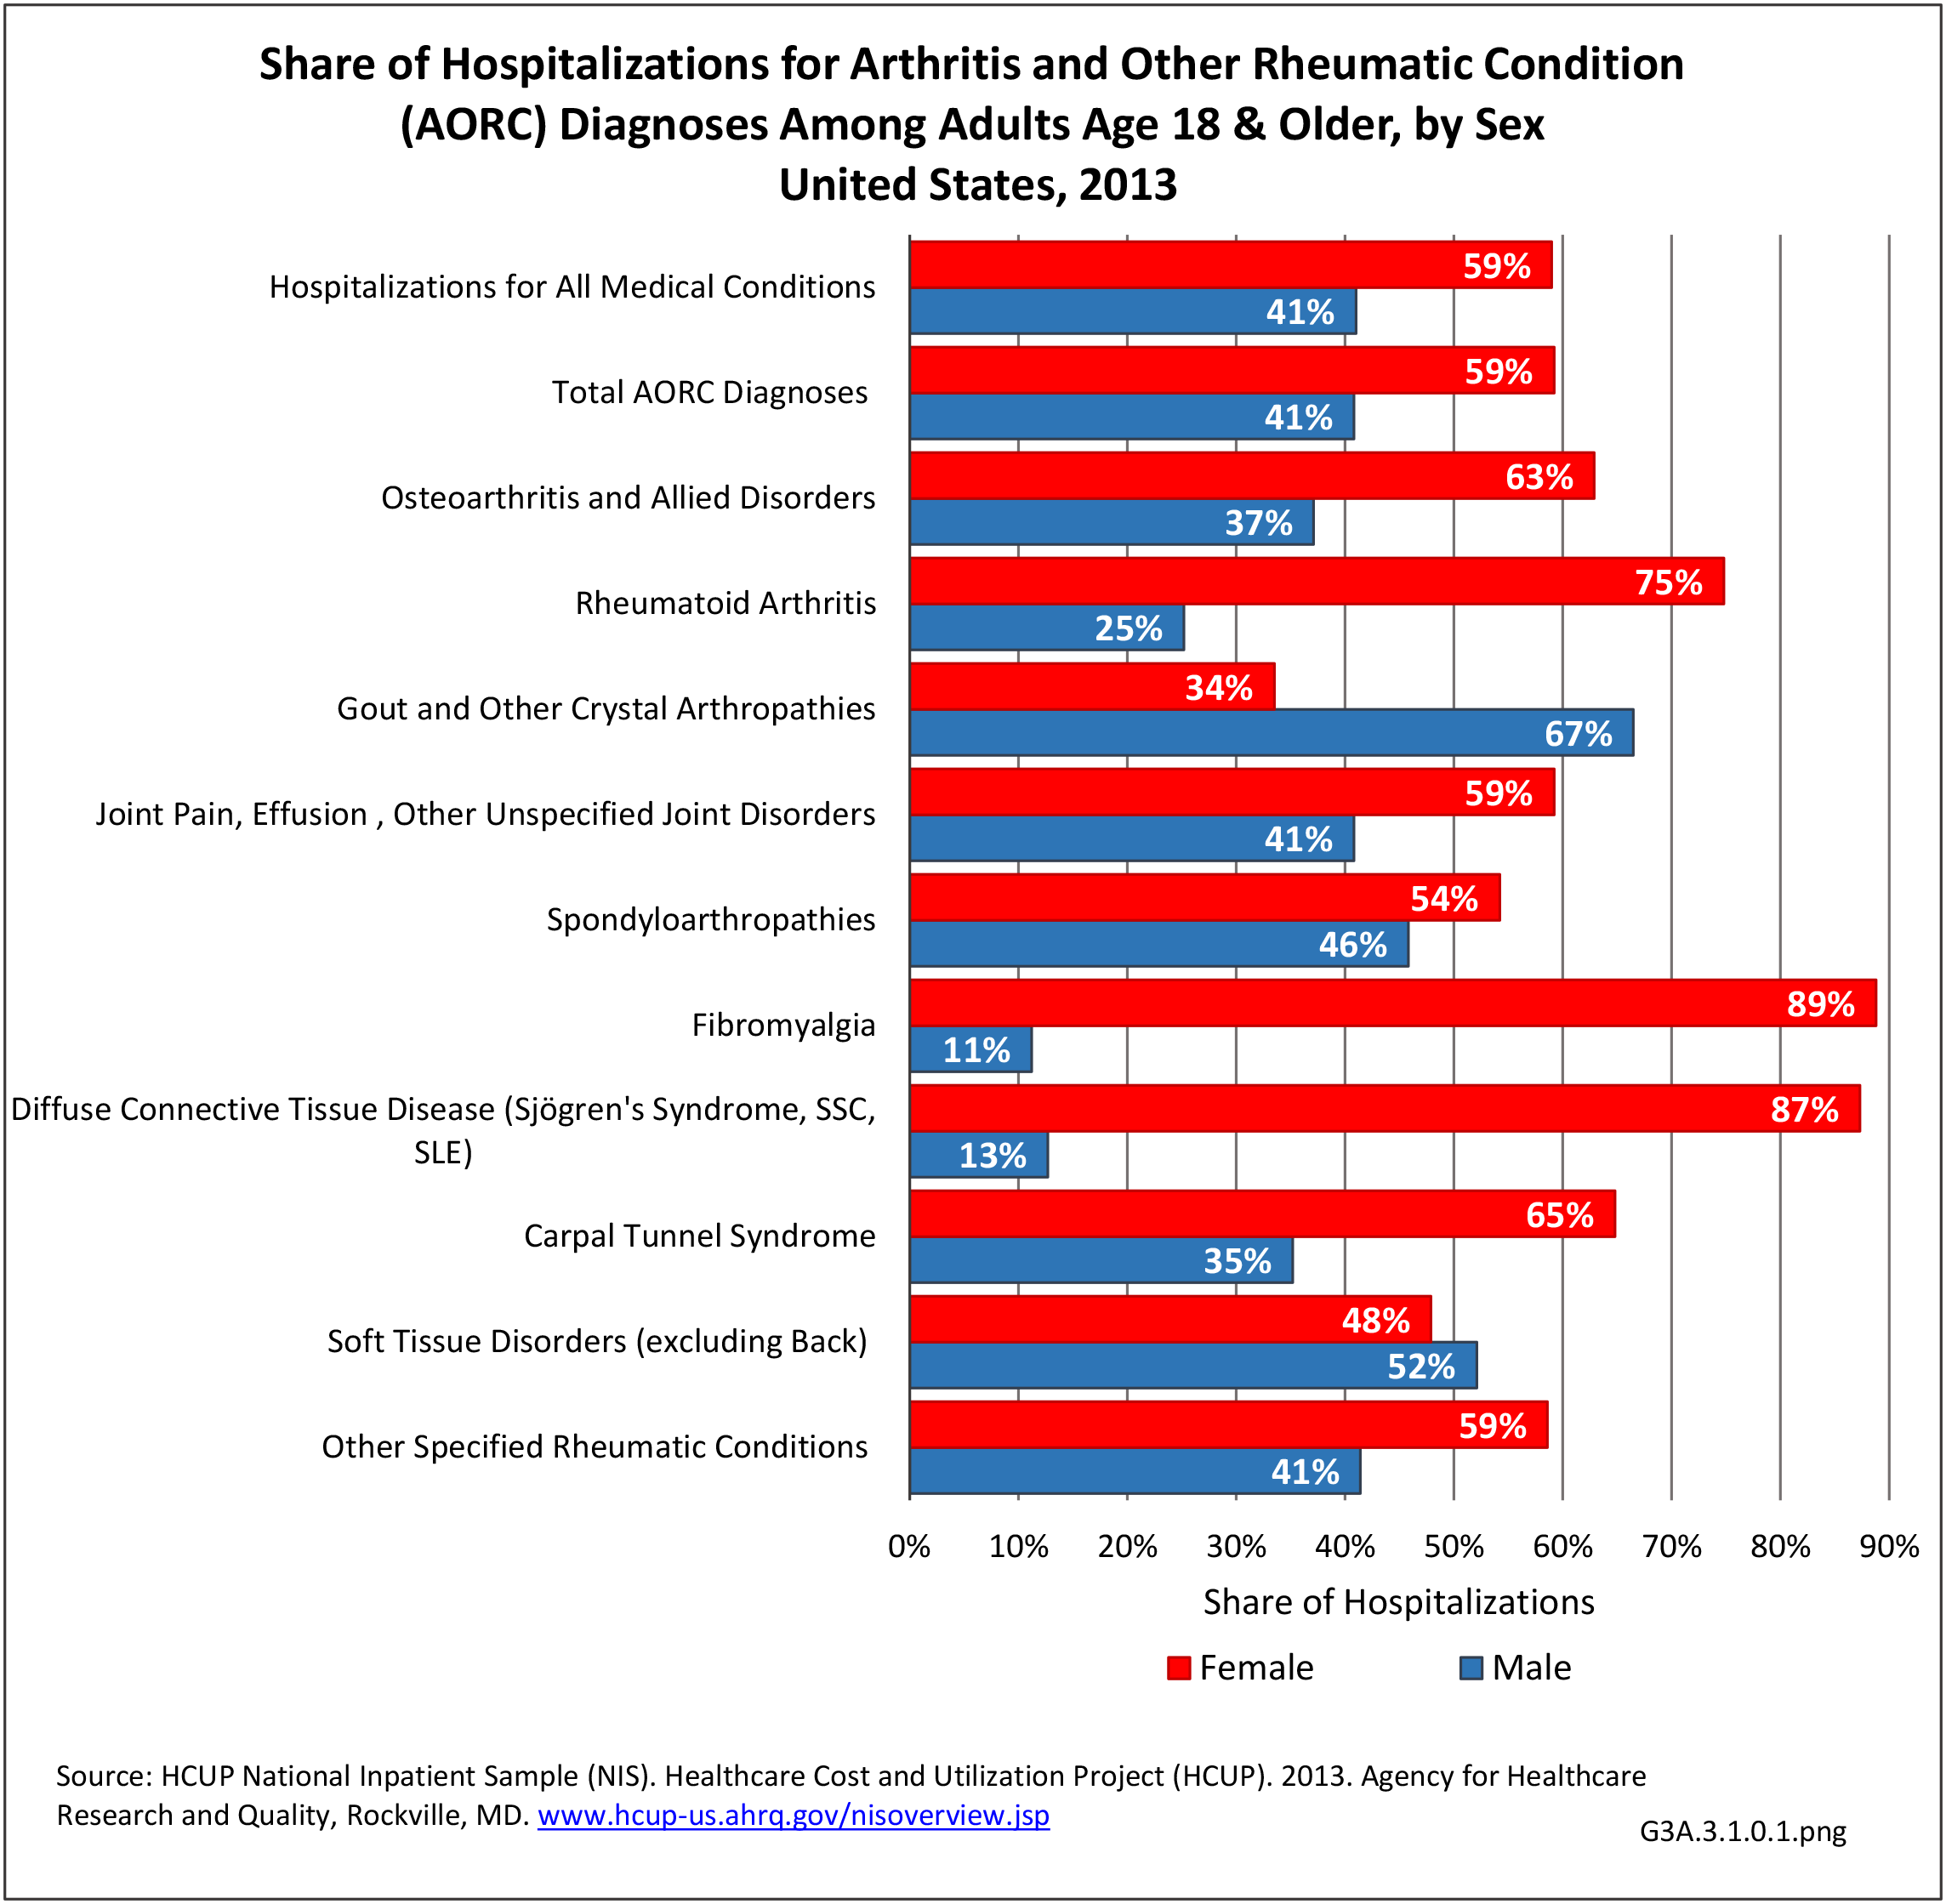
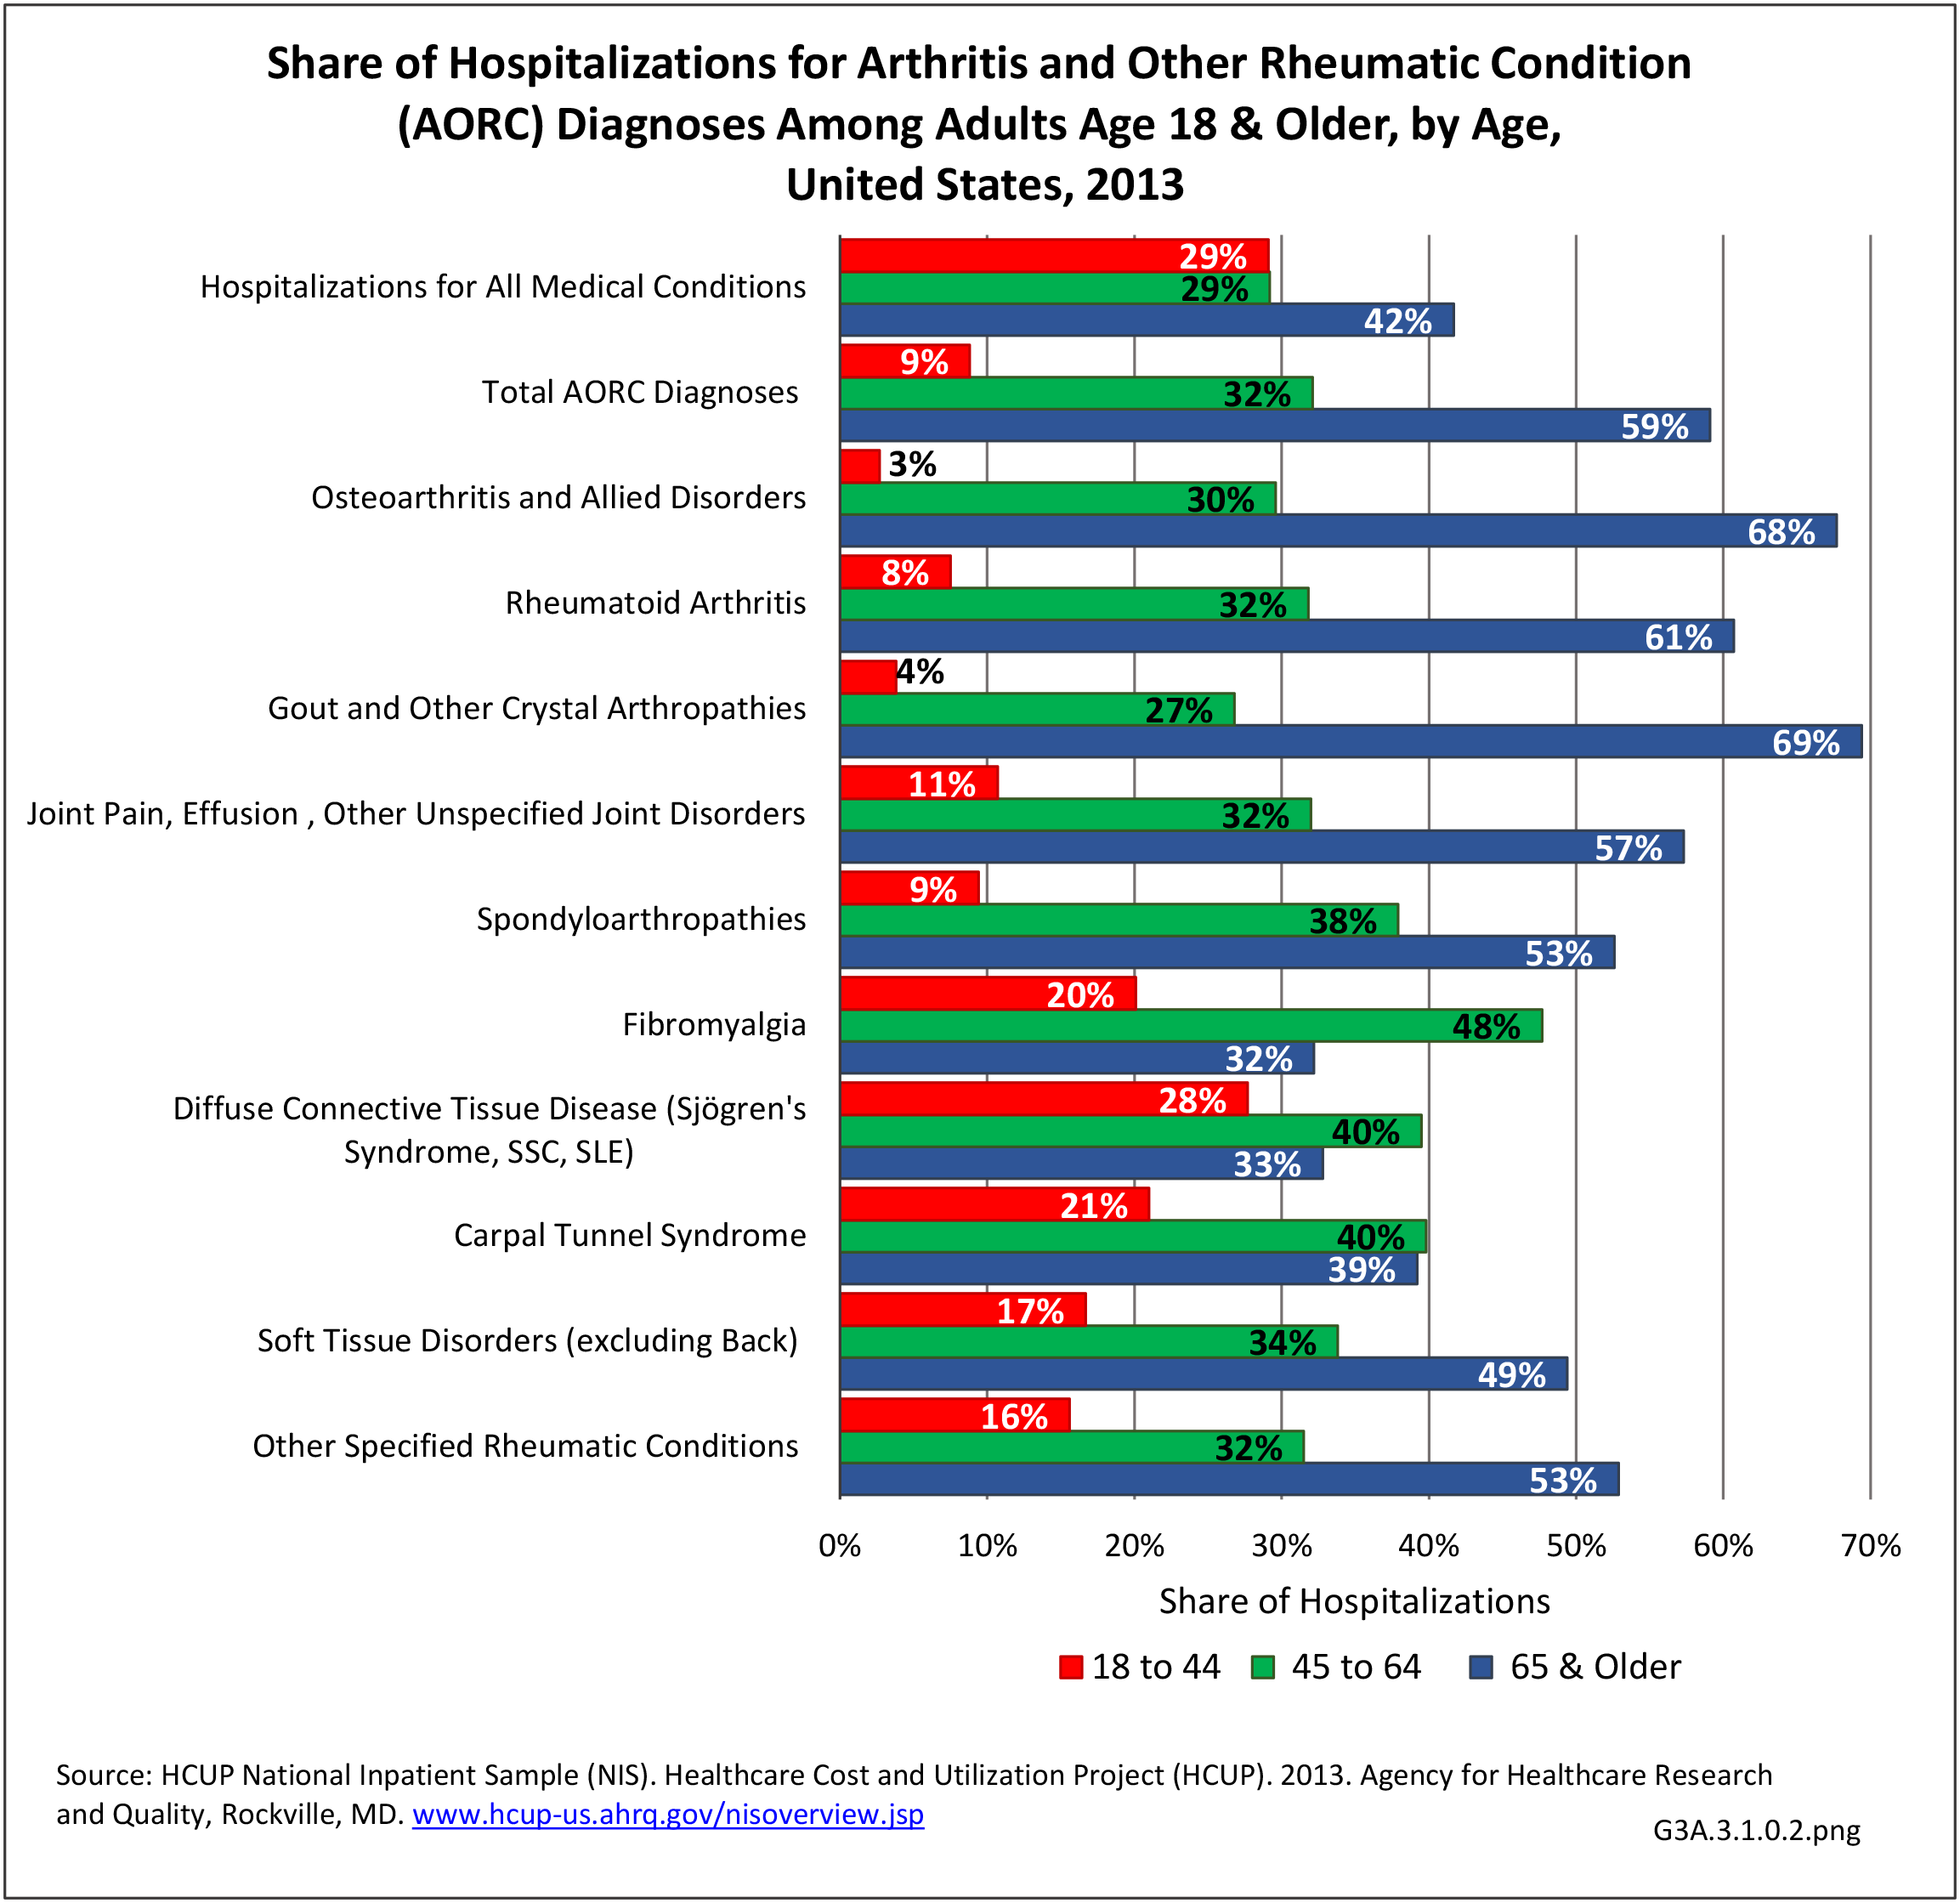
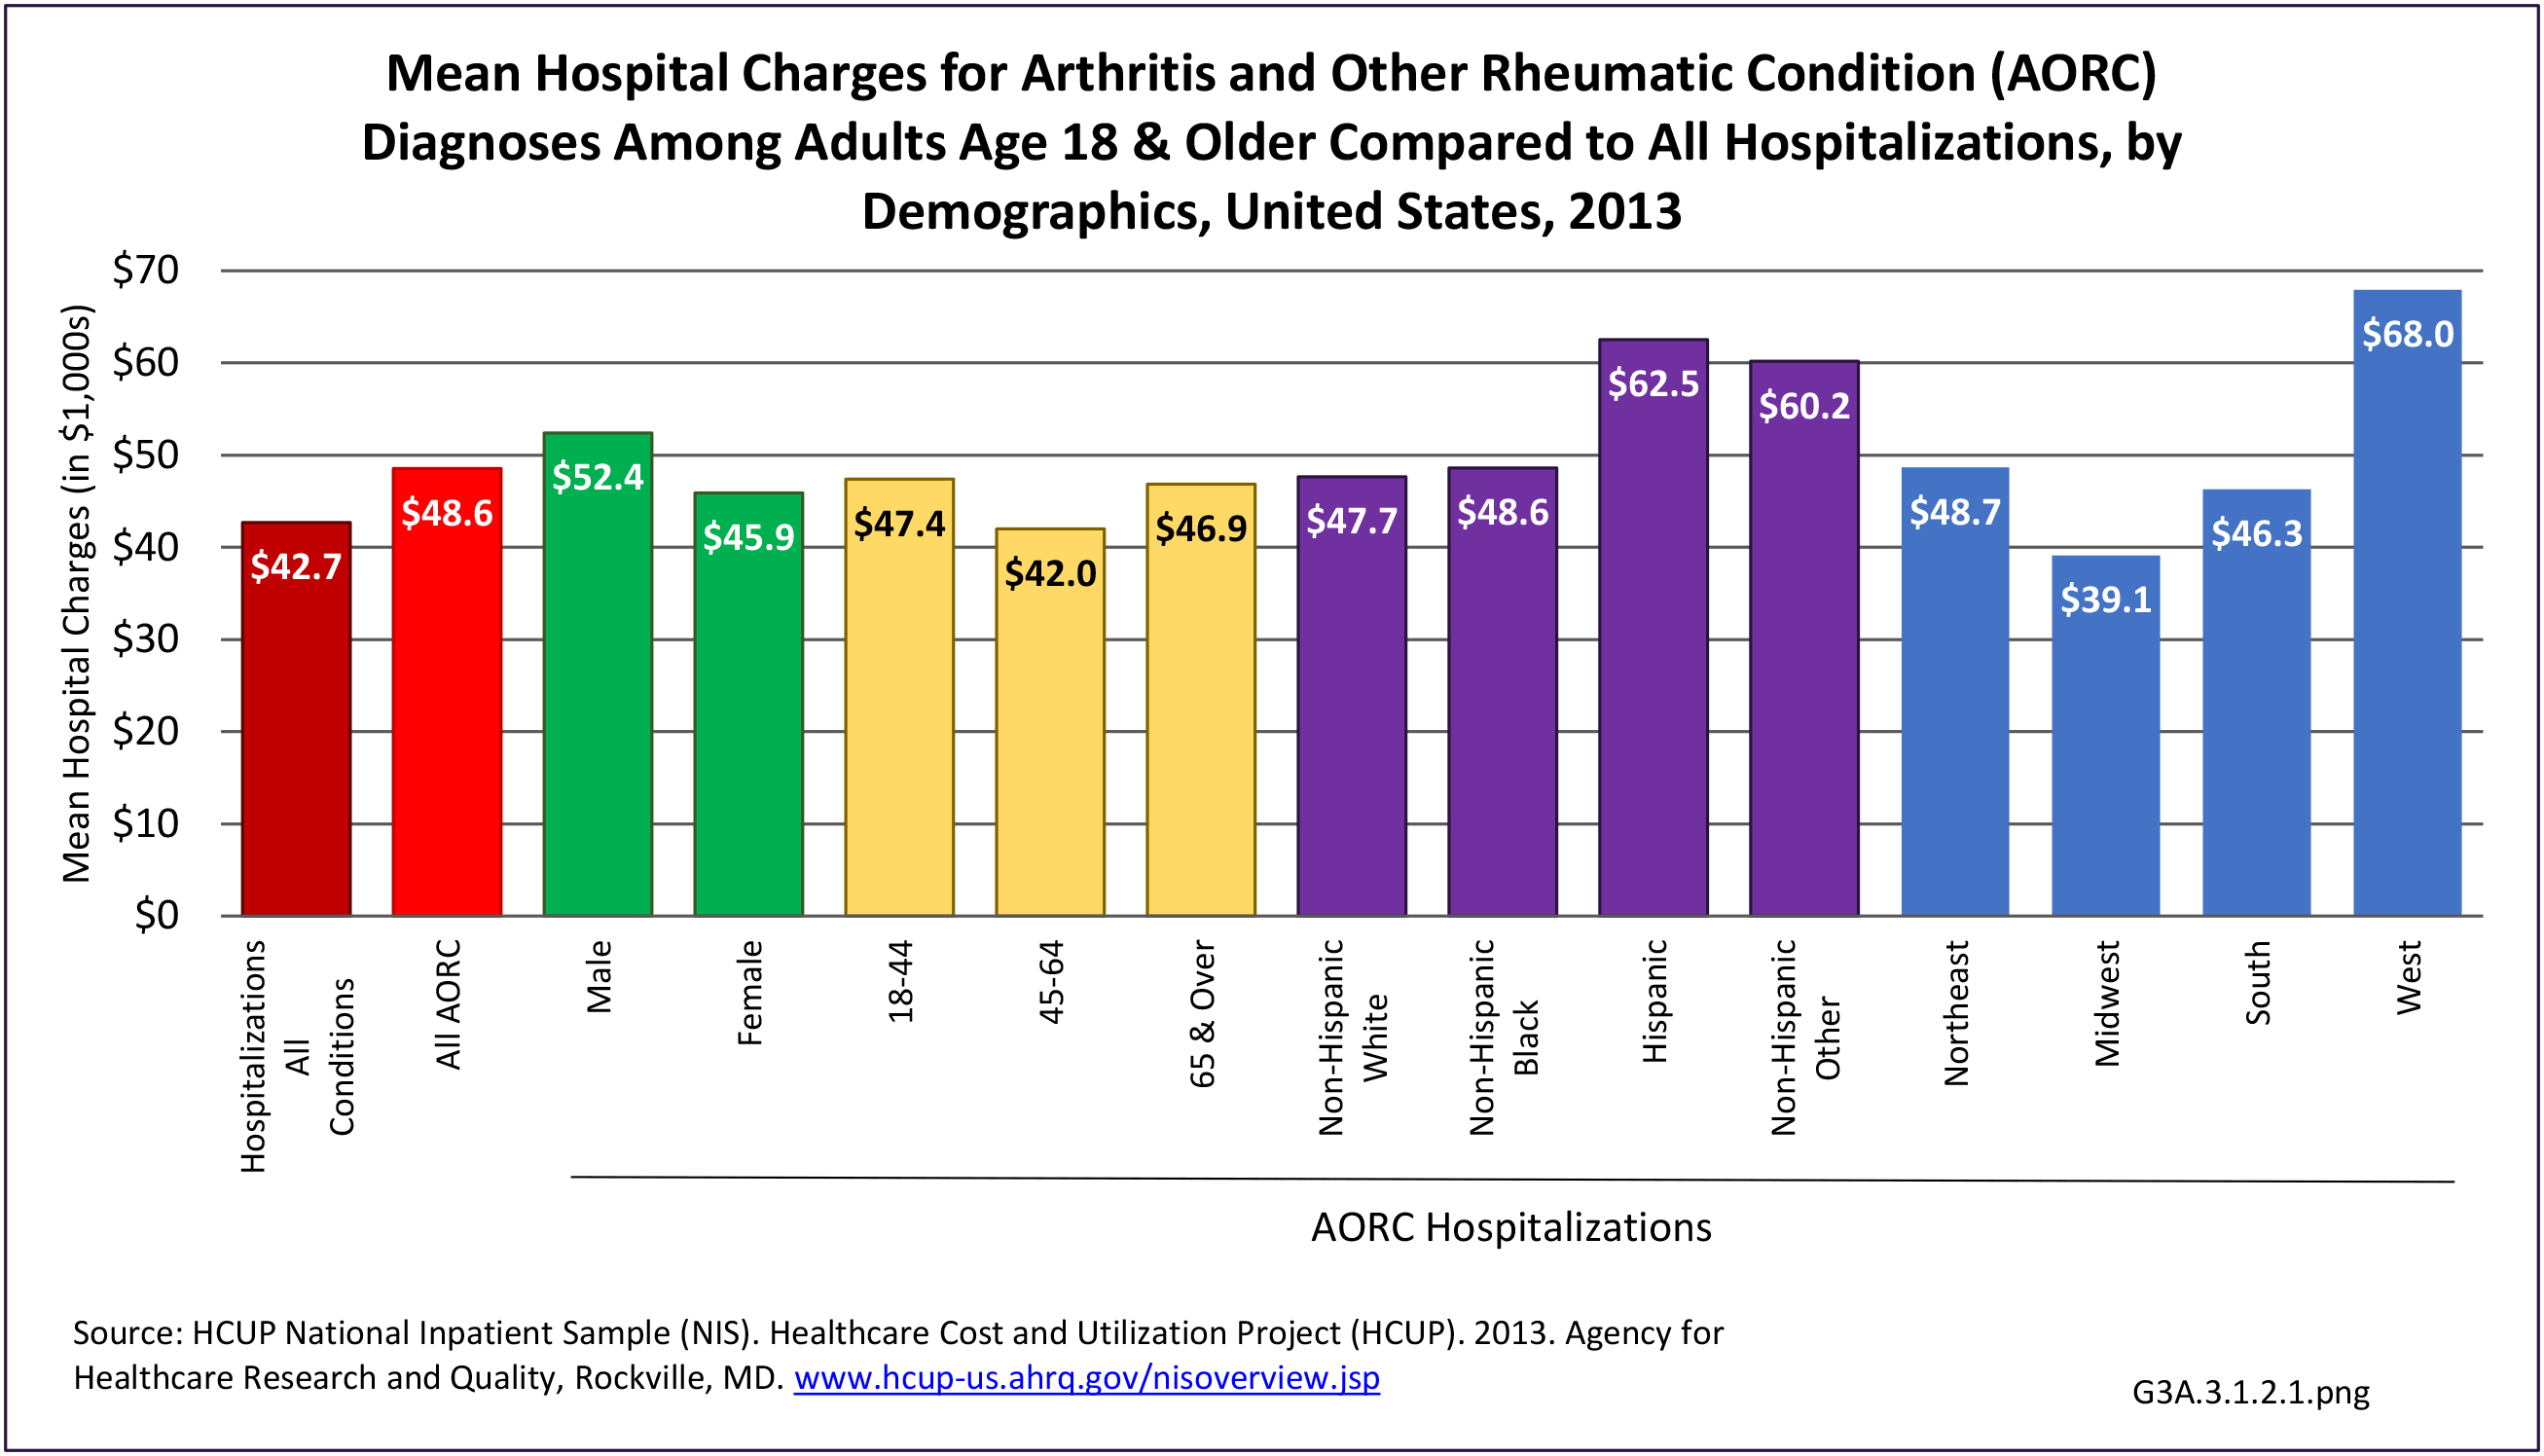
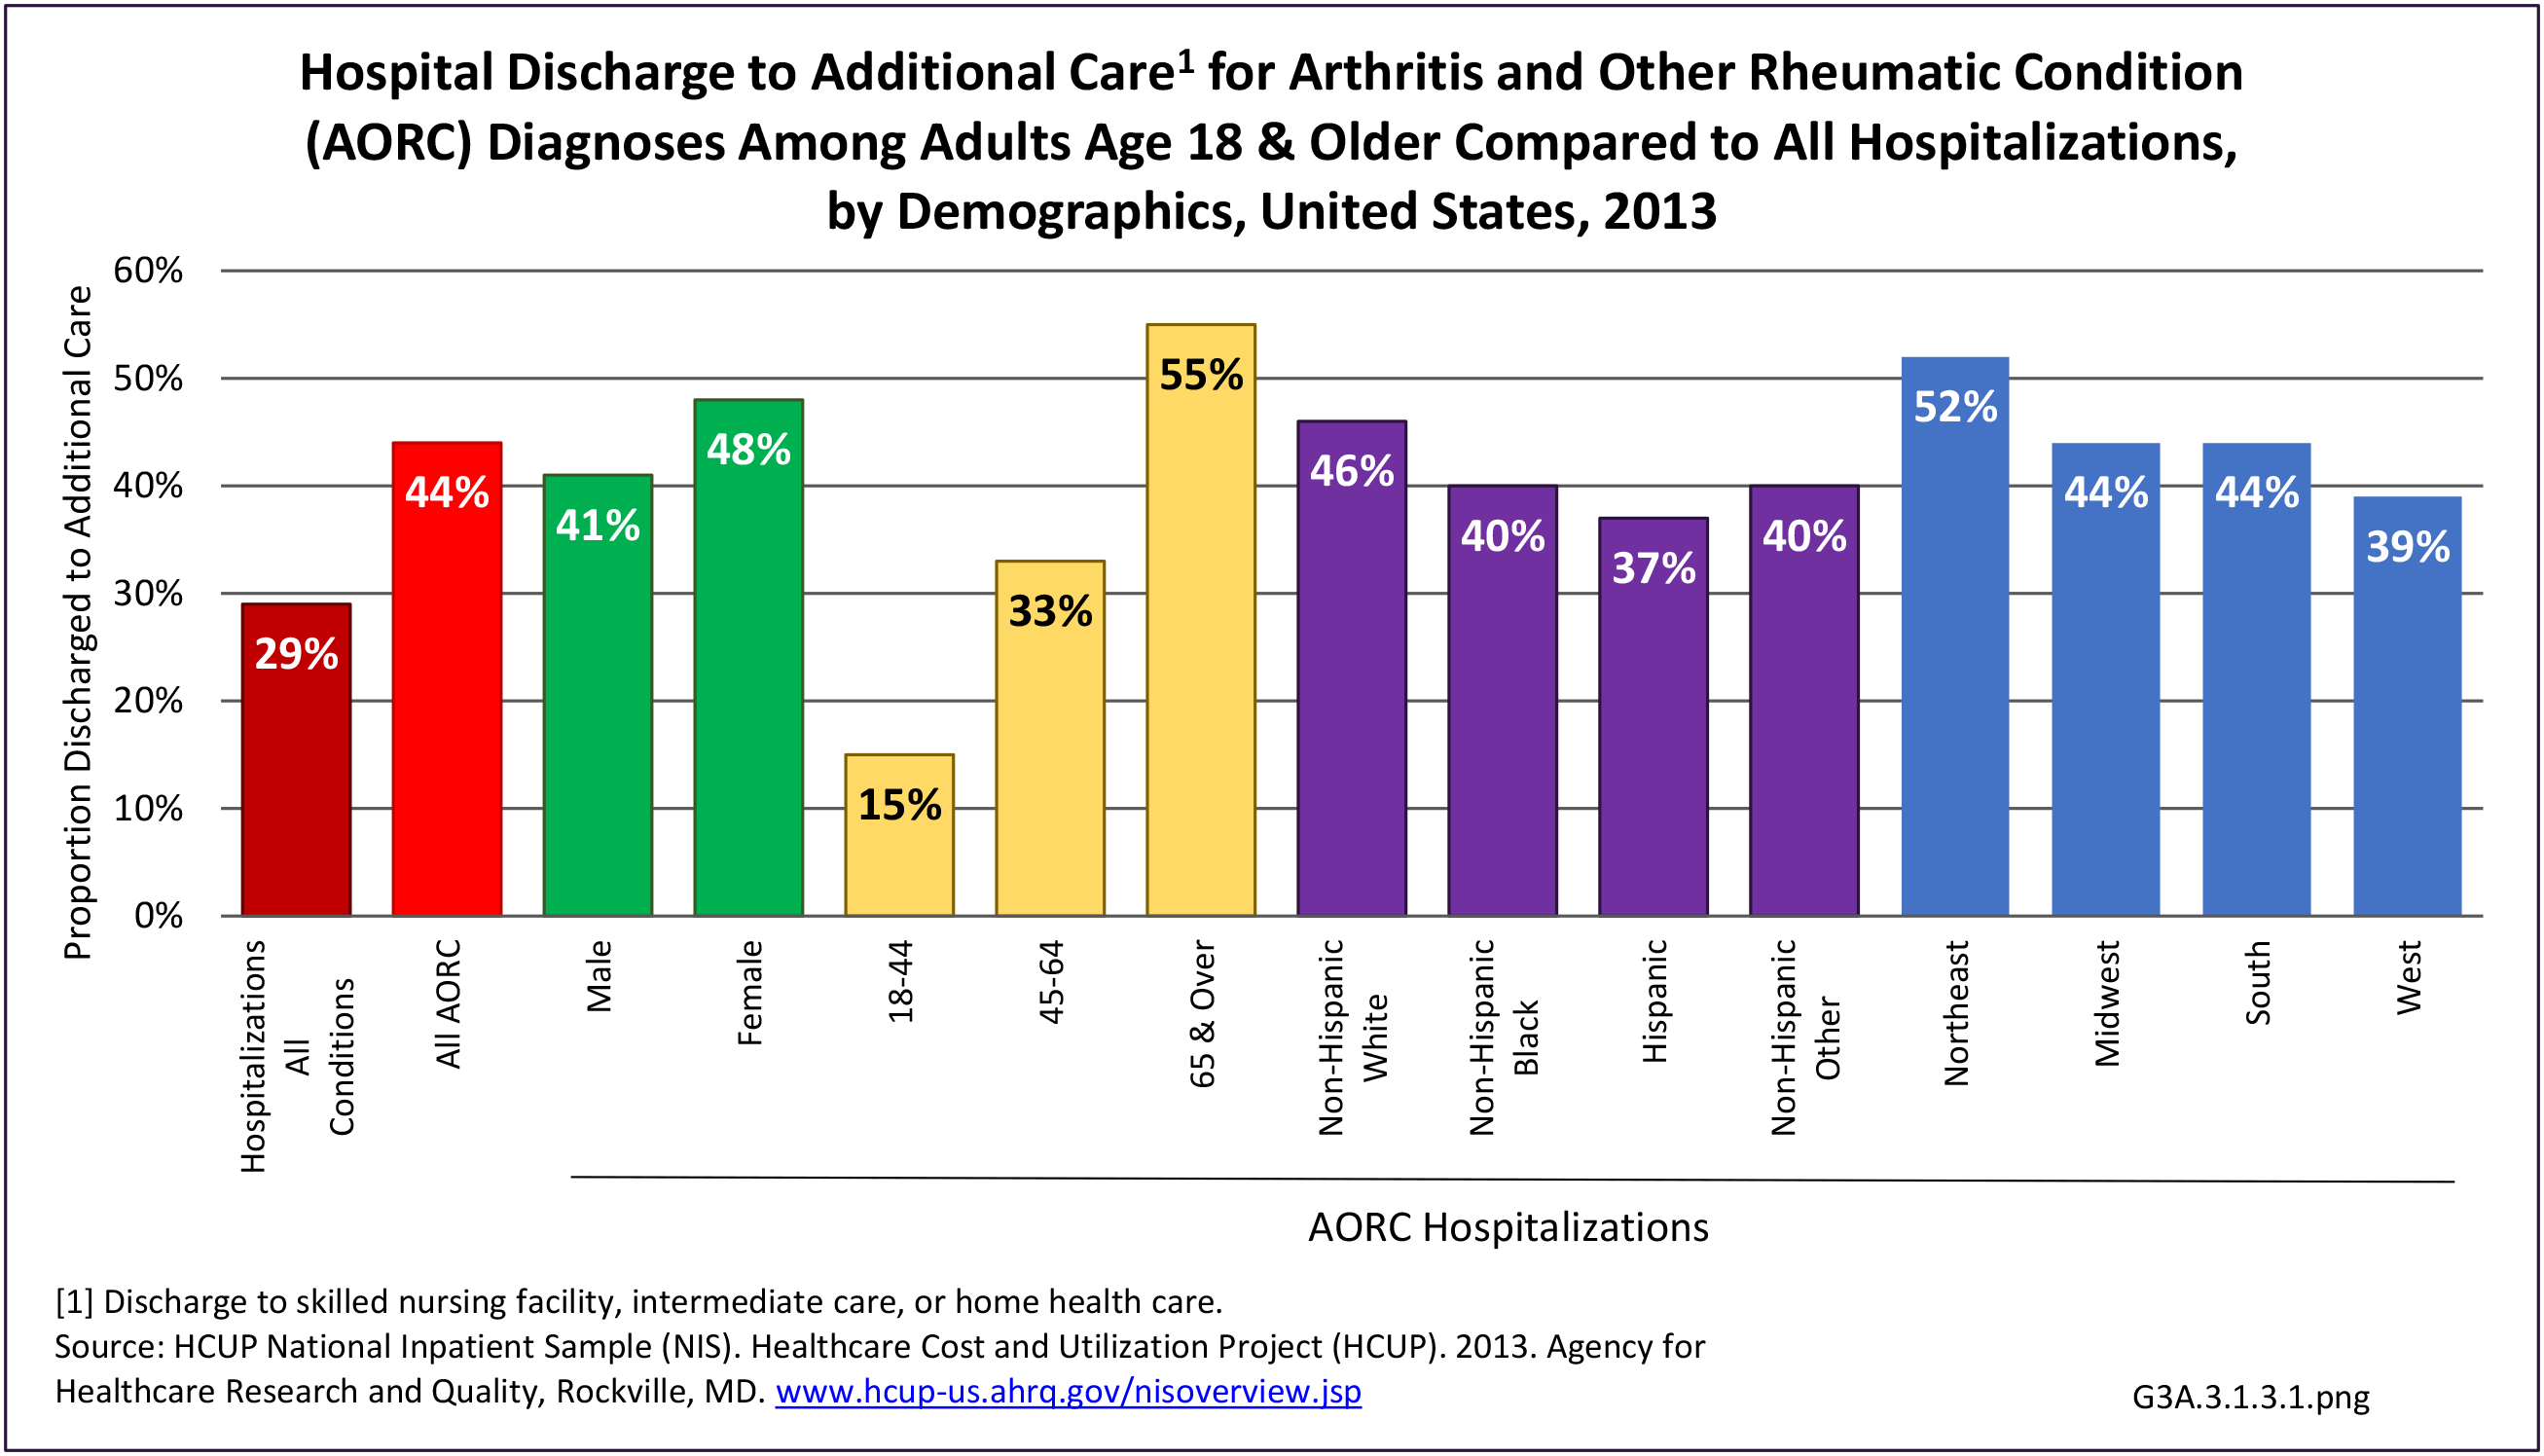
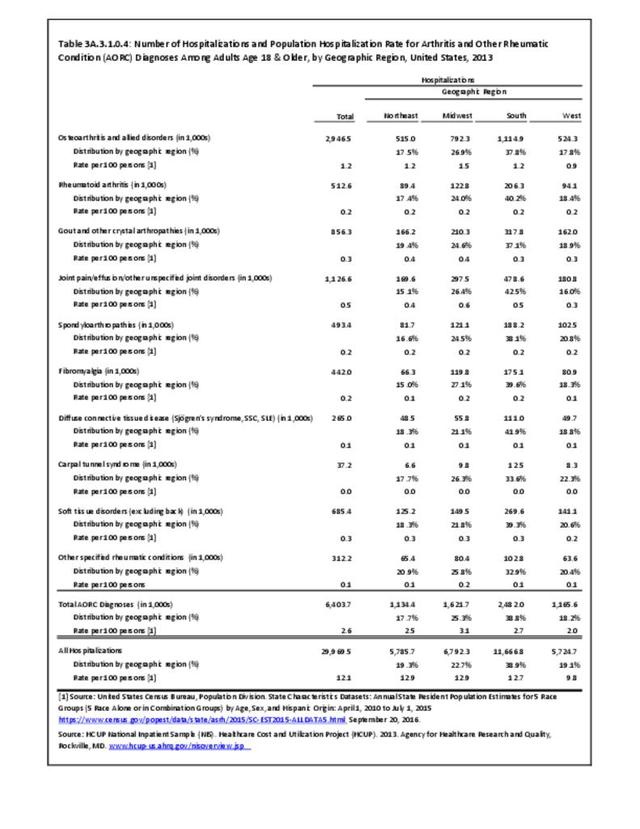
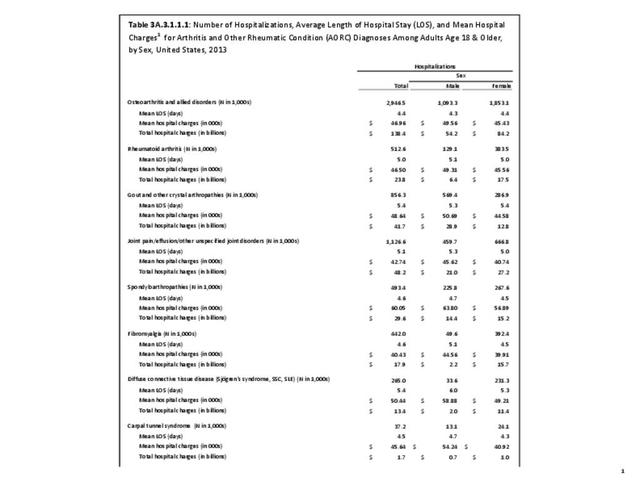
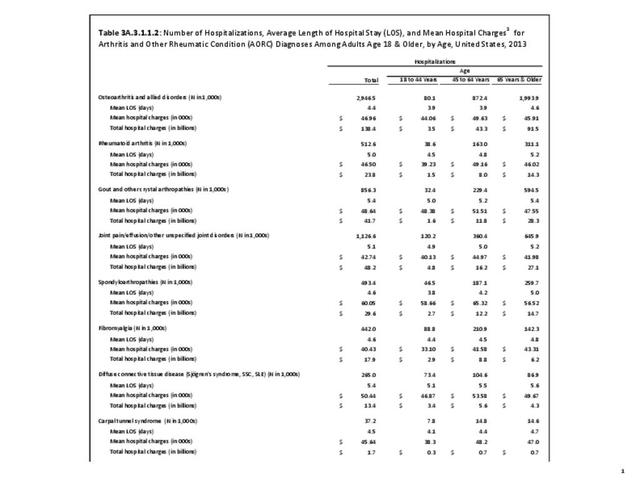
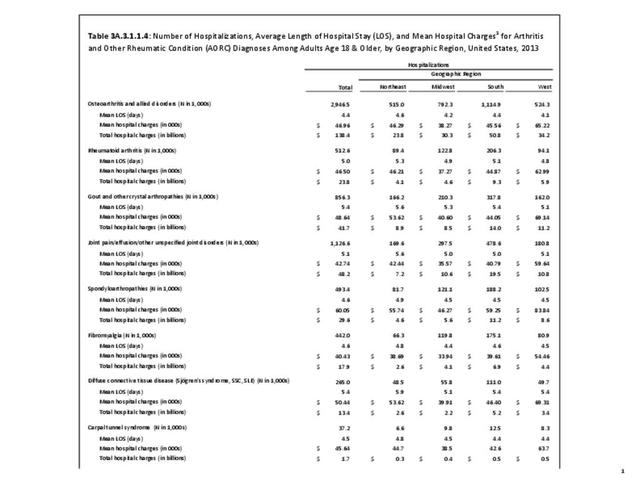
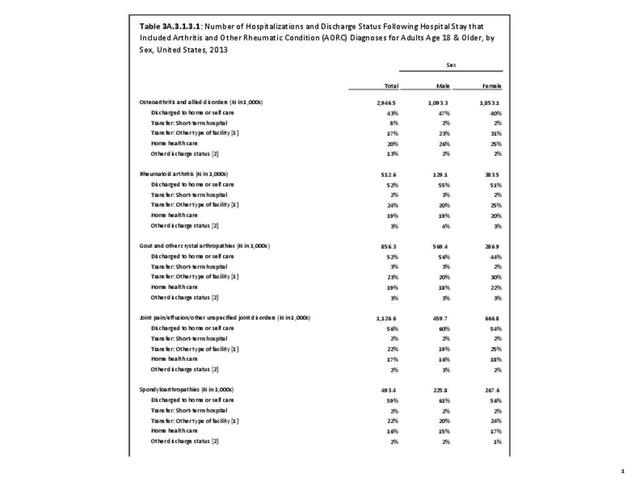
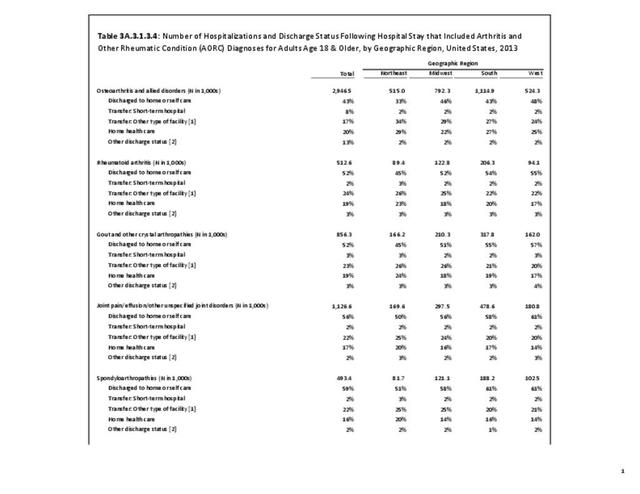
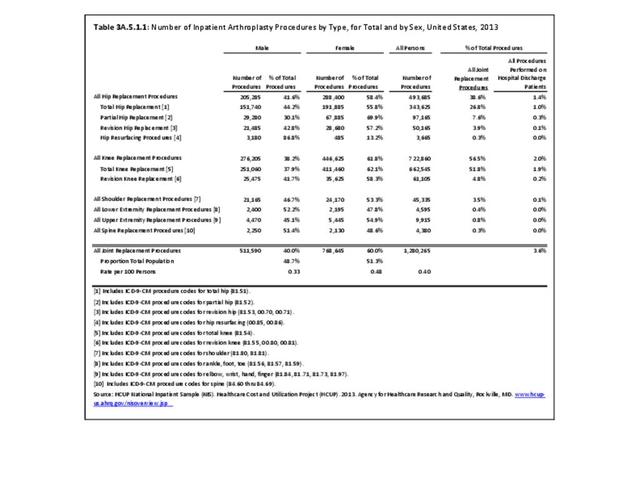
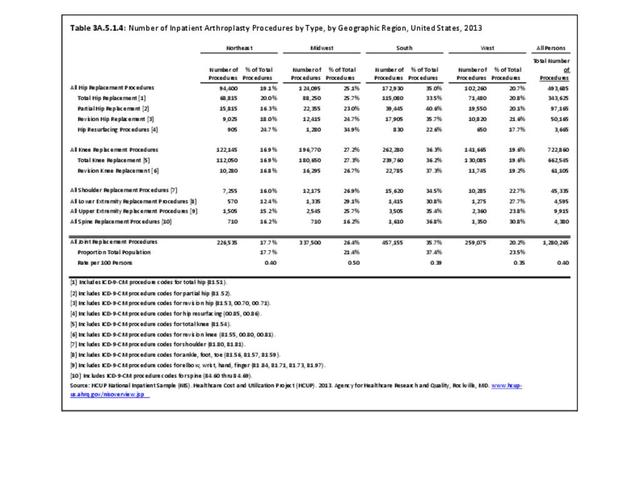
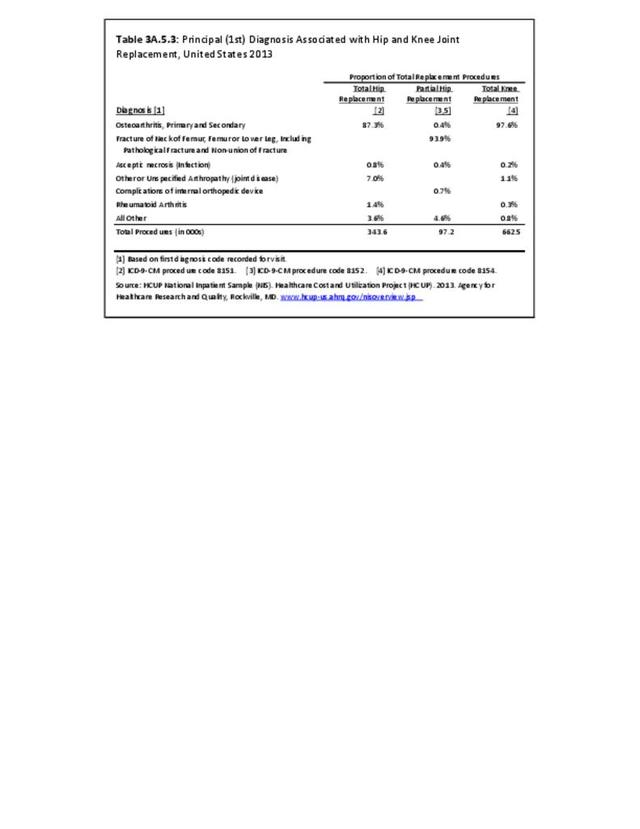
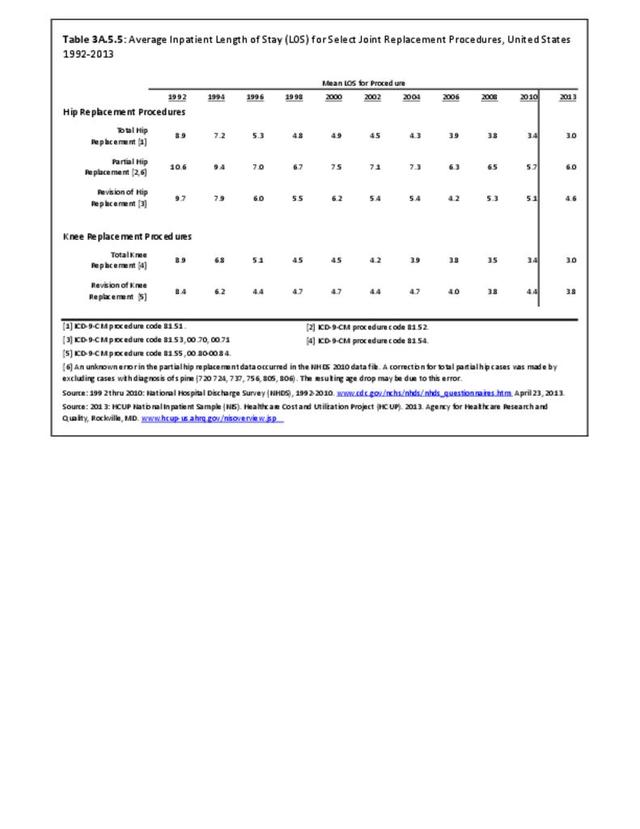
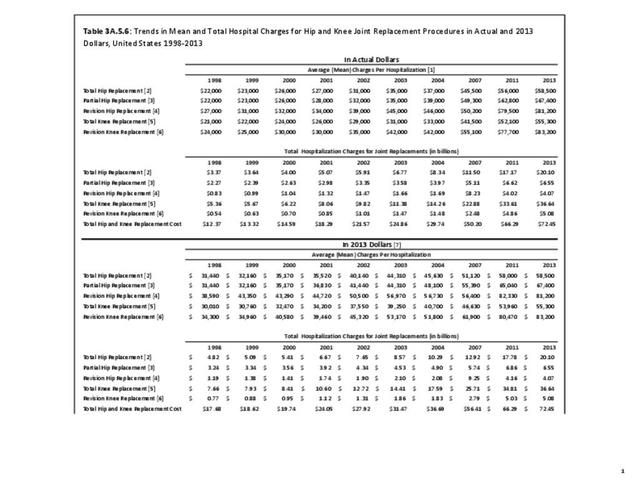
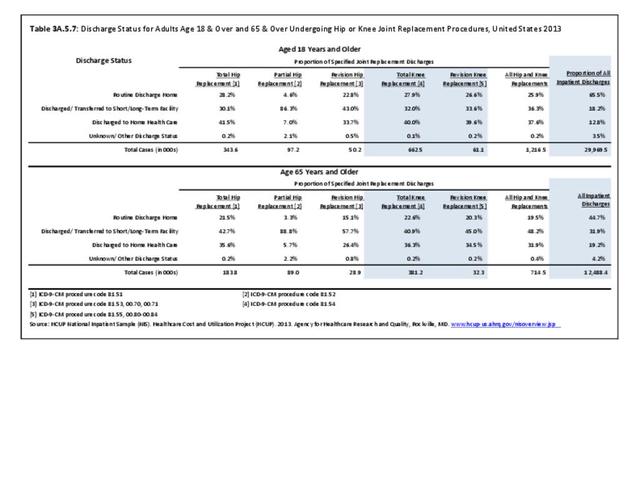
Nearly 3 million hospital stays in 2013 had an OA diagnosis and it was the leading cause (46%) of hospitalization among all arthritis diagnoses. Osteoarthritis accounted for 45% of total hospital charges for arthritis diagnoses (cost charged but not necessarily paid), presumably in part because OA is the principal diagnosis associated with hip and knee joint replacements. Fewer than half (43%) of patients with an OA diagnosis were discharged to home or self-care, the lowest share of all arthritis diagnosed hospitalized patients. This is probably due to discharges to assisted living facilities or skilled nursing homes for rehabilitation following the hip or knee joint replacement. (Reference Table 3A.3.0.1 PDF CSV; Table 3A.3.1.1.1 PDF CSV; Table 3A.3.1.3.1 PDF CSV; and Table 3A.5.3 PDF CSV)

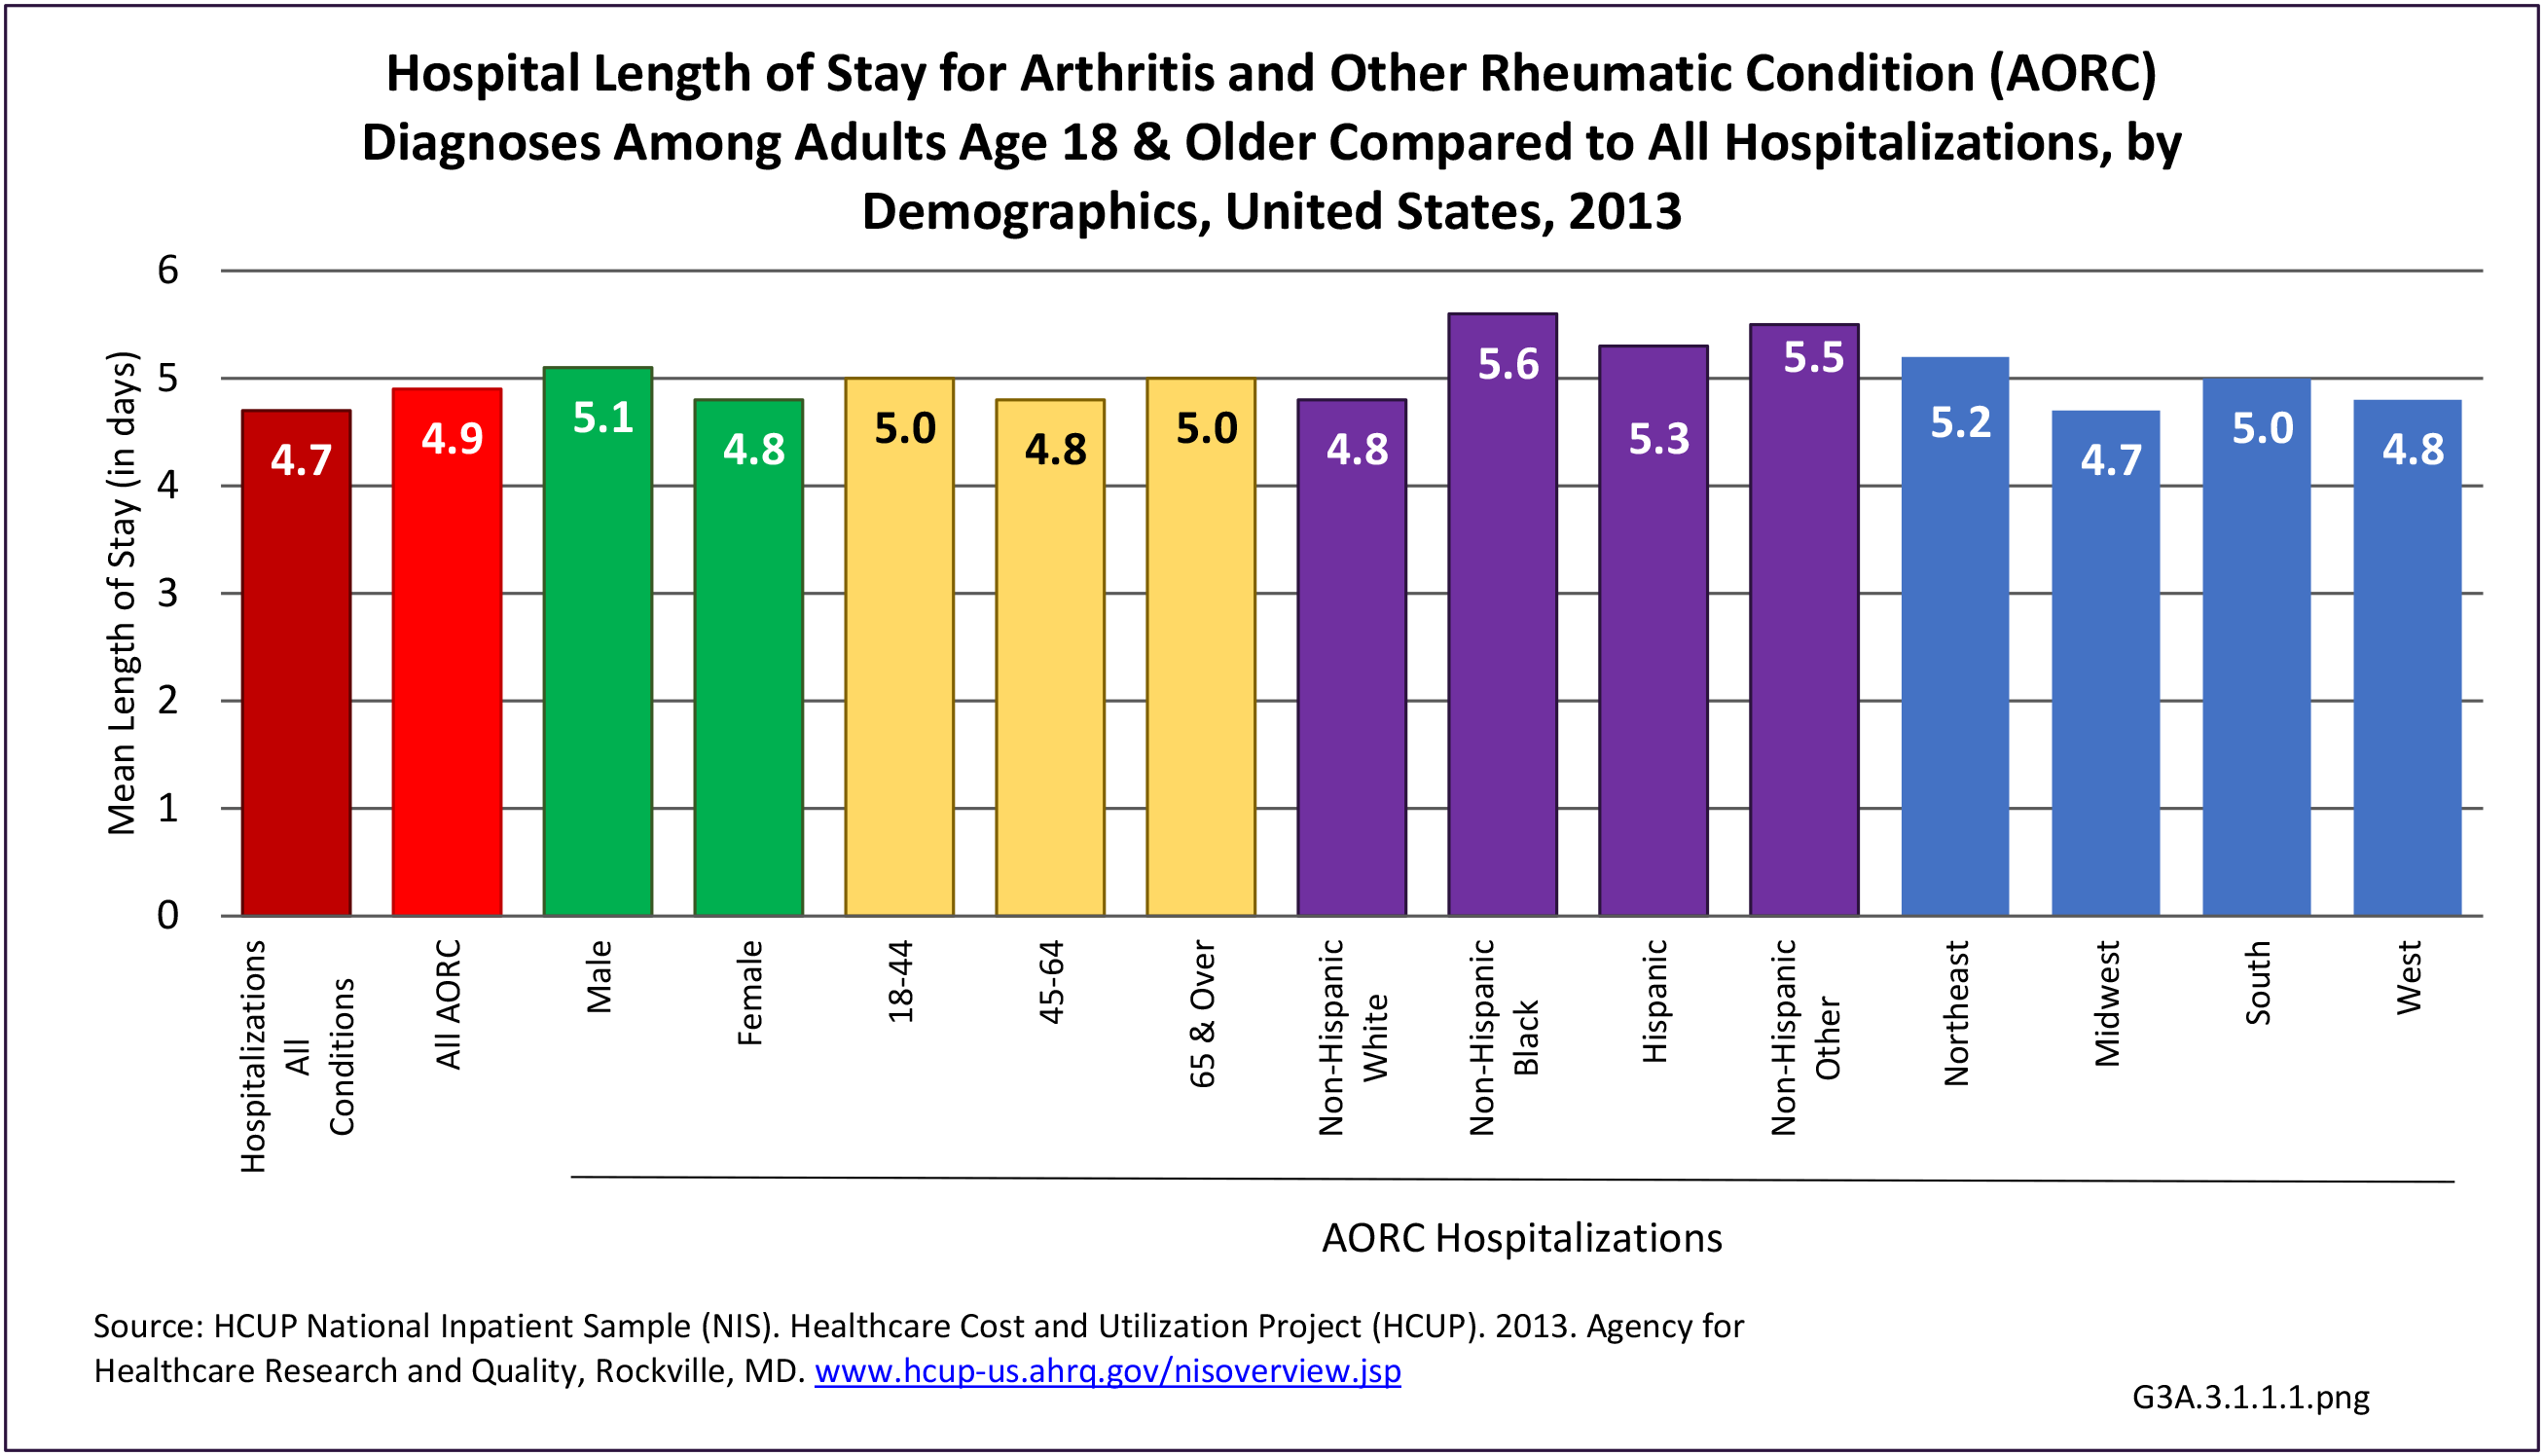
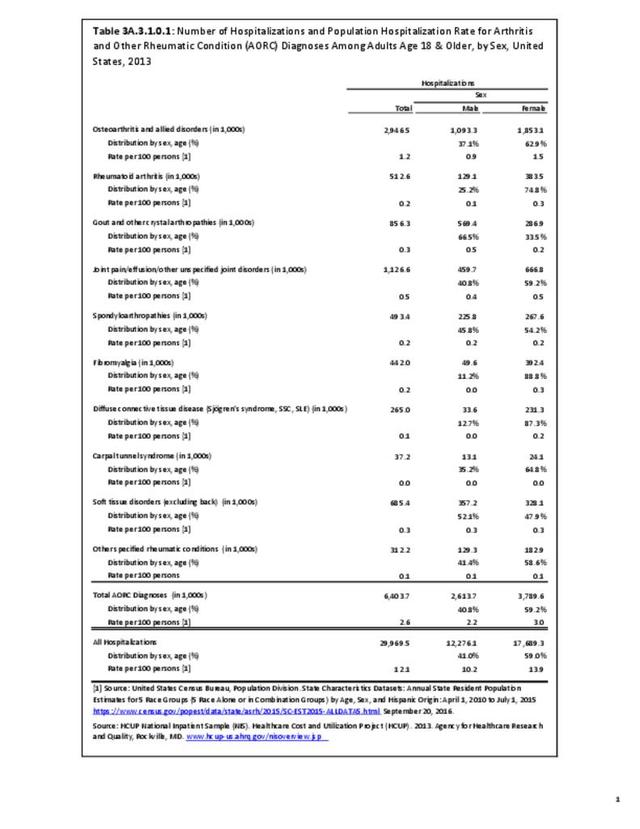
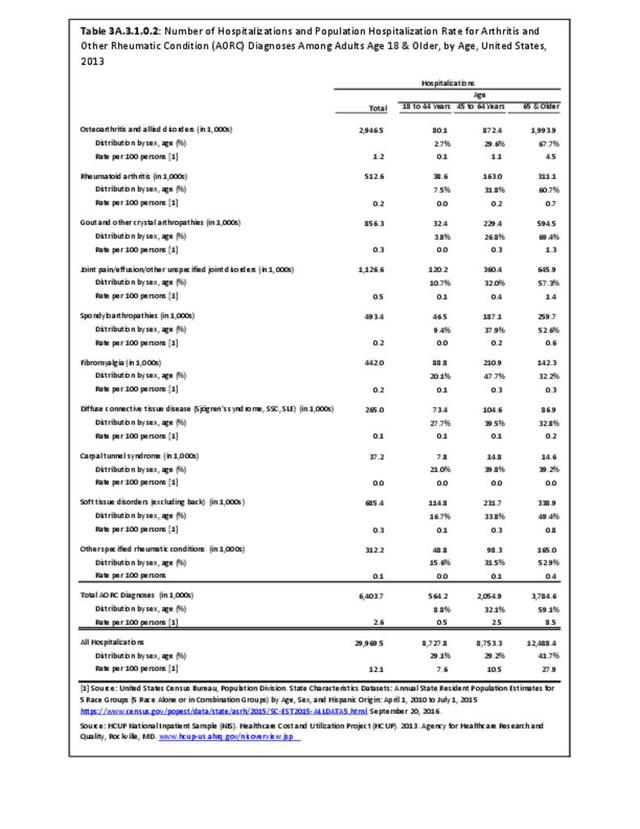
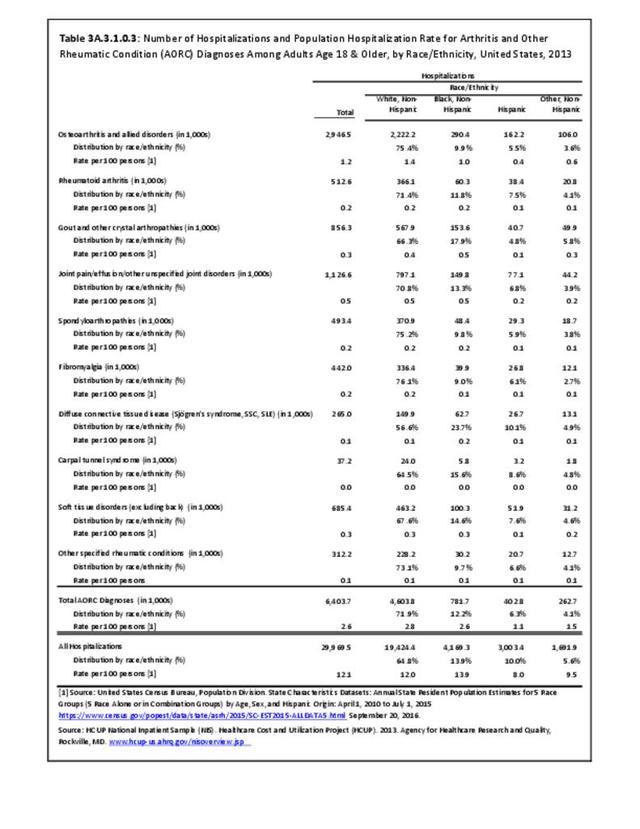
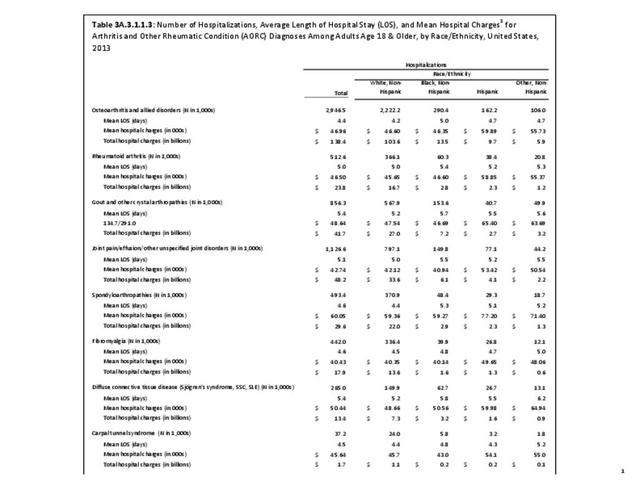
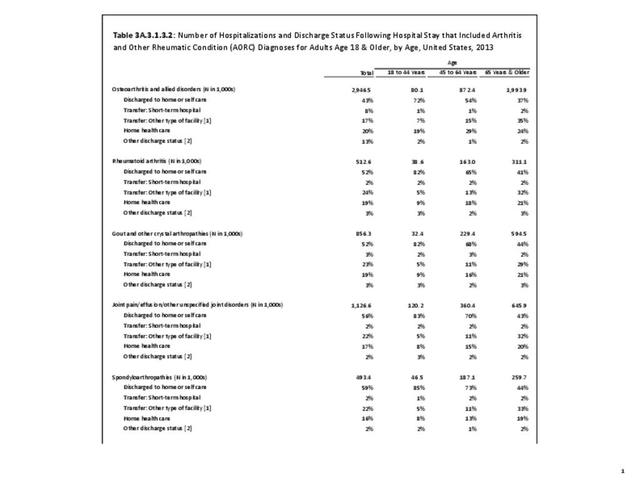
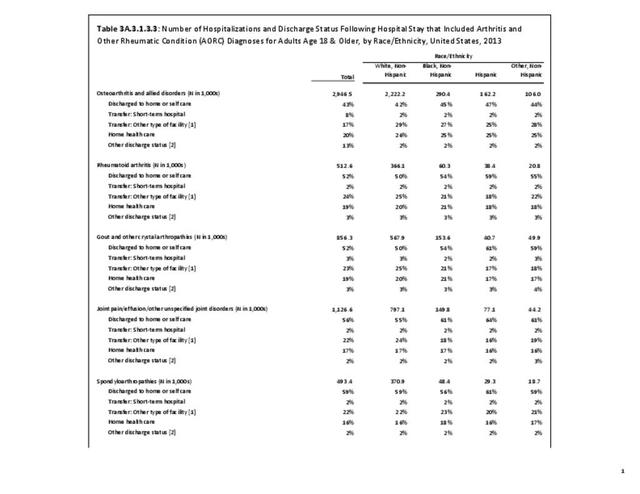
Females hospitalized with OA outnumber males two to one, while two in three patients were age 65 and older and hospitalized at a rate of 4.5 in 100. Non-Hispanic whites had the highest rate of hospitalization for OA (1.4 in 100 persons), while Hispanics had the lowest rate (0.4/100). Residents of the Midwest region were also more likely to be hospitalized with a diagnosis of OA (1.5/100), while those living in the West were least likely (0.9/100). Regional differences are a product of age to some degree, with the mean age of the Northeast and Midwest about 4 years older than the West. (Reference Table 3A.3.1.0.1 PDF CSV; Table 3A.3.1.0.2 PDF CSV; Table 3A.3.1.0.3 PDF CSV; and Table 3A.3.1.0.4 PDF CSV)
Ambulatory Care Visits
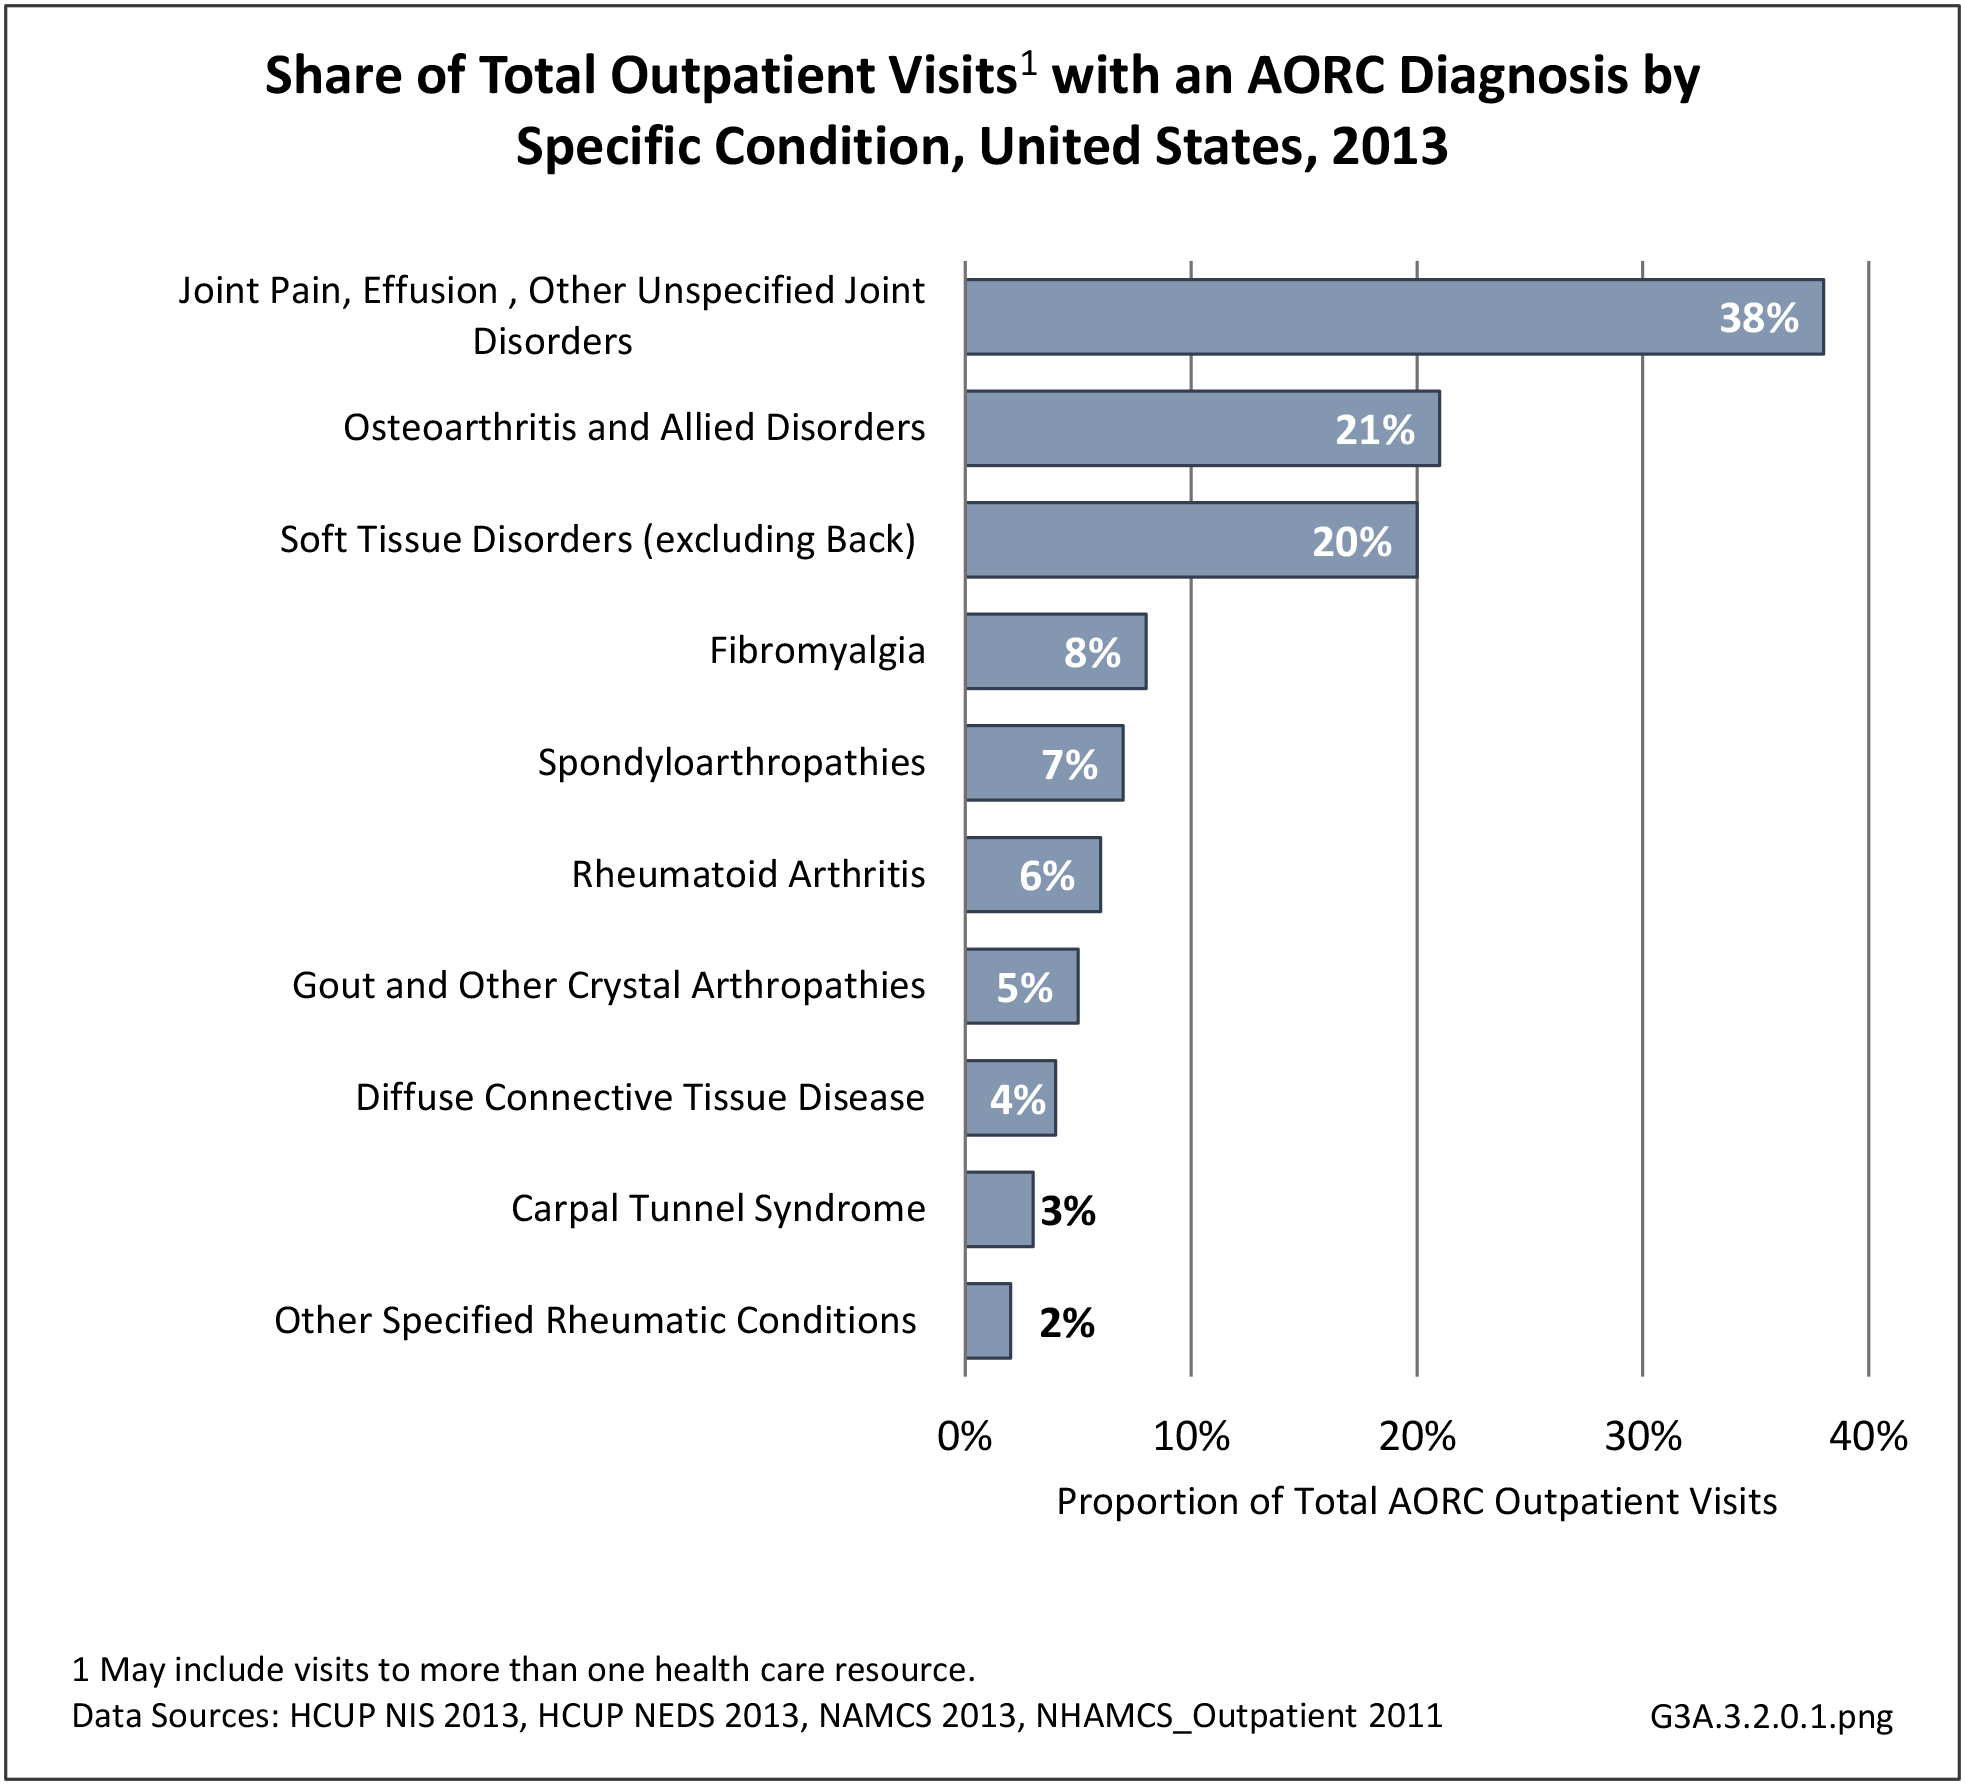
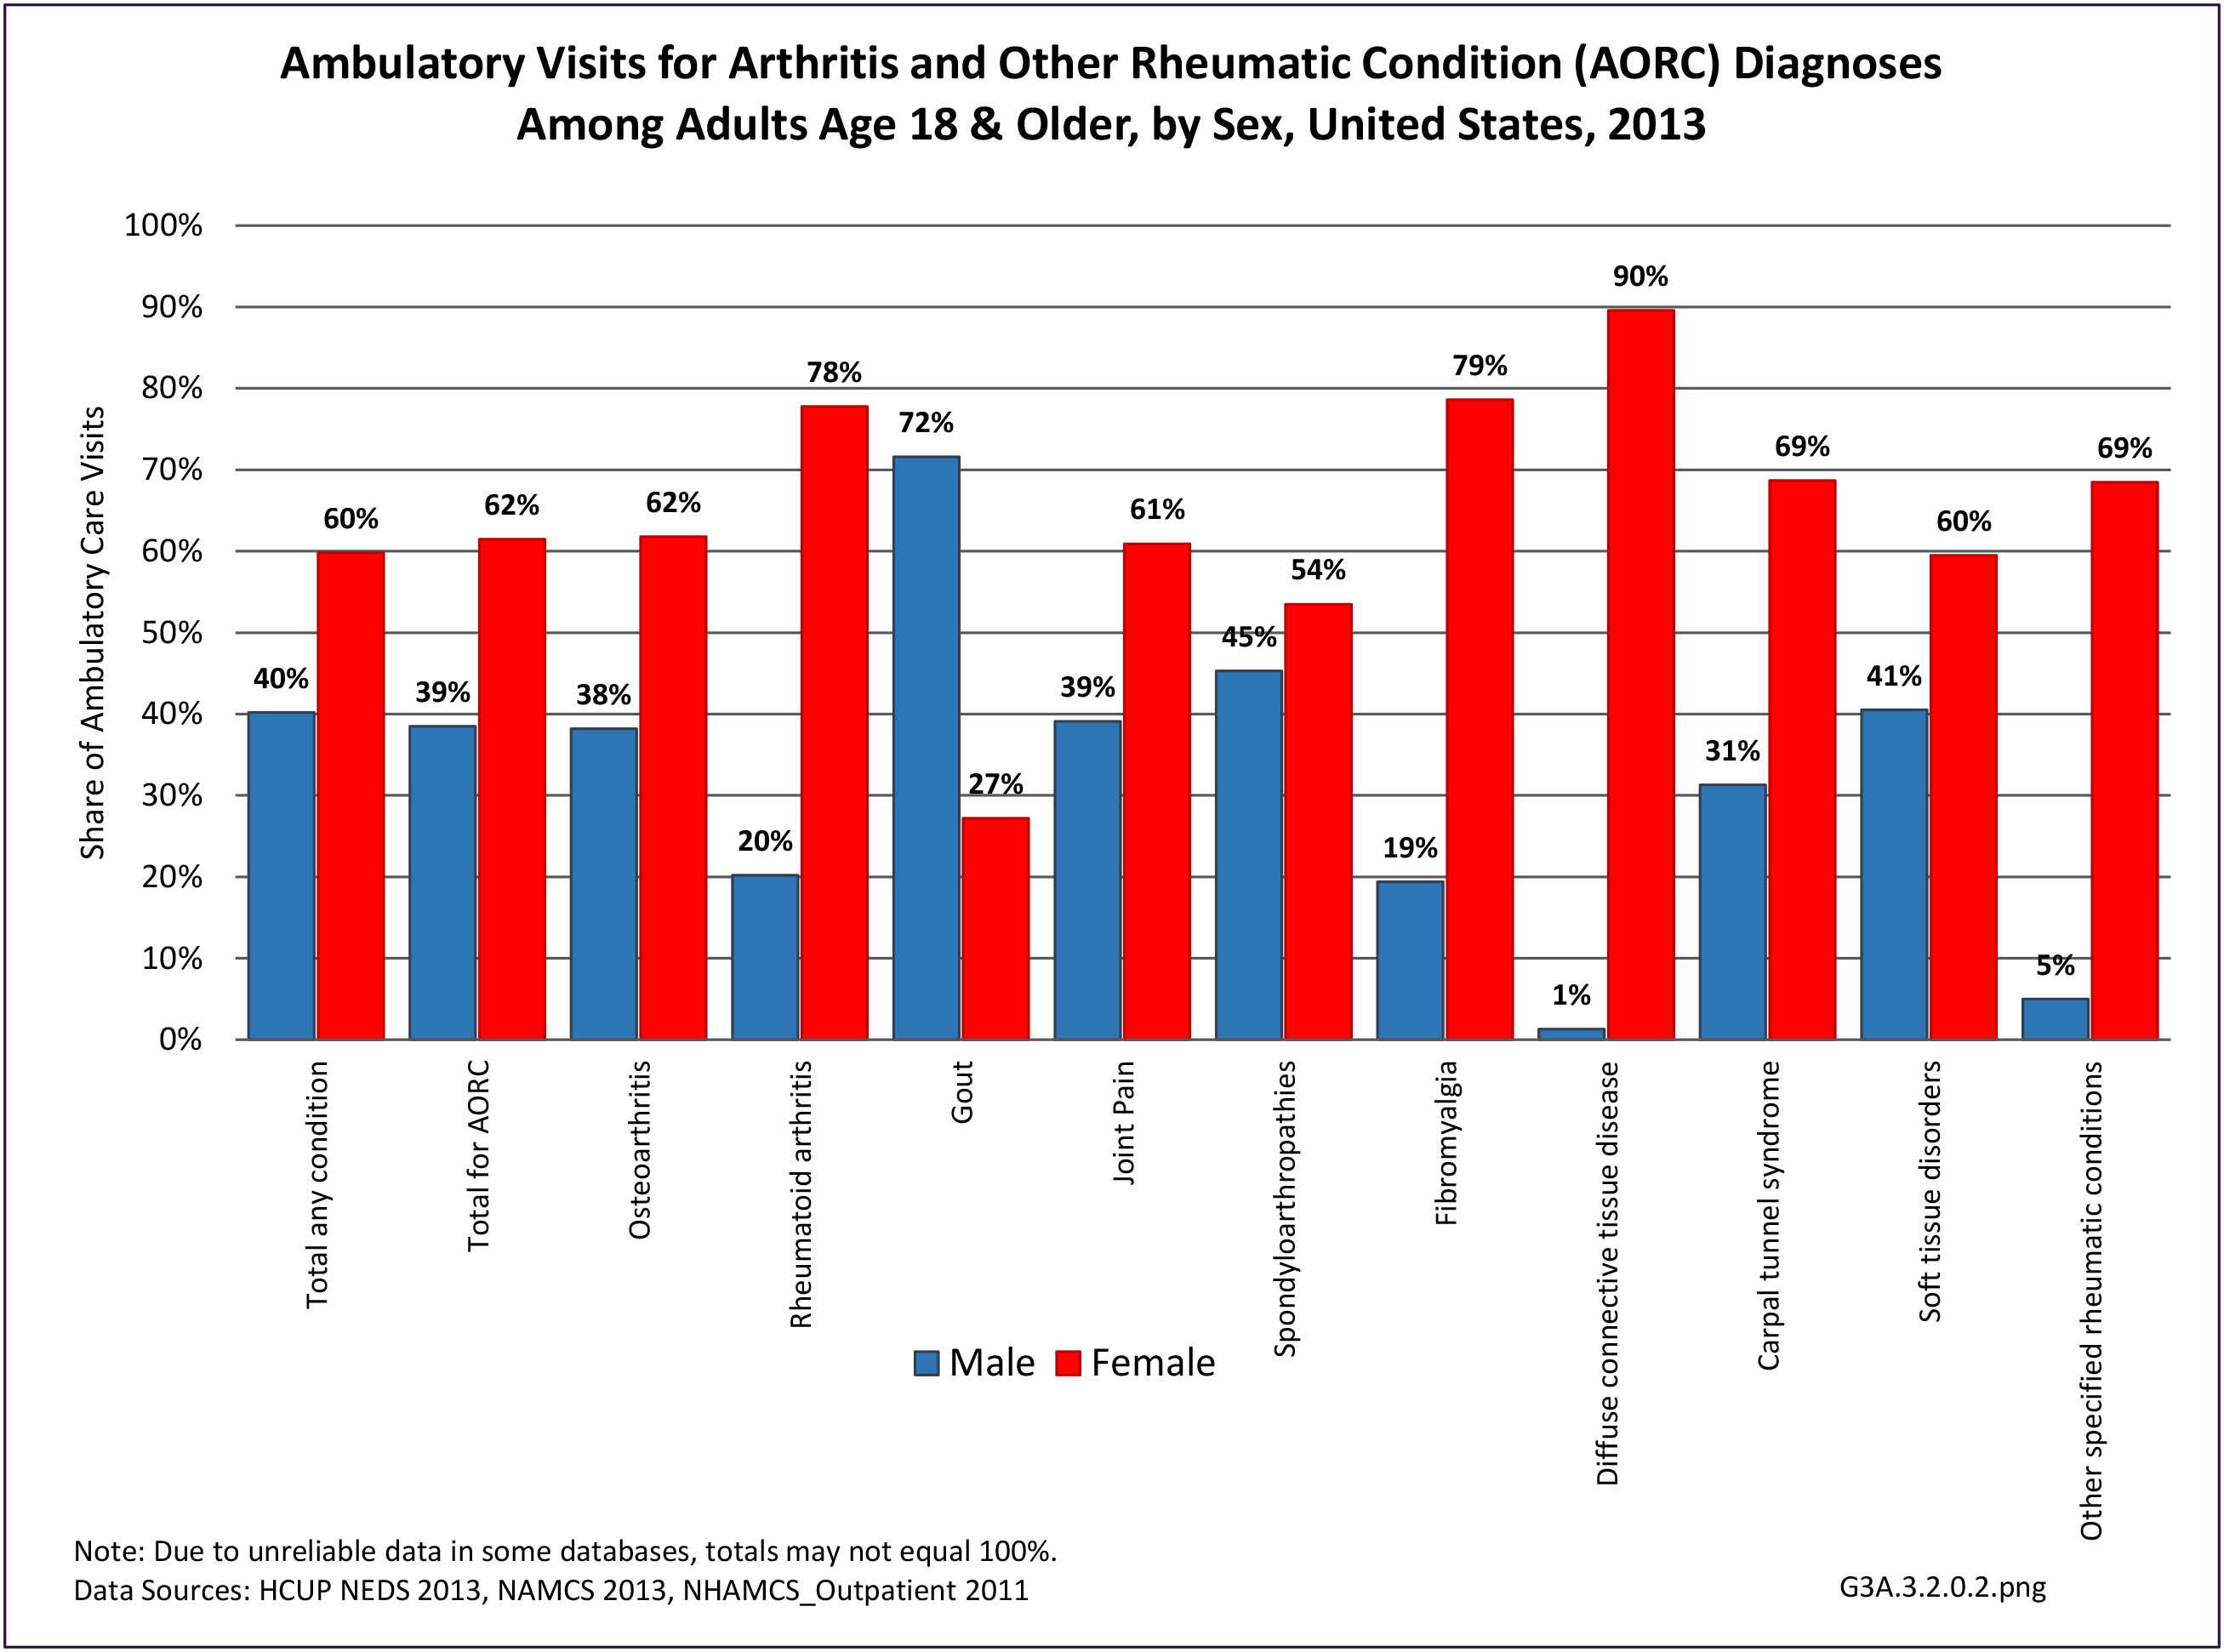
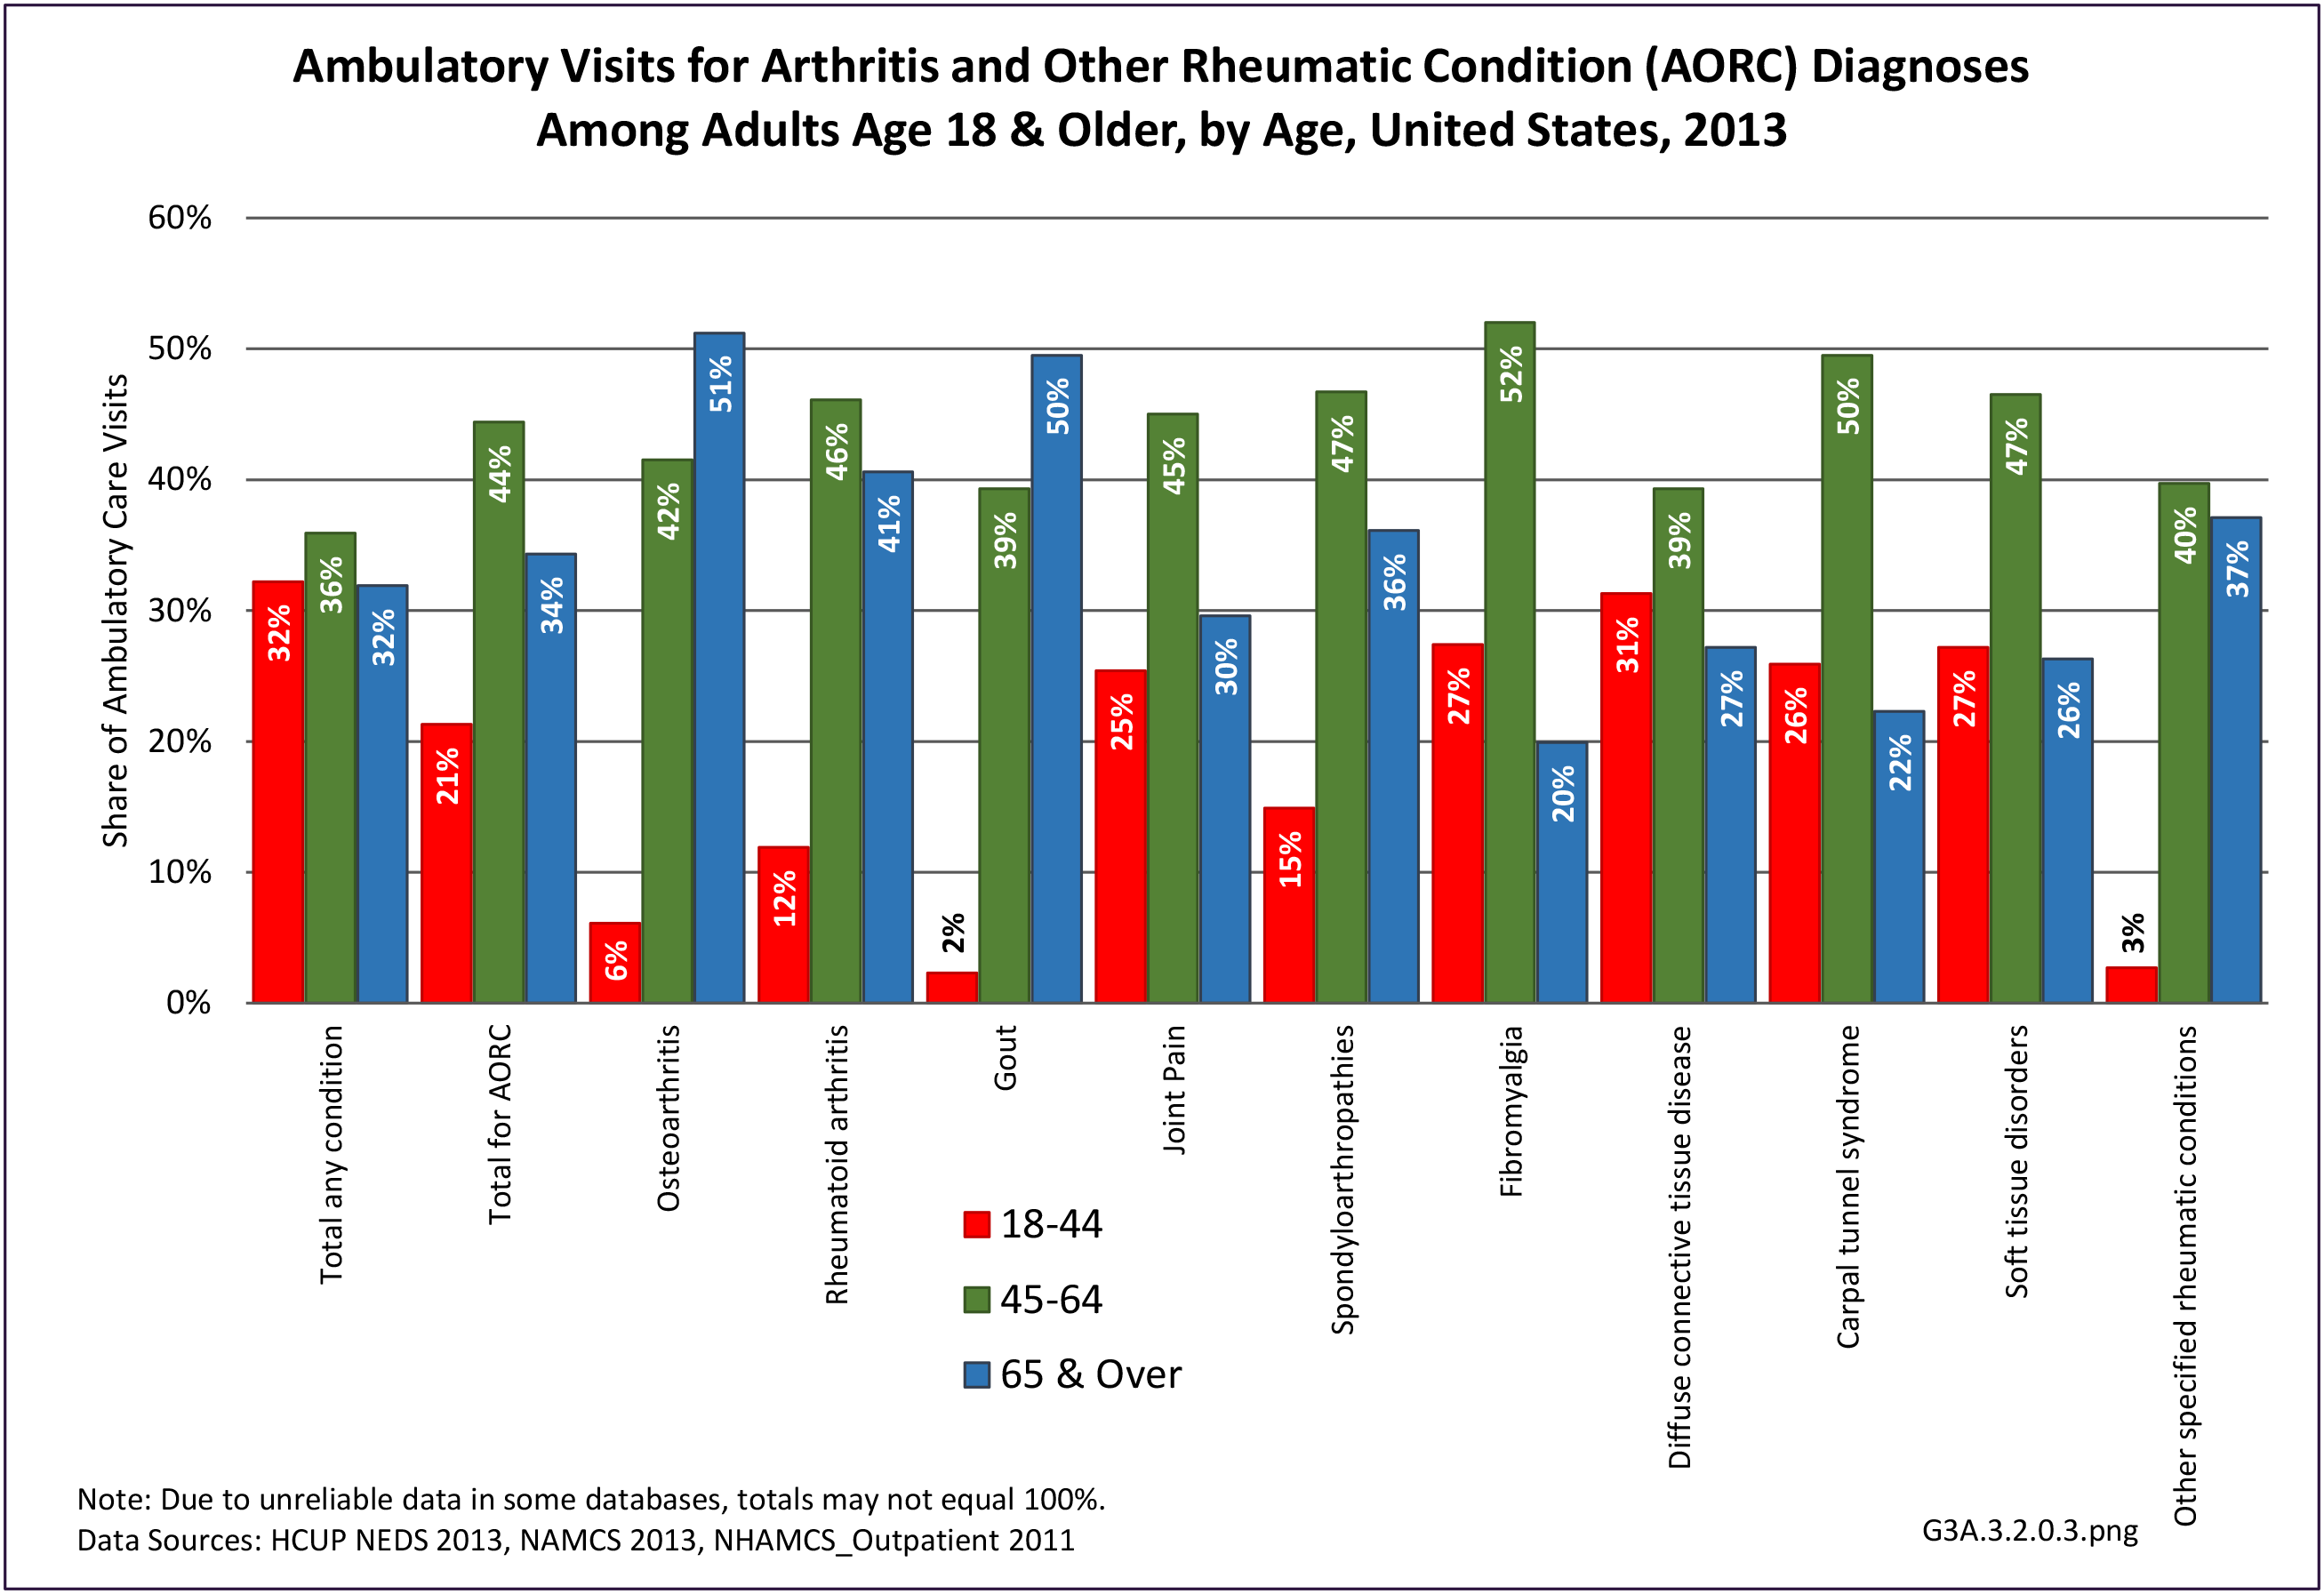
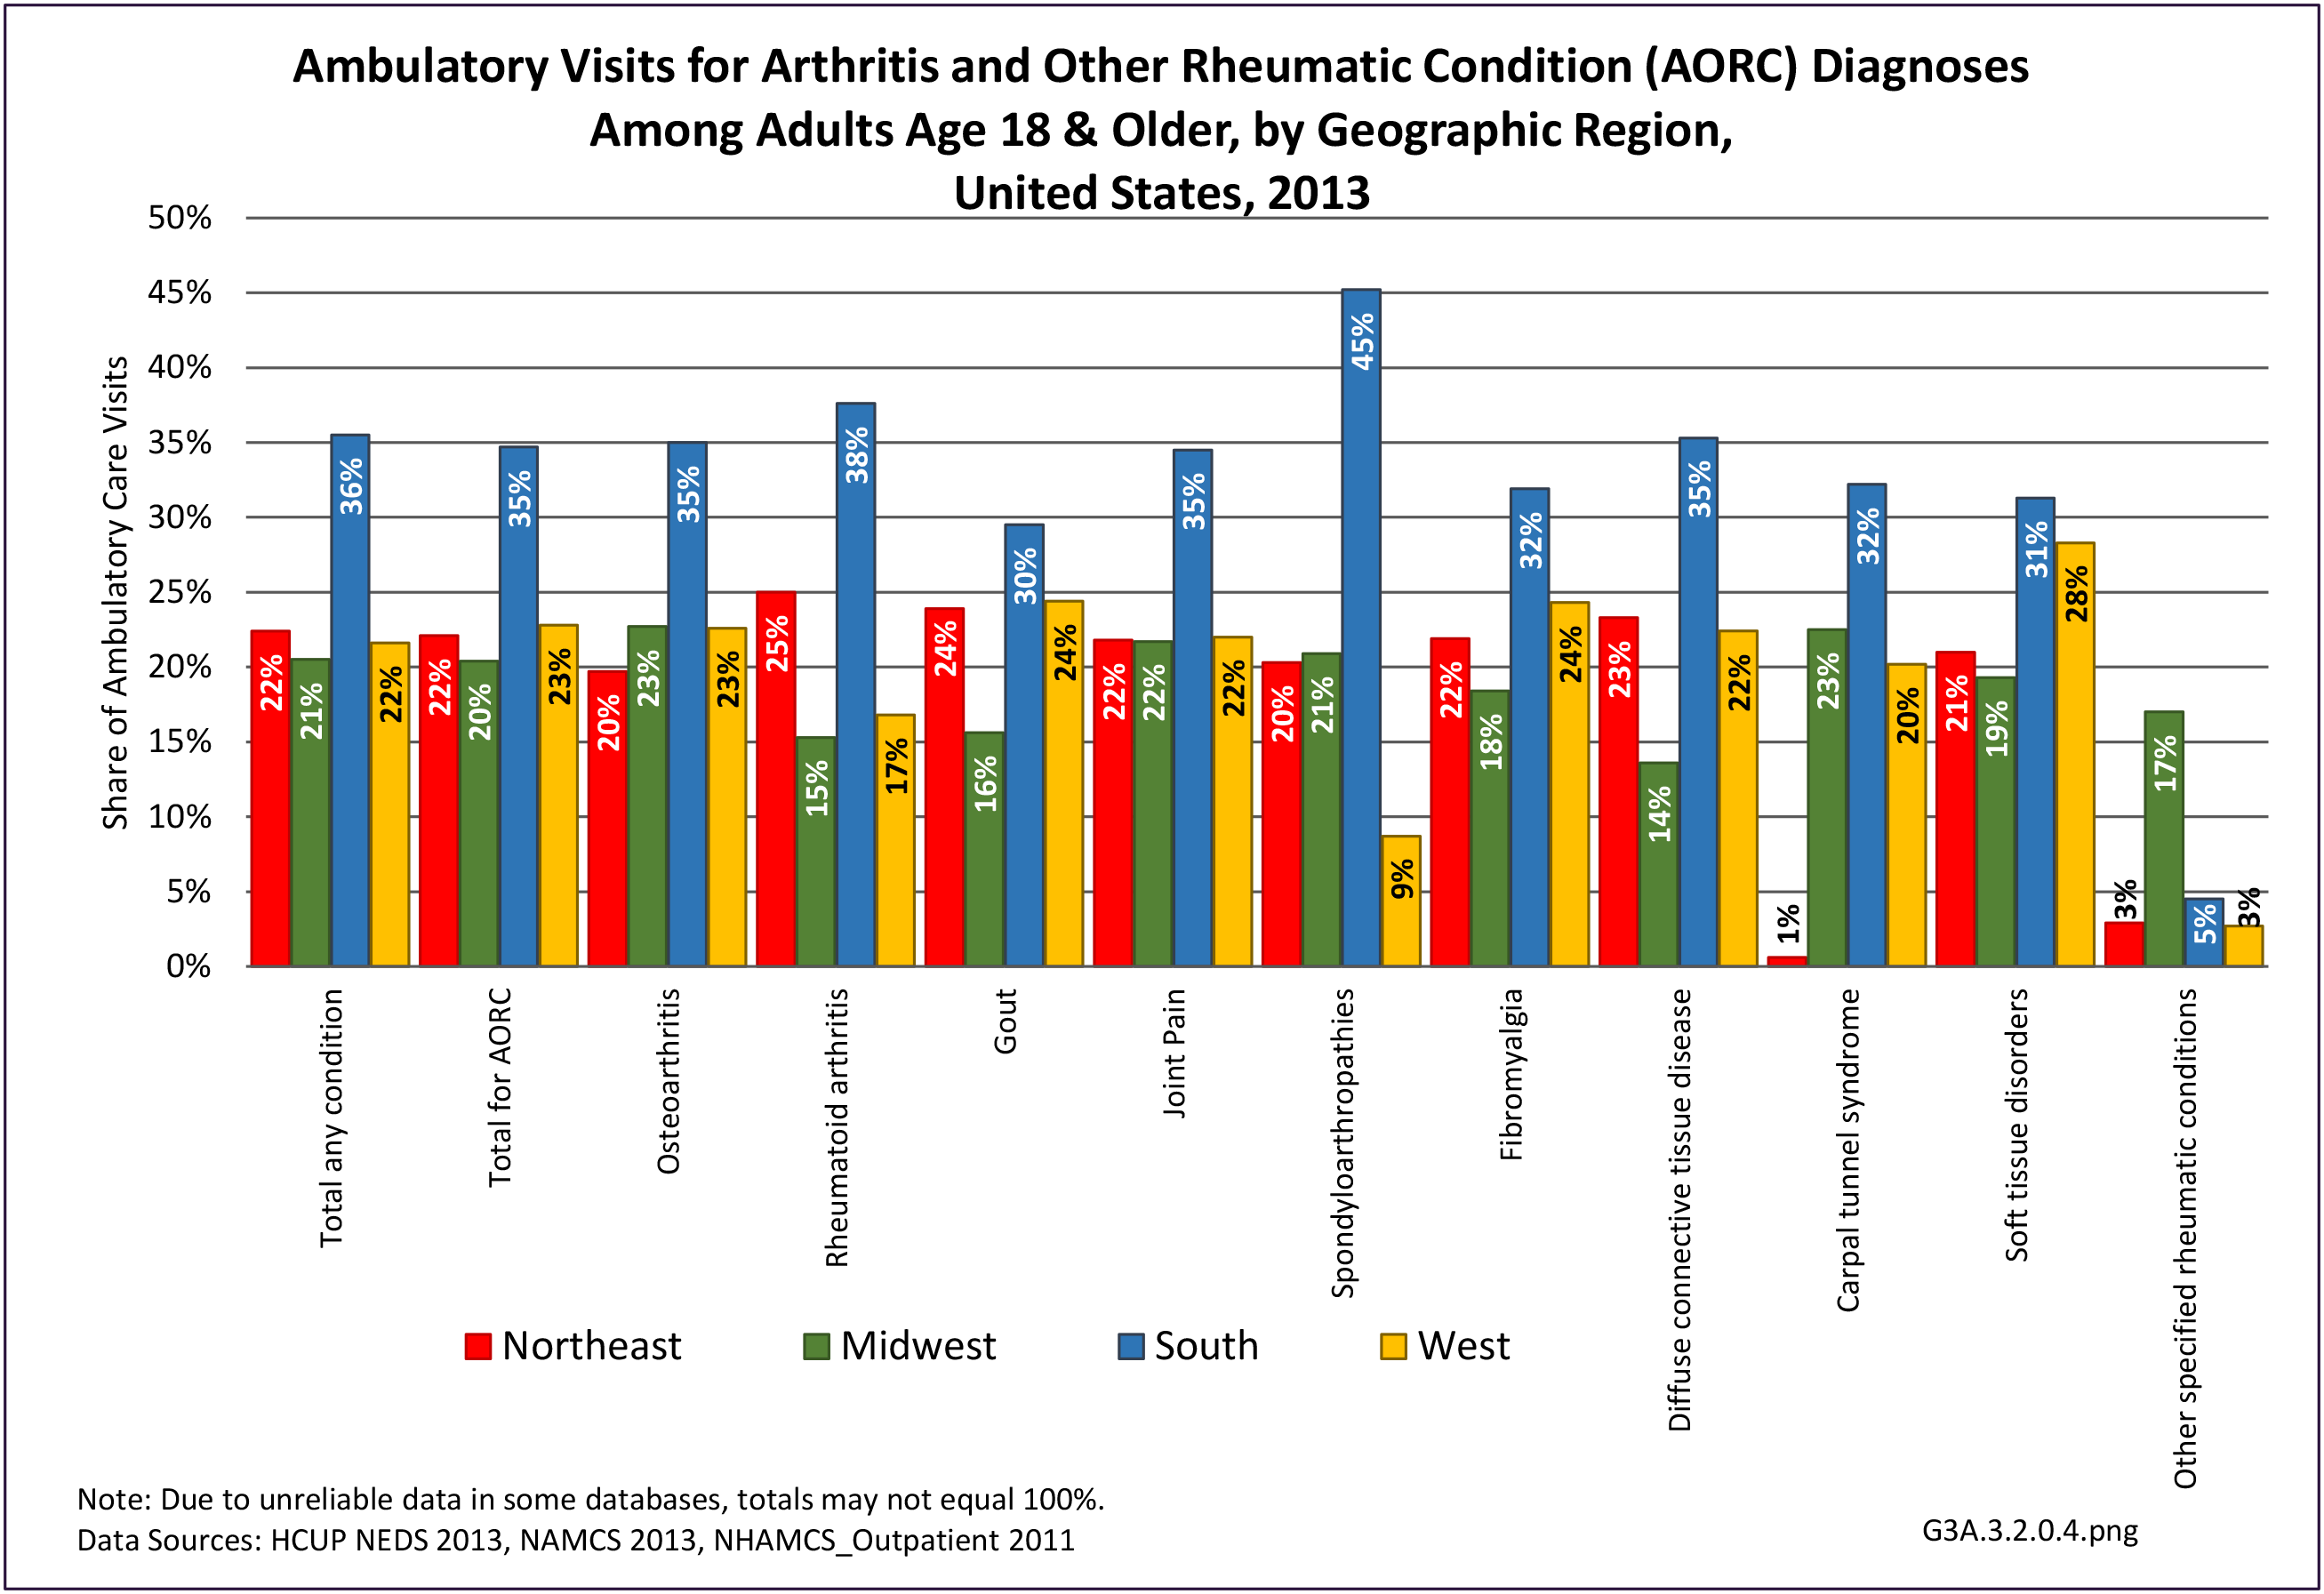
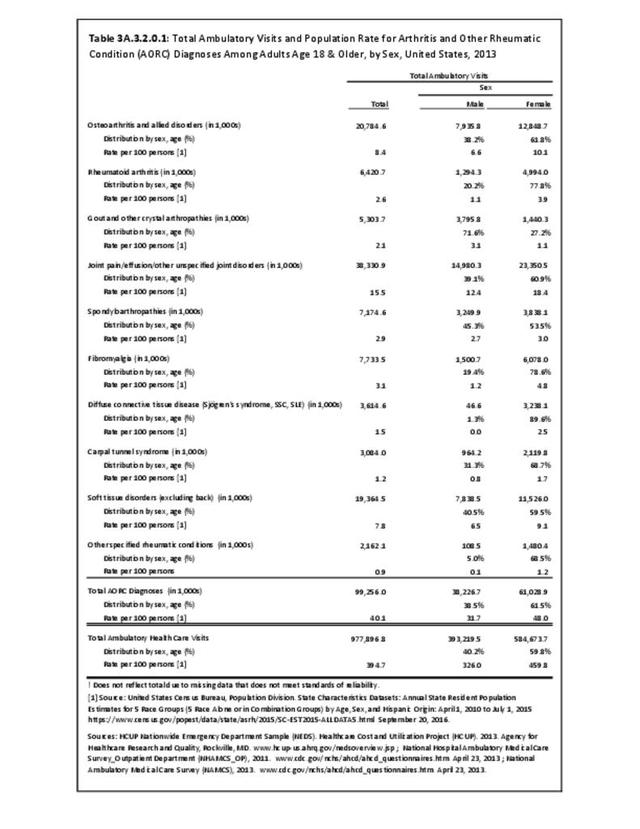
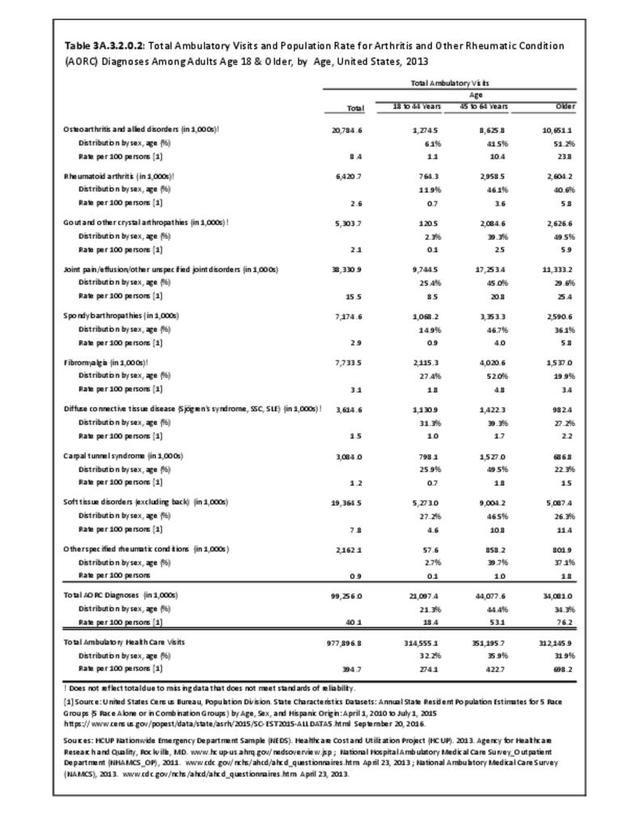
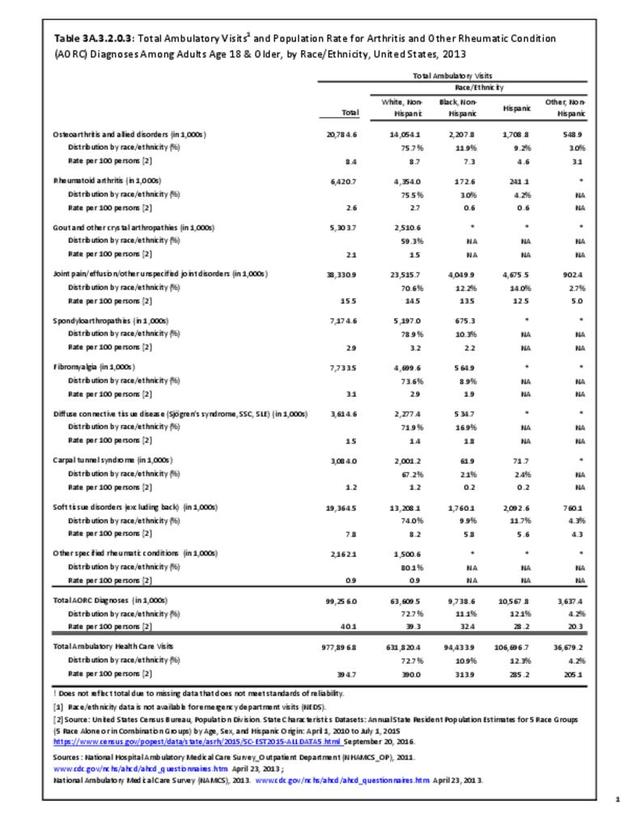
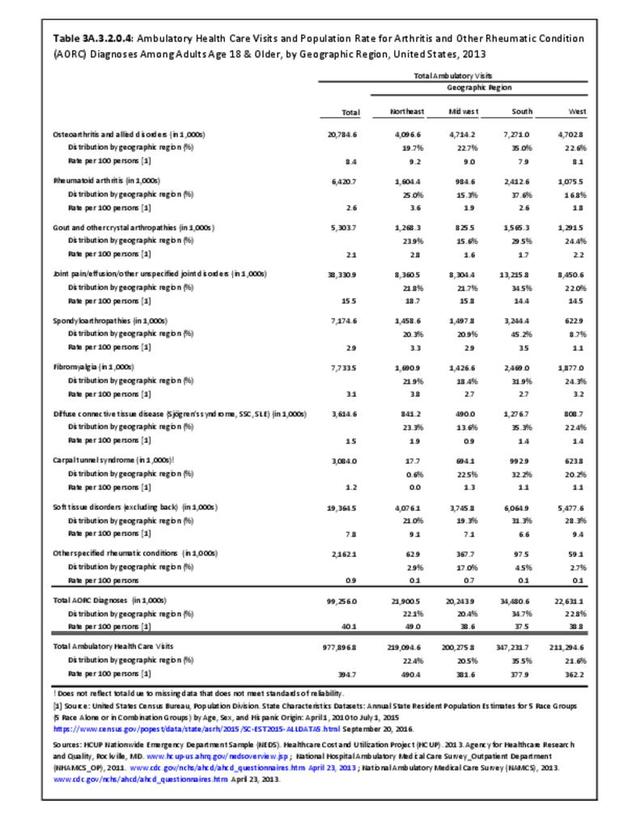
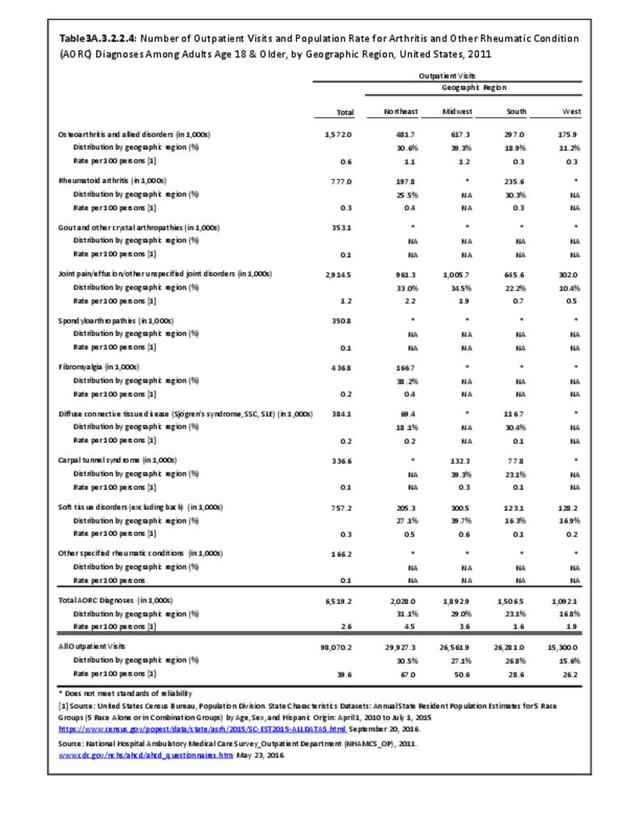
Osteoarthritis was diagnosed in 20.8 million outpatient visits in 2013 and accounted for one in five (21%) ambulatory care visits with any arthritis diagnosis. This was a rate of 1 in 12 (8.4%) outpatient visits for any diagnoses including an OA diagnosis. Visits per 100 were higher among females, adults 45 years and older, and non-Hispanic whites and blacks. Residents in the South had the lowest rate of outpatient visits for OA. (Reference Table 3A.3.2.0.1 PDF CSV; Table 3A.3.2.0.2 PDF CSV; Table 3A.3.2.0.3 PDF CSV; Table 3A.3.2.0.4 PDF CSV)
Economic Burden
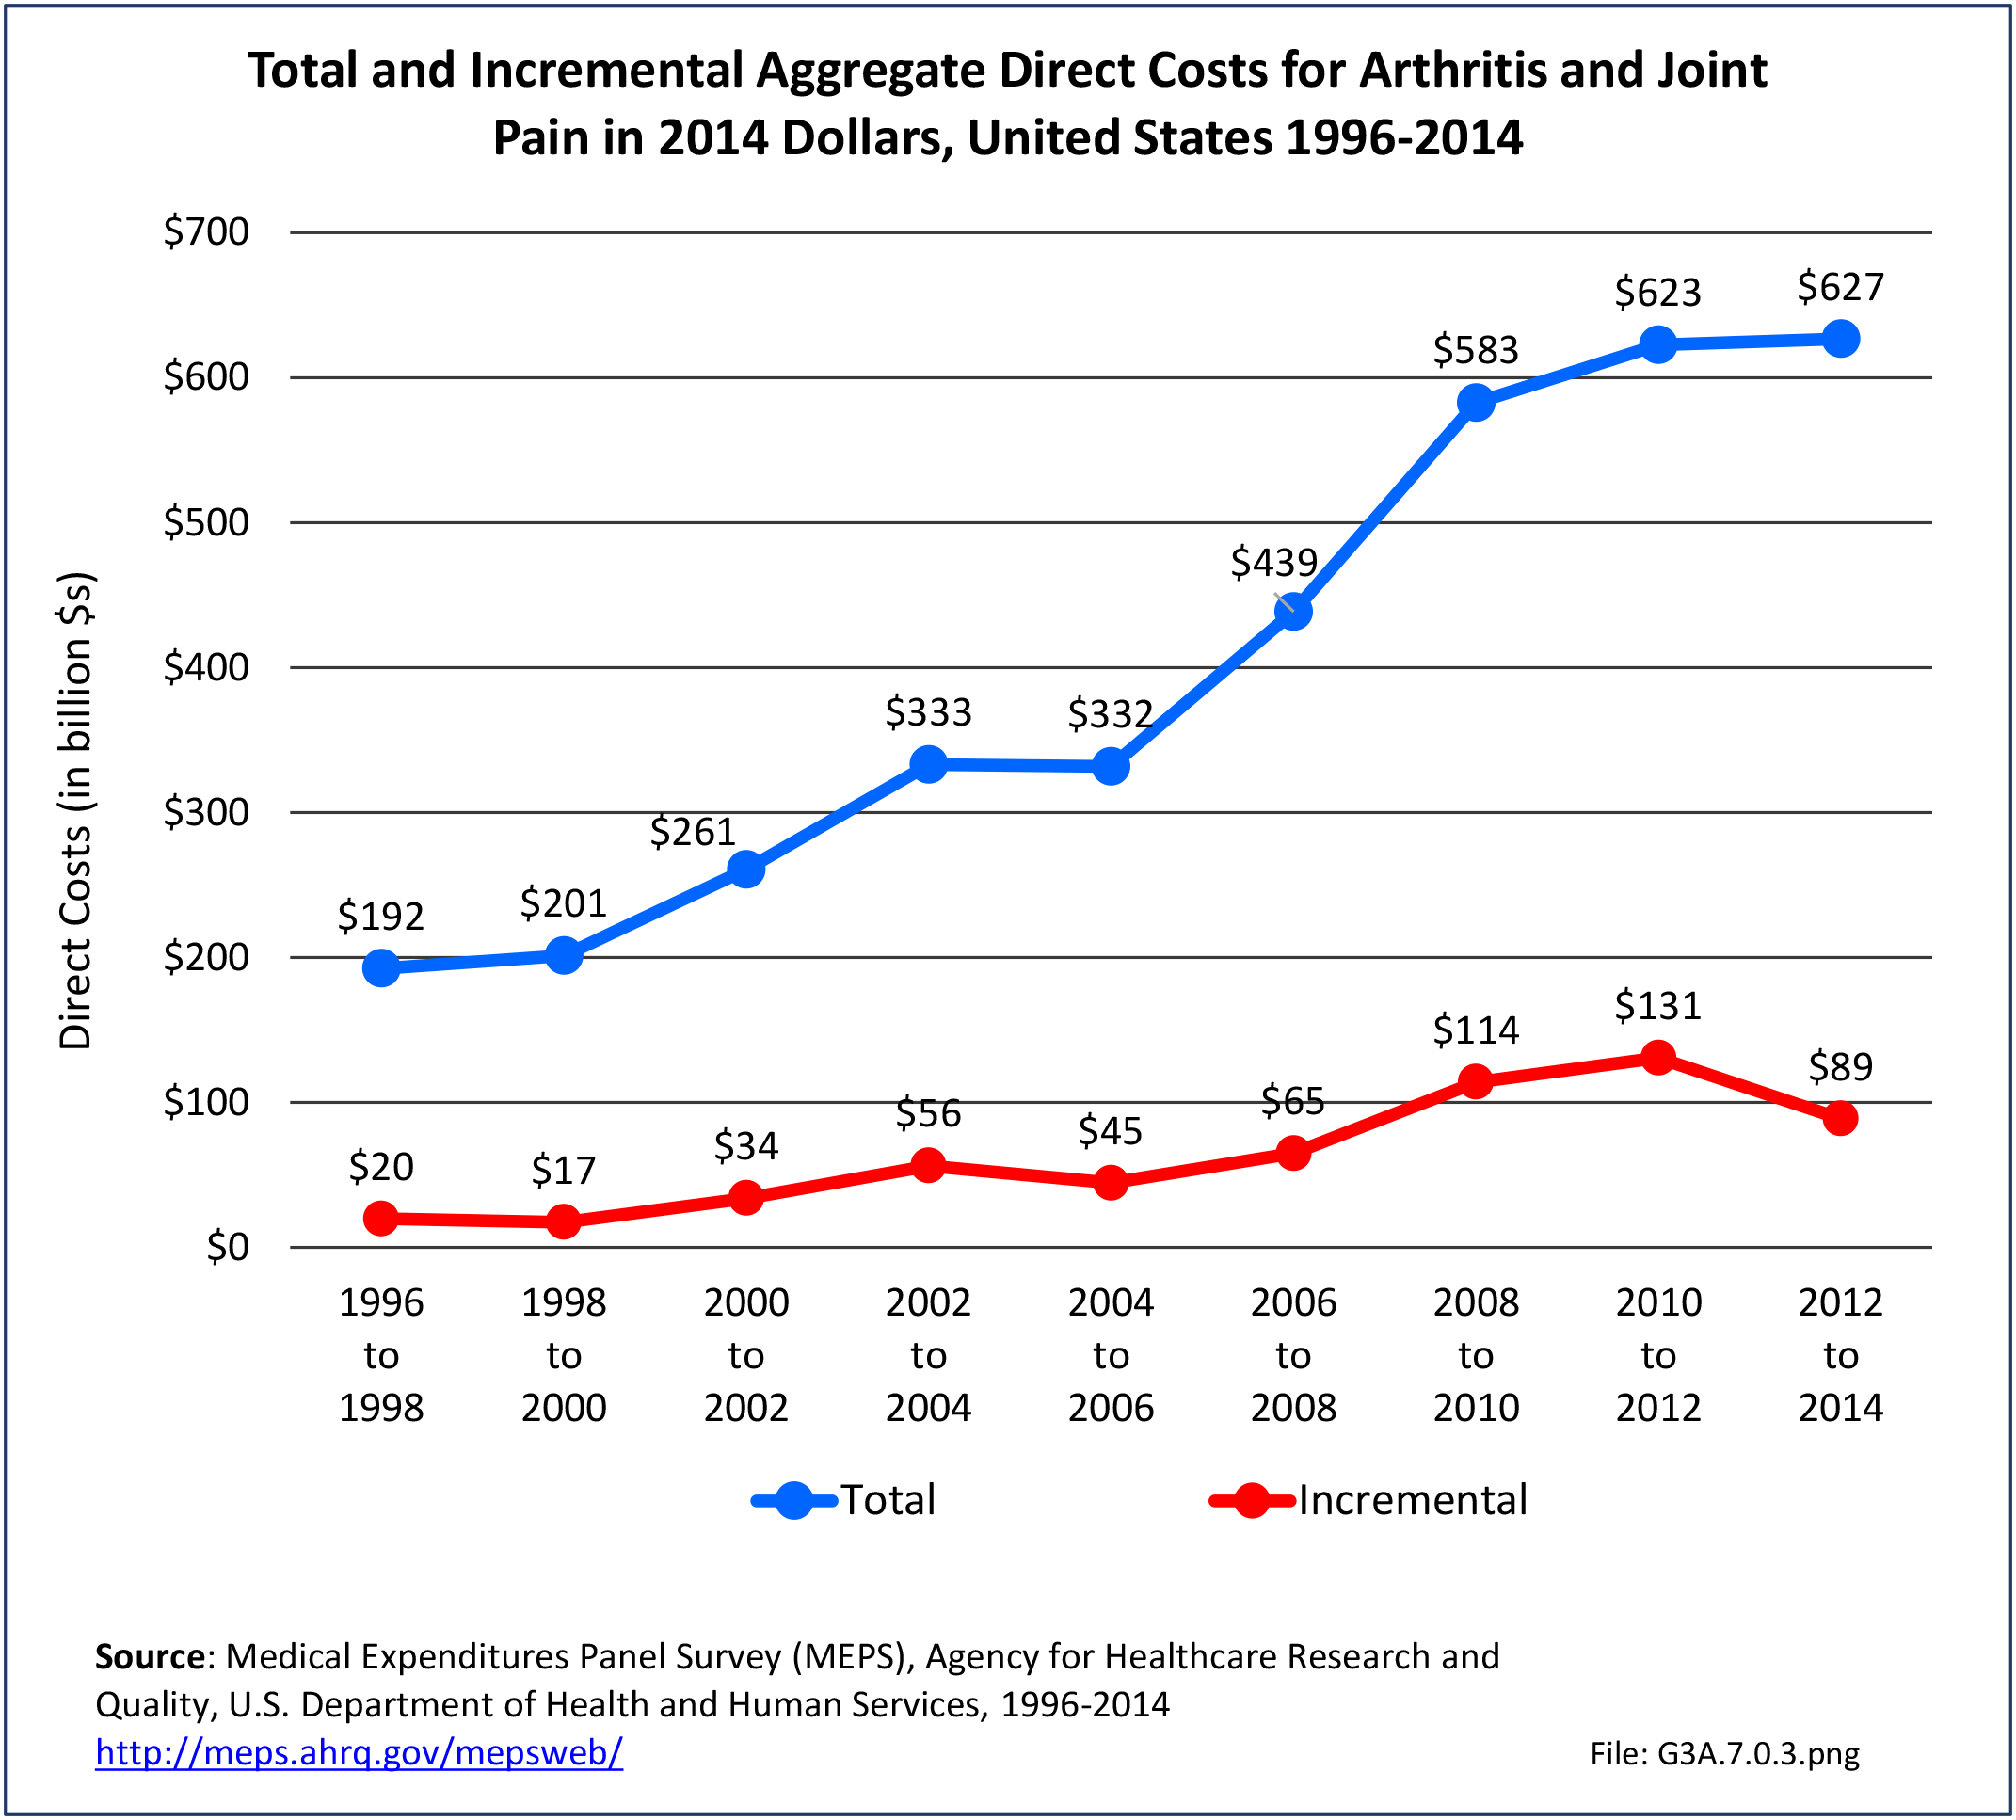
Combining direct and indirect costs for OA and allied disorders, average annual all-cause costs for the years 2008-2014 were $486.4 billion. Total incremental costs (direct and indirect costs directly associated with osteoarthritis) were $136.8 billion. (Reference Table 8.13 PDF CSV)
Direct Medical Costs
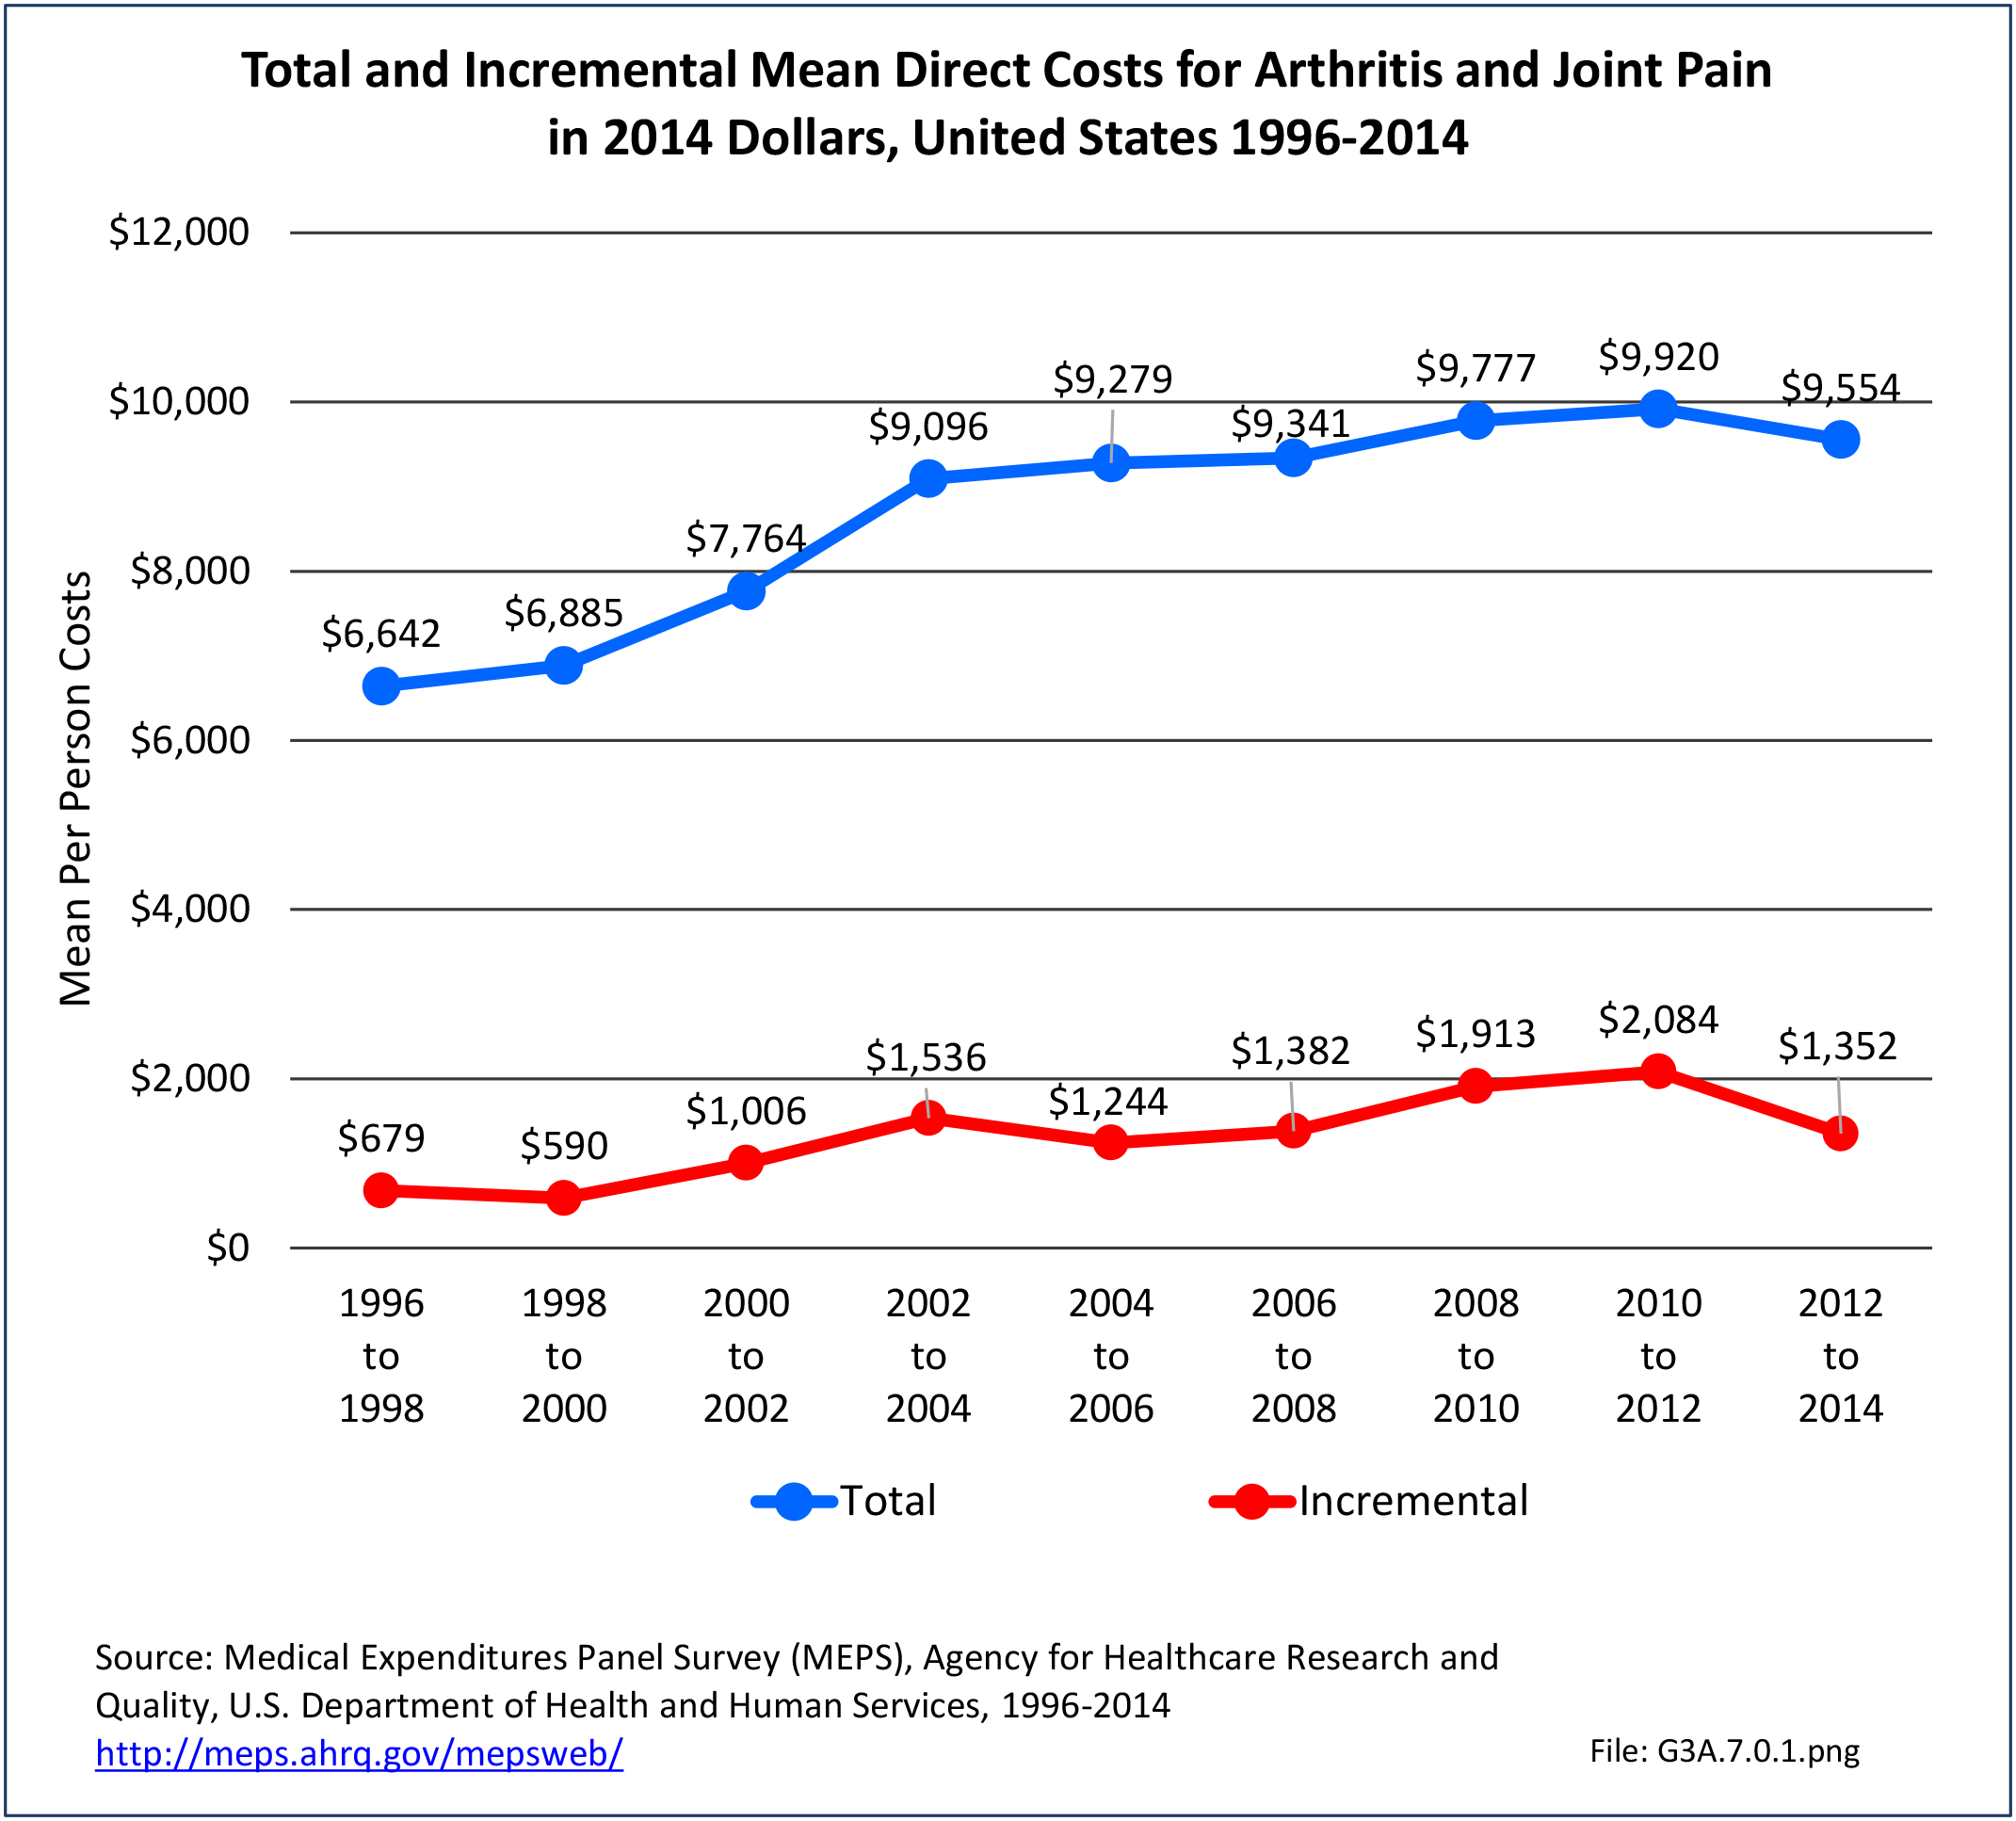
Among all adults with osteoarthritis, annual all-cause per person direct costs were $11,502. Those reporting limitations had the highest all-cause per person direct costs: any limitation in work, housework, or school activities ($17,136) or any limitation in IADLs, ADLs, functioning, work, housework, school, vision or hearing ($14,146).


Annual total all-cause direct costs were $373.2 billion. The five socio-demographic groups with the highest total all-cause direct costs were: non-Hispanic whites ($300.7 billion); those with any limitation in IADLs, ADLs, functioning, work, housework, school, vision or hearing ($298.5 billion); any limitation in work, housework, or school activities ($213.0 billion); any private insurance ($216.5 billion); or who were married/had a partner ($200.4 billion).
Osteoarthritis incremental direct medical costs totaled $65.5 billion annually; average per person OA incremental costs were $2,018. (Reference Table 8.13 PDF CSV, and Table 8.22 PDF CSV)
Indirect Costs
Some 16.7 million adults of working age (18-64 years) with a work history had OA. The ratio of persons in the labor force without osteoarthritis (90%) is higher than for those with OA (69%), resulting in earnings losses due to OA.
On average, for the years 2008-2014, those without OA earned $6,783 more than those with OA, which represented a total of $113.2 billion in all-cause earnings losses for all U.S. adults with OA. Earnings losses attributable to OA were $71.3 billion; per person osteoarthritis-attributable earnings losses were $4,274. (Reference Table 8.13 PDF CSV)
Lifetime OA Treatment Costs
Lifetime cost attributed to knee OA in 2013 were $140,300. More than one-half (54%) of knee OA patients underwent total knee arthroplasty (TKA) an average of 13 years after diagnosis. The largest proportion of knee OA-related direct medical costs for those meeting TKA eligibility criteria was attributable to primary TKA.2
- 1. Cisternas MG, Murphy L, Sacks JJ, Solomon DH, et al. Alternative methods for defining osteoarthritis and the impact on estimating prevalence in a US population-based survey. Arthritis Care Res 2016;68(5):574-580.
- 2. Losina E, Paltiel AD, Weinstein AM, et al. Lifetime medical costs of knee osteoarthritis management in the United States: impact of extending indications for total knee arthroplasty. Arthritis Care Res (Hoboken) 2015;67(2):203-215.
Edition:
- Fourth Edition