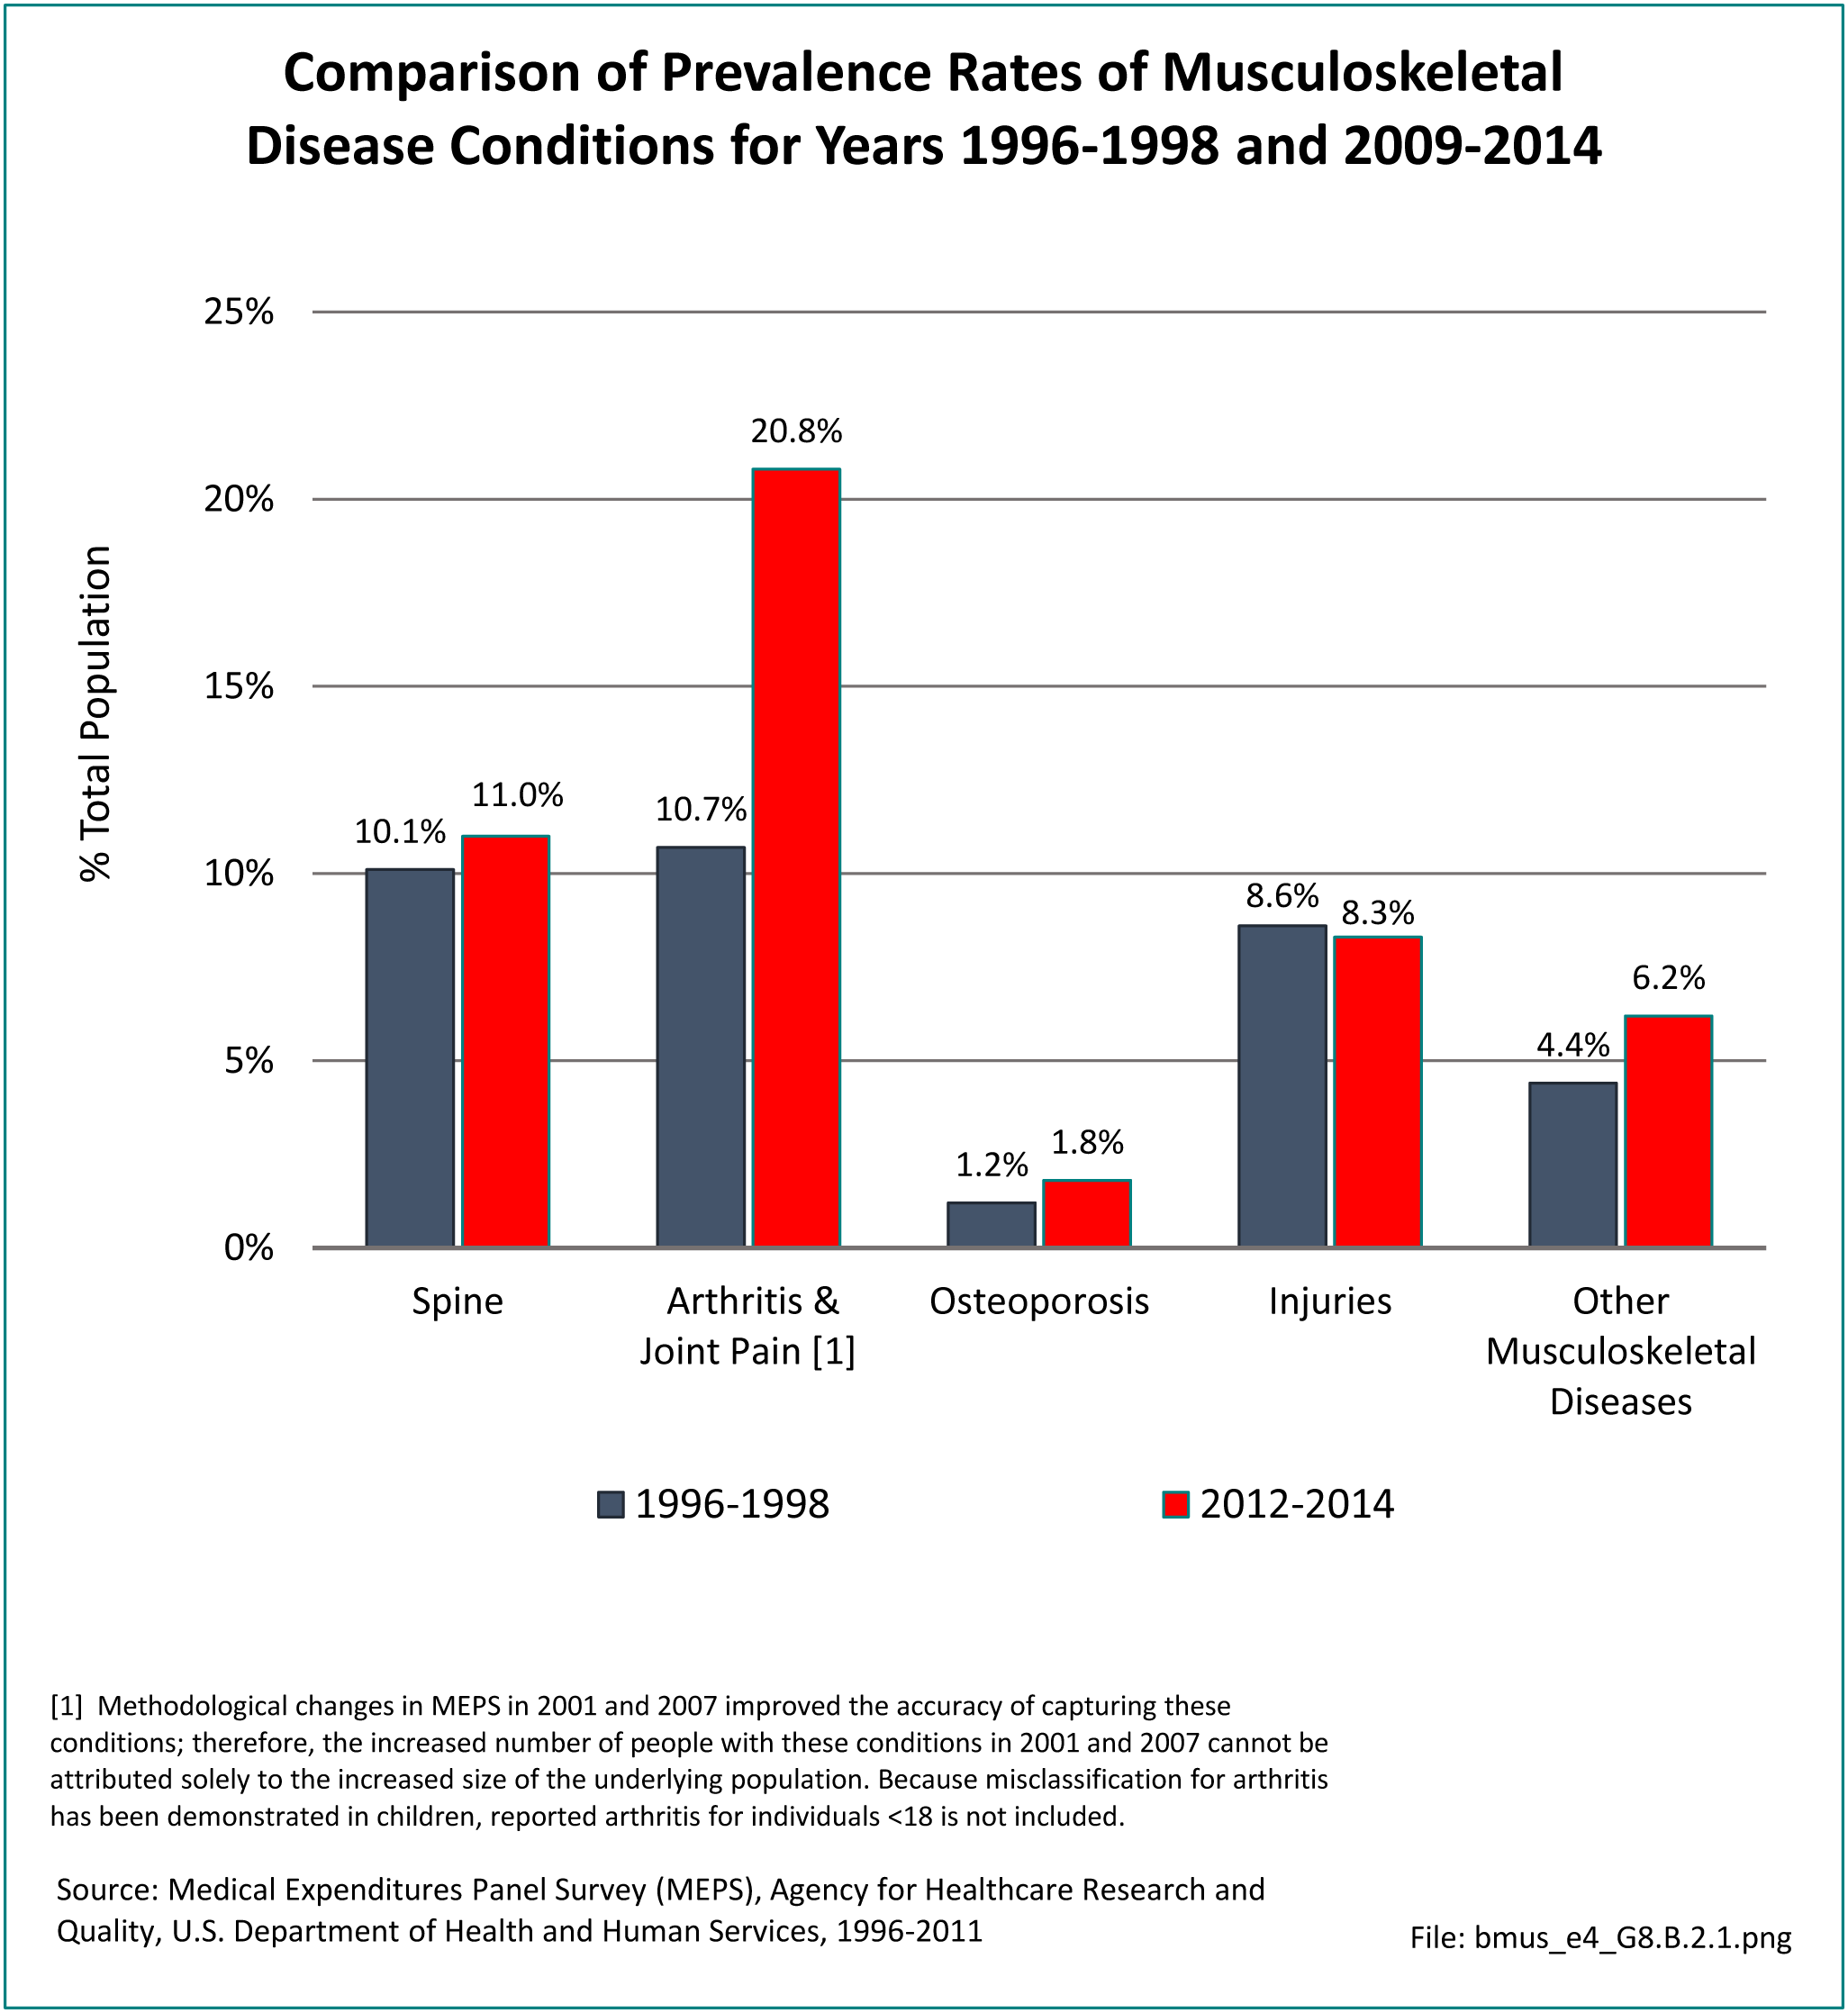
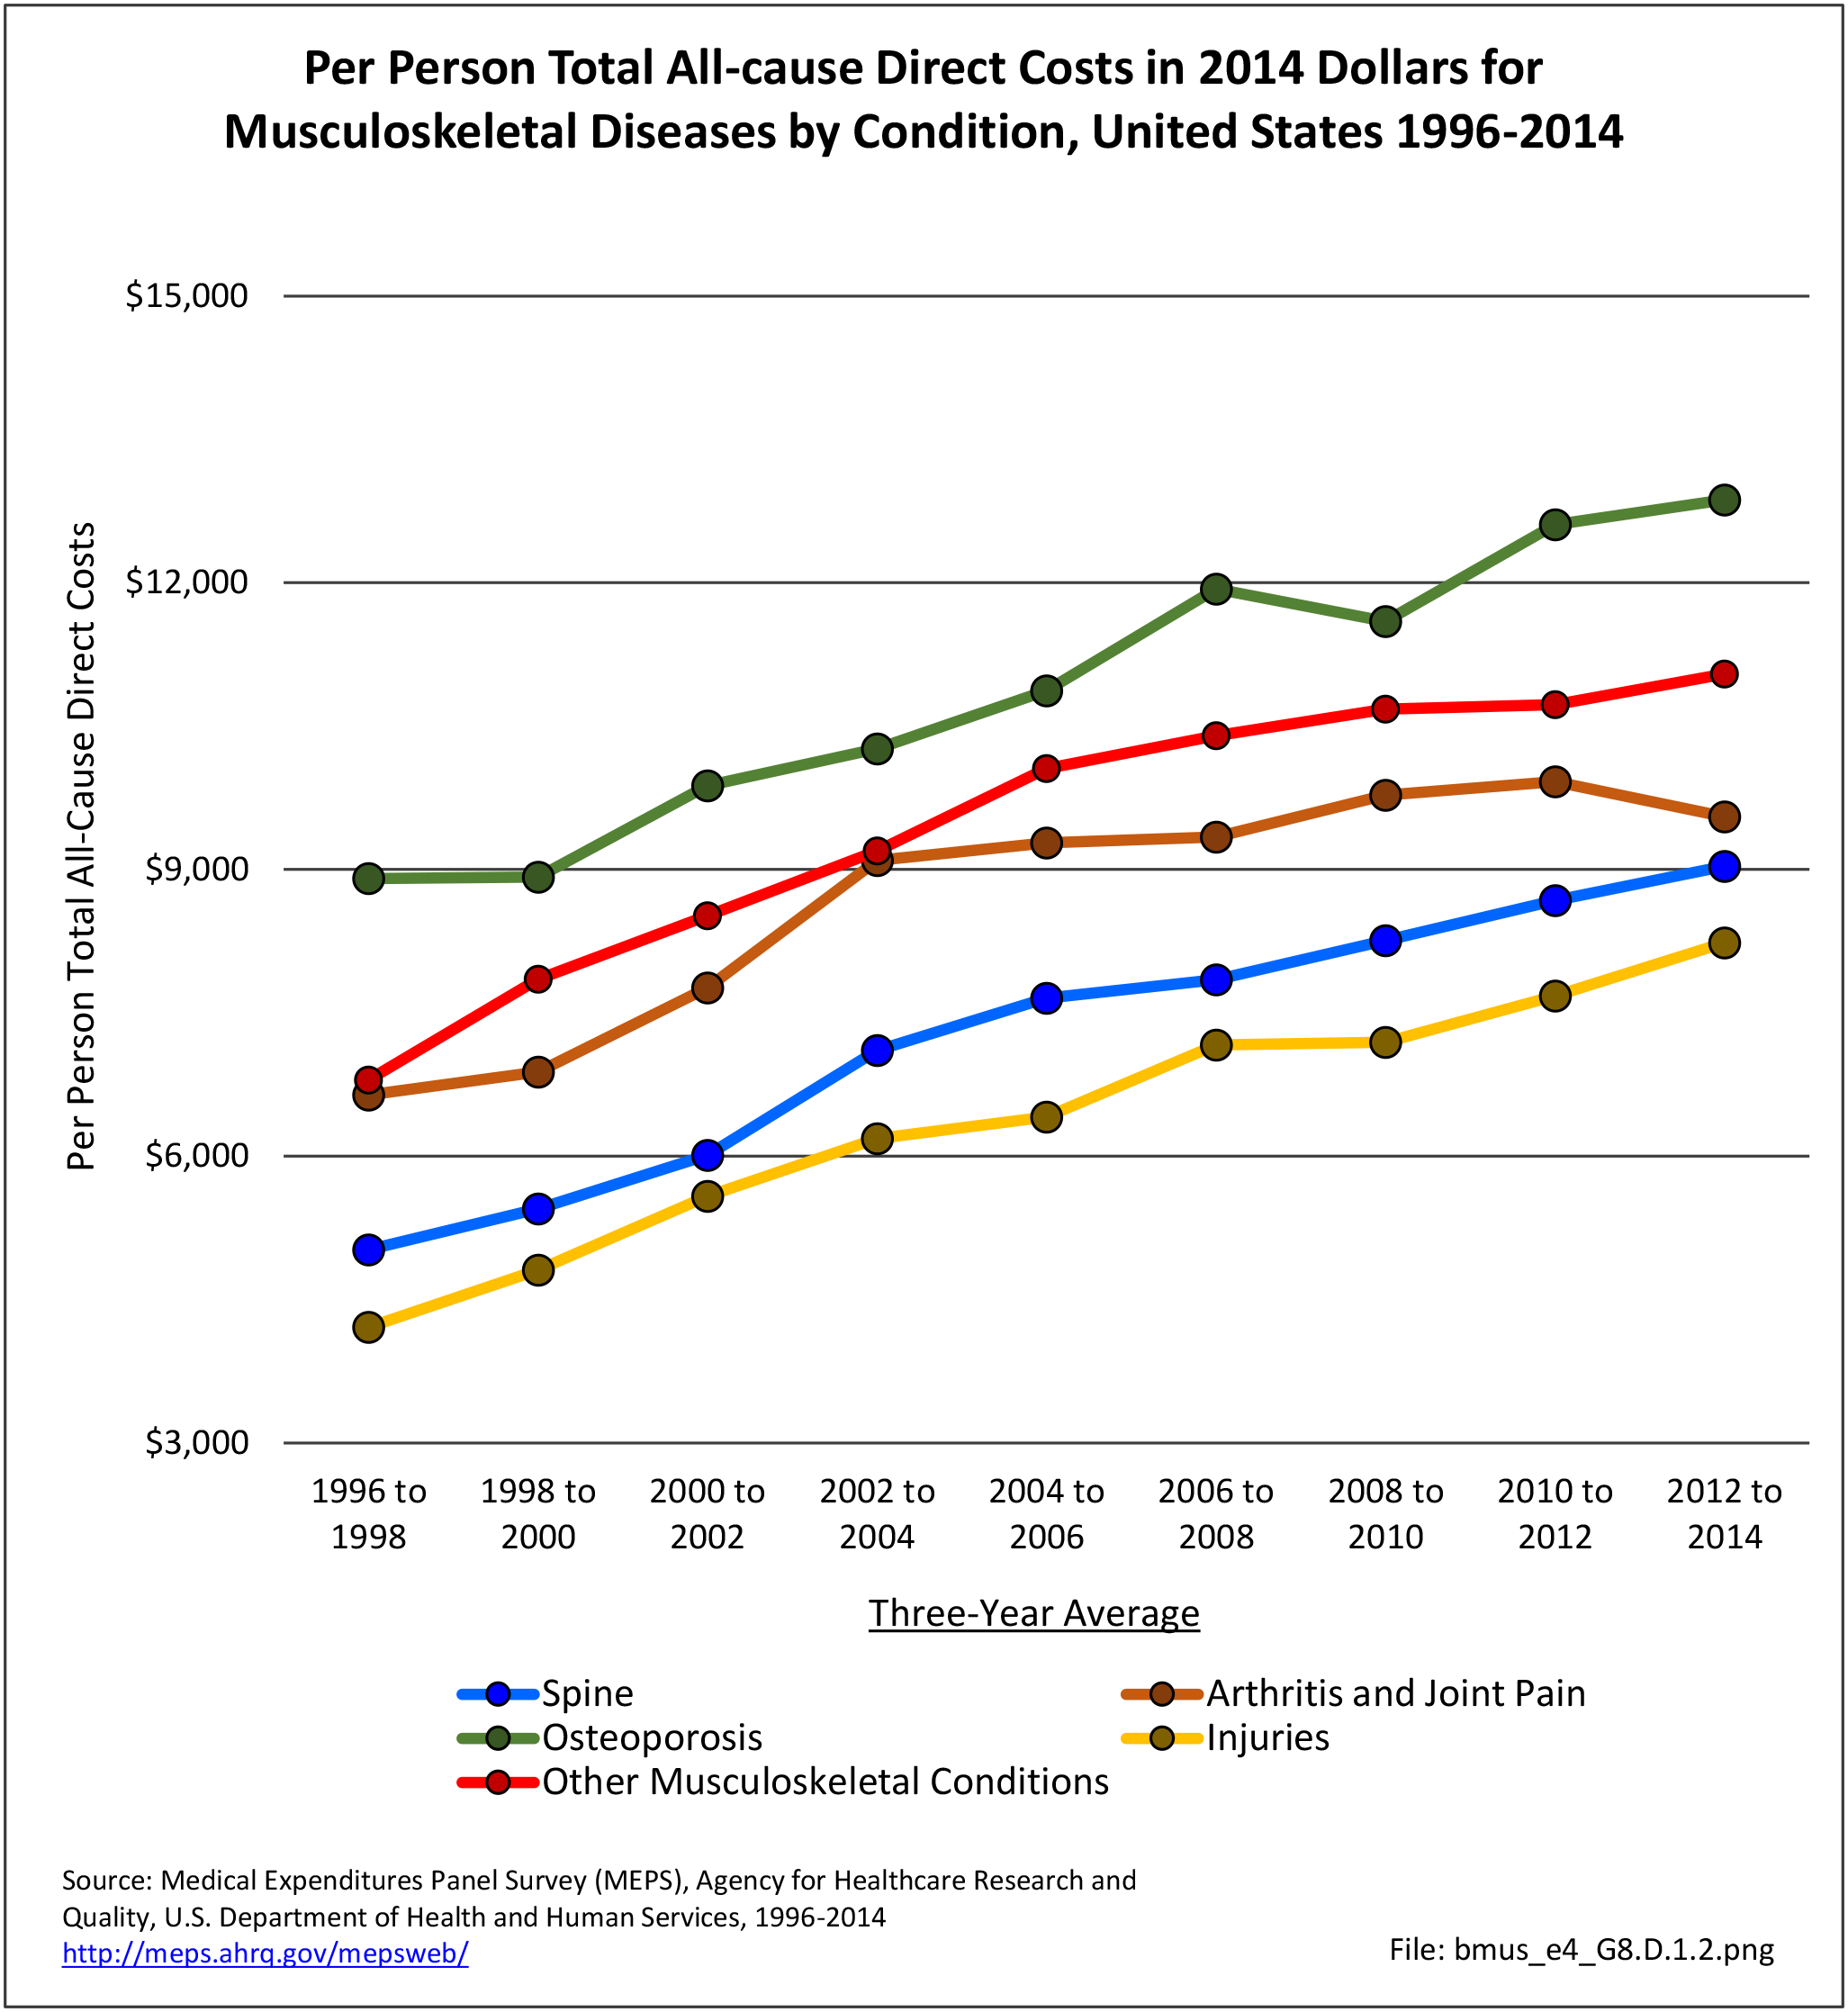
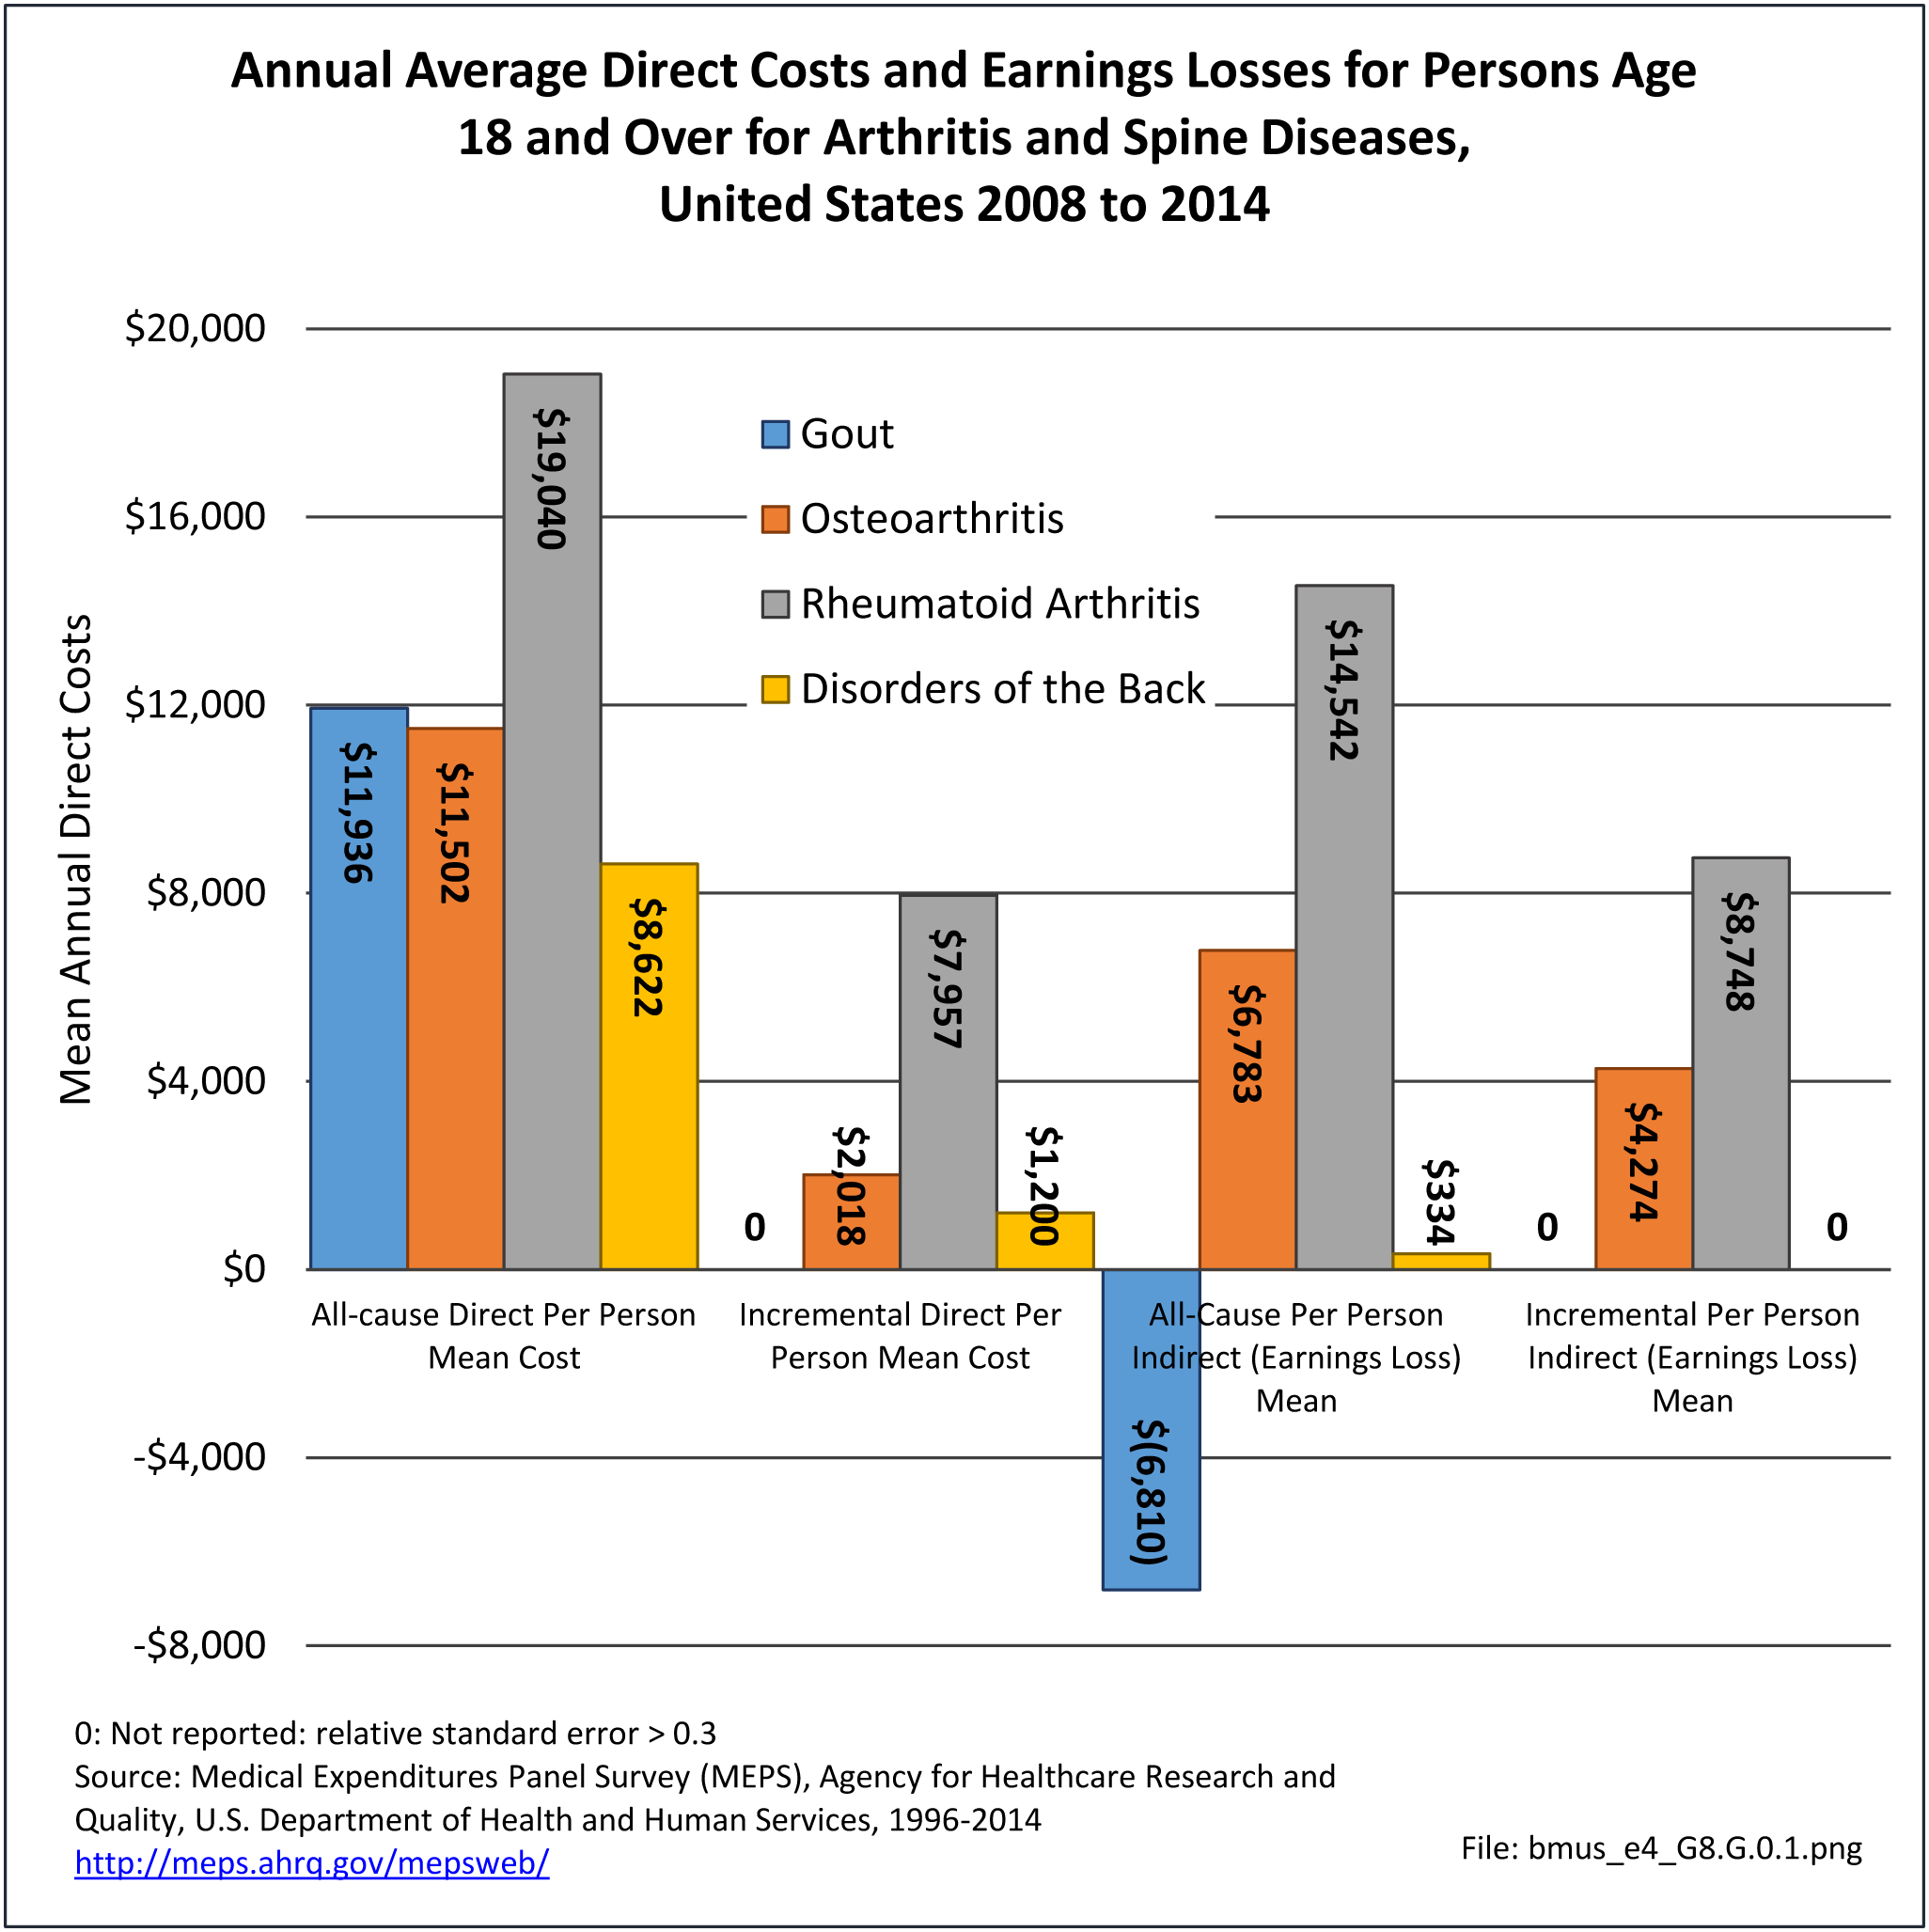
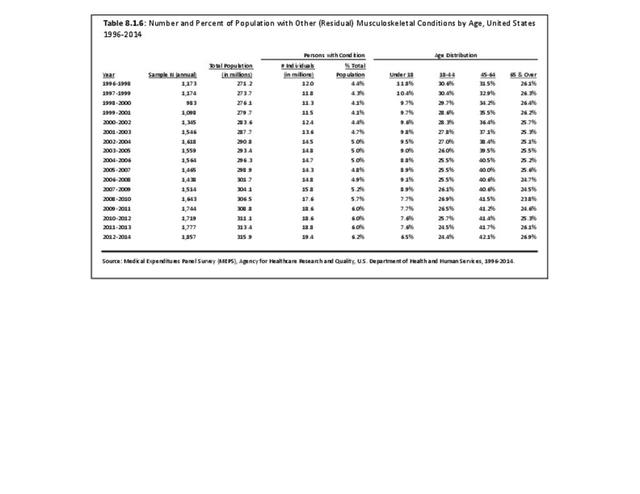
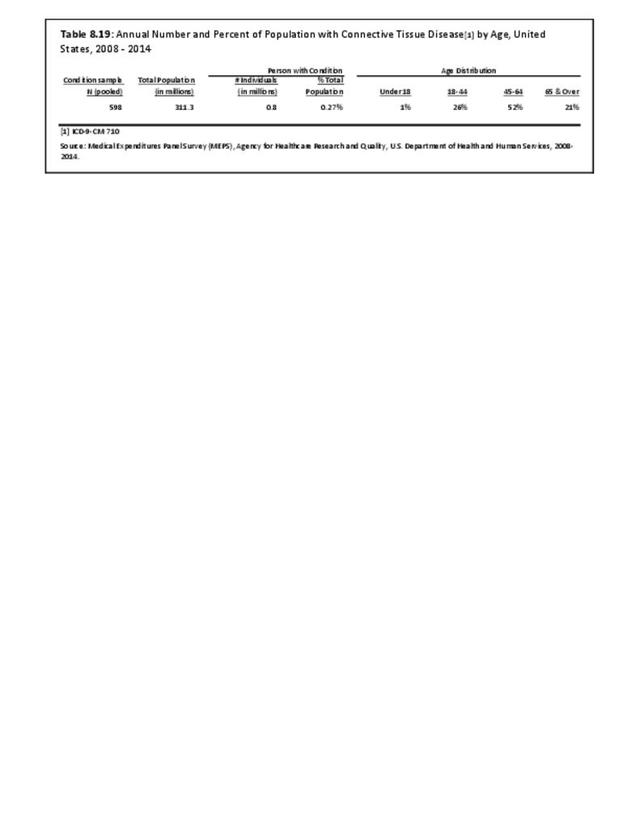
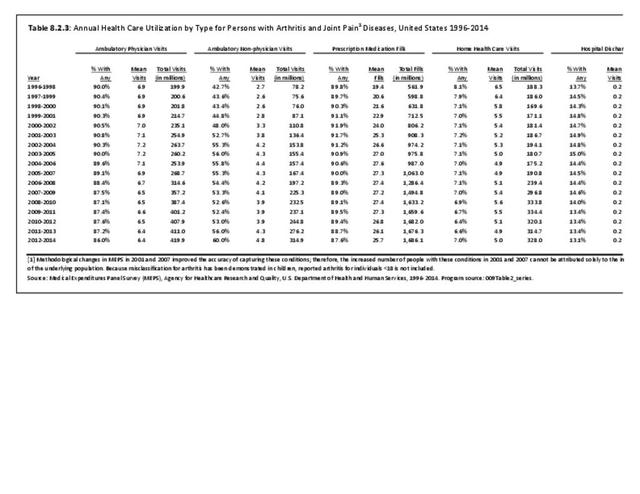
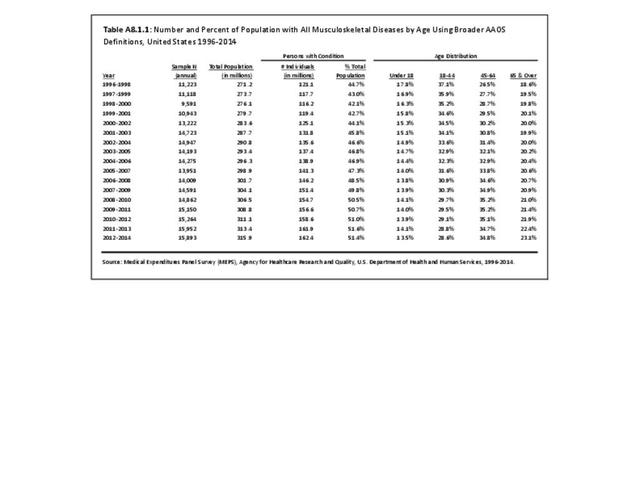
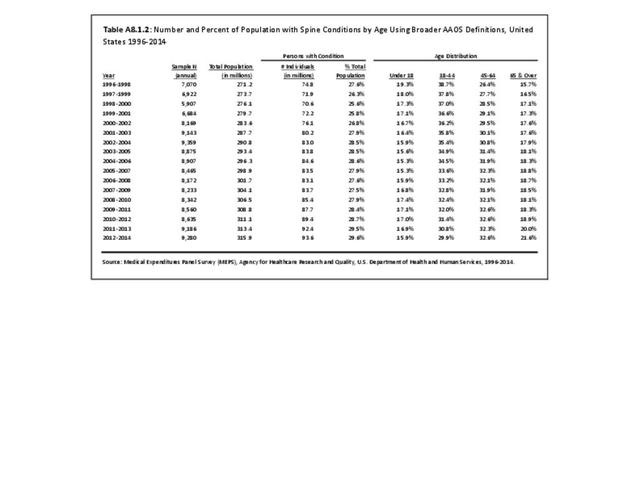
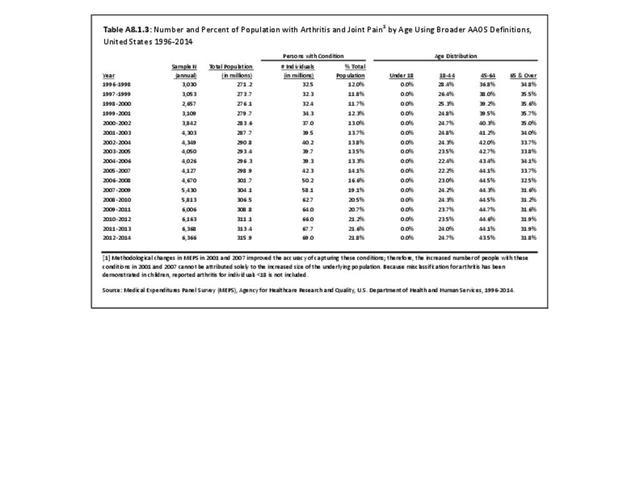
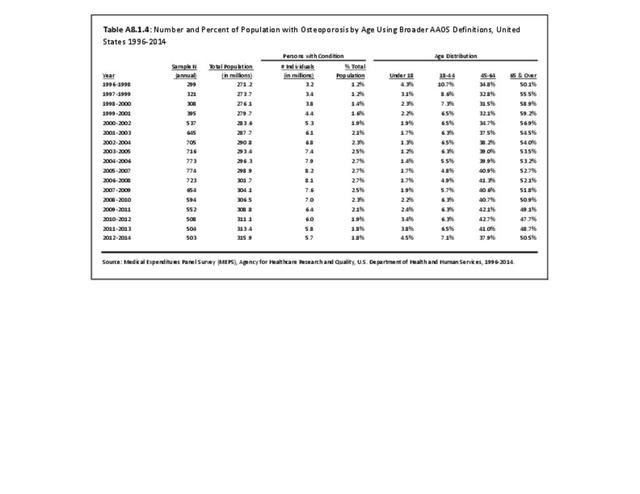
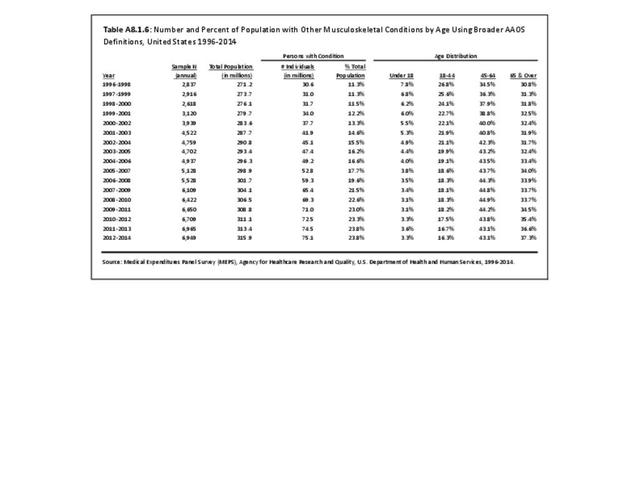
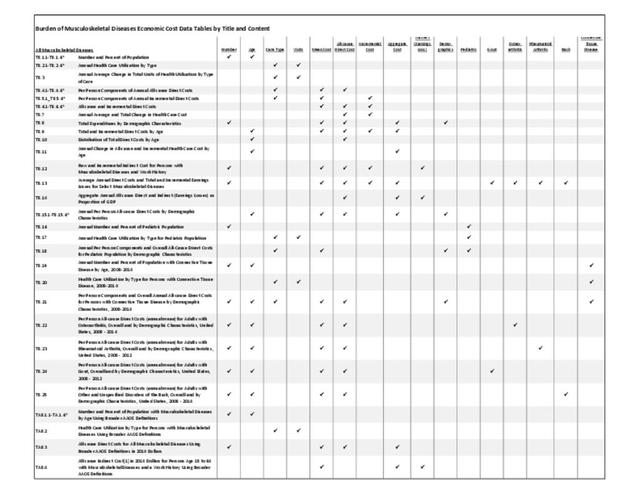
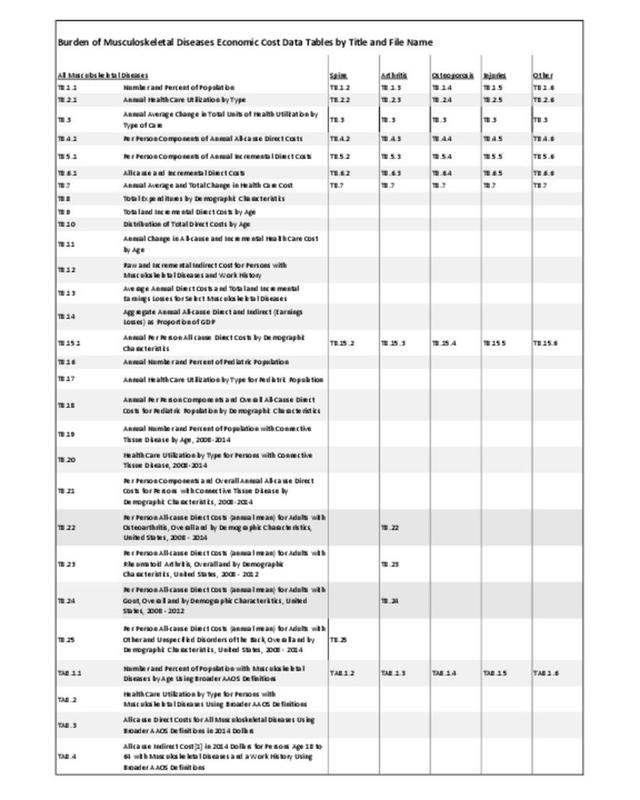
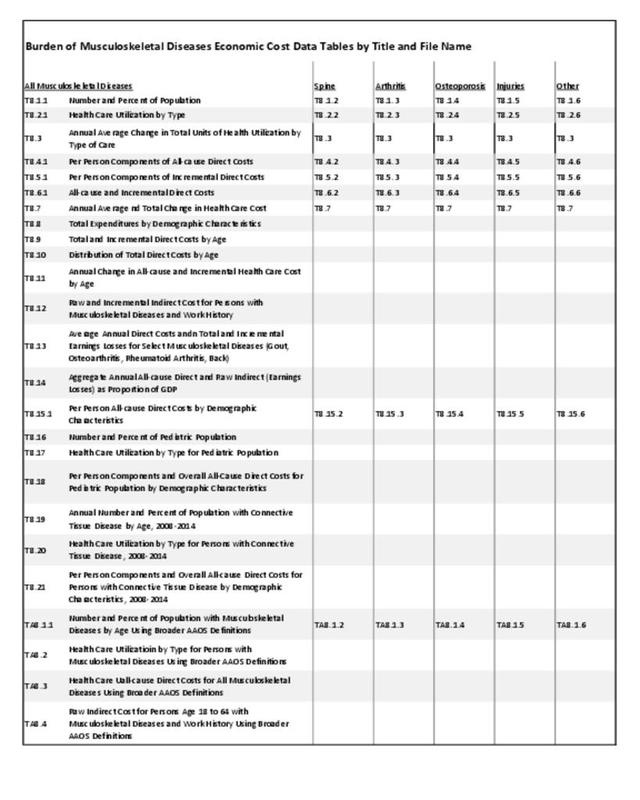
The economic analyses presented in this chapter are based on a definition of musculoskeletal disease that includes all condition groups discussed in other sections of this website, including low back and neck pain (spine), arthritis and joint pain, osteoporosis, musculoskeletal injuries, and a category of "other" for all remaining conditions. Key estimates were also conducted using more expansive definitions of musculoskeletal diseases and condition groups hereinafter referred to as the broader AAOS definitions. These definitions include all conditions mentioned previously in addition to musculoskeletal conditions that are a consequence of another disease (eg,. bone metastases from cancer). The list of ICD-9-CM codes used in the primary and broader AAOS definitions of musculoskeletal disease can be found in the codes section. In addition, specific conditions and subgroups (ie, connective tissue disease, gout, osteoarthritis and allied disorders, rheumatoid arthritis, other and unspecified conditions of the back, and musculoskeletal disease among children and adolescents) are also examined.
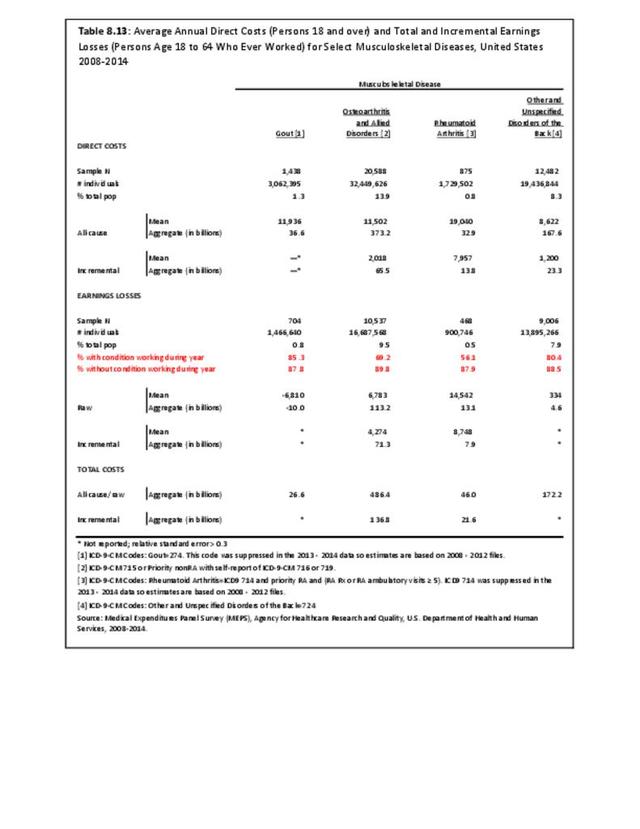
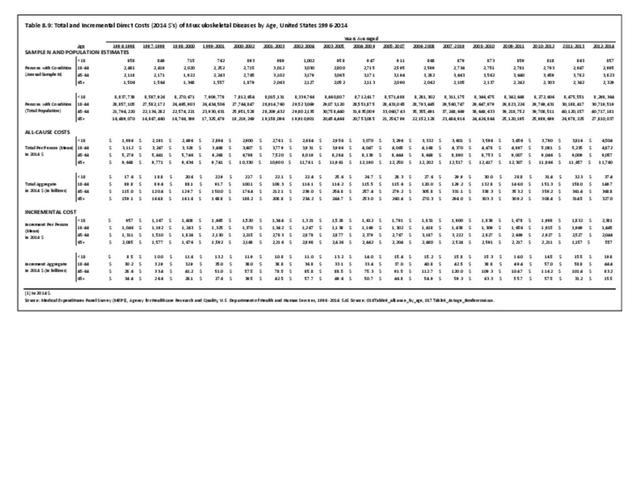
The economic impact measures presented in this chapter include two components: direct medical costs and indirect costs. These costs may be total or incremental, and can be presented as per-person or aggregate costs.
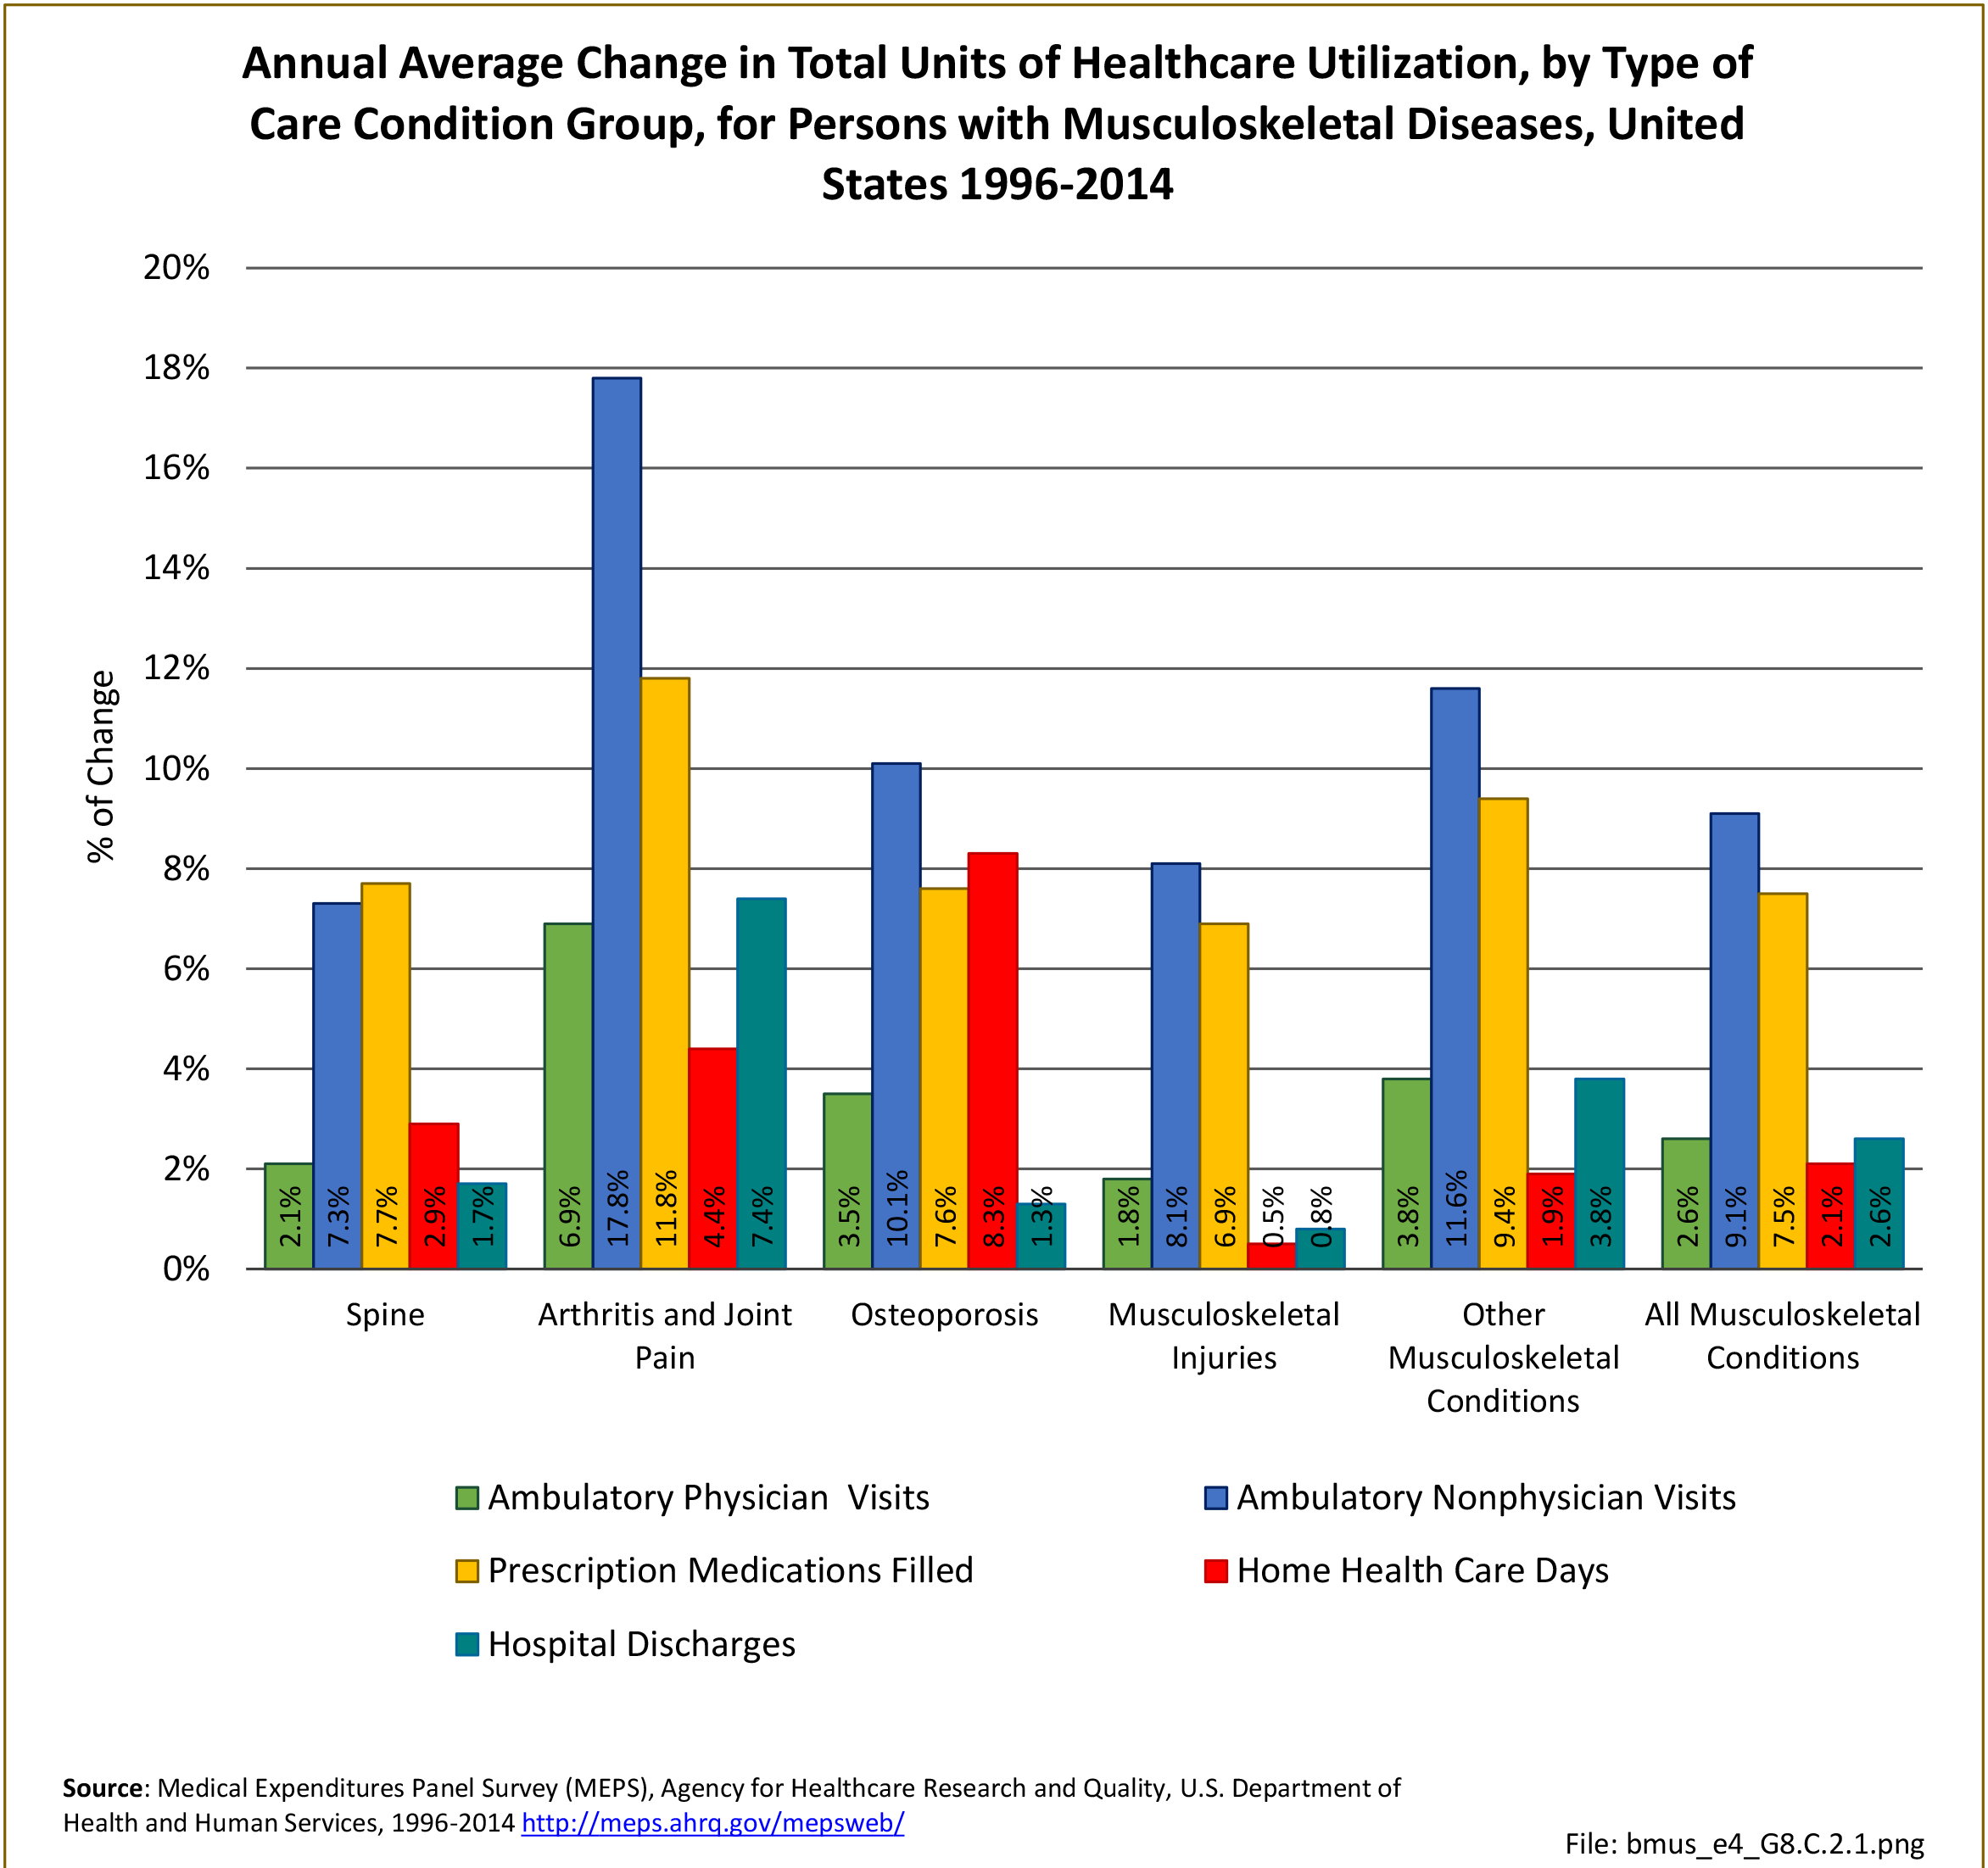
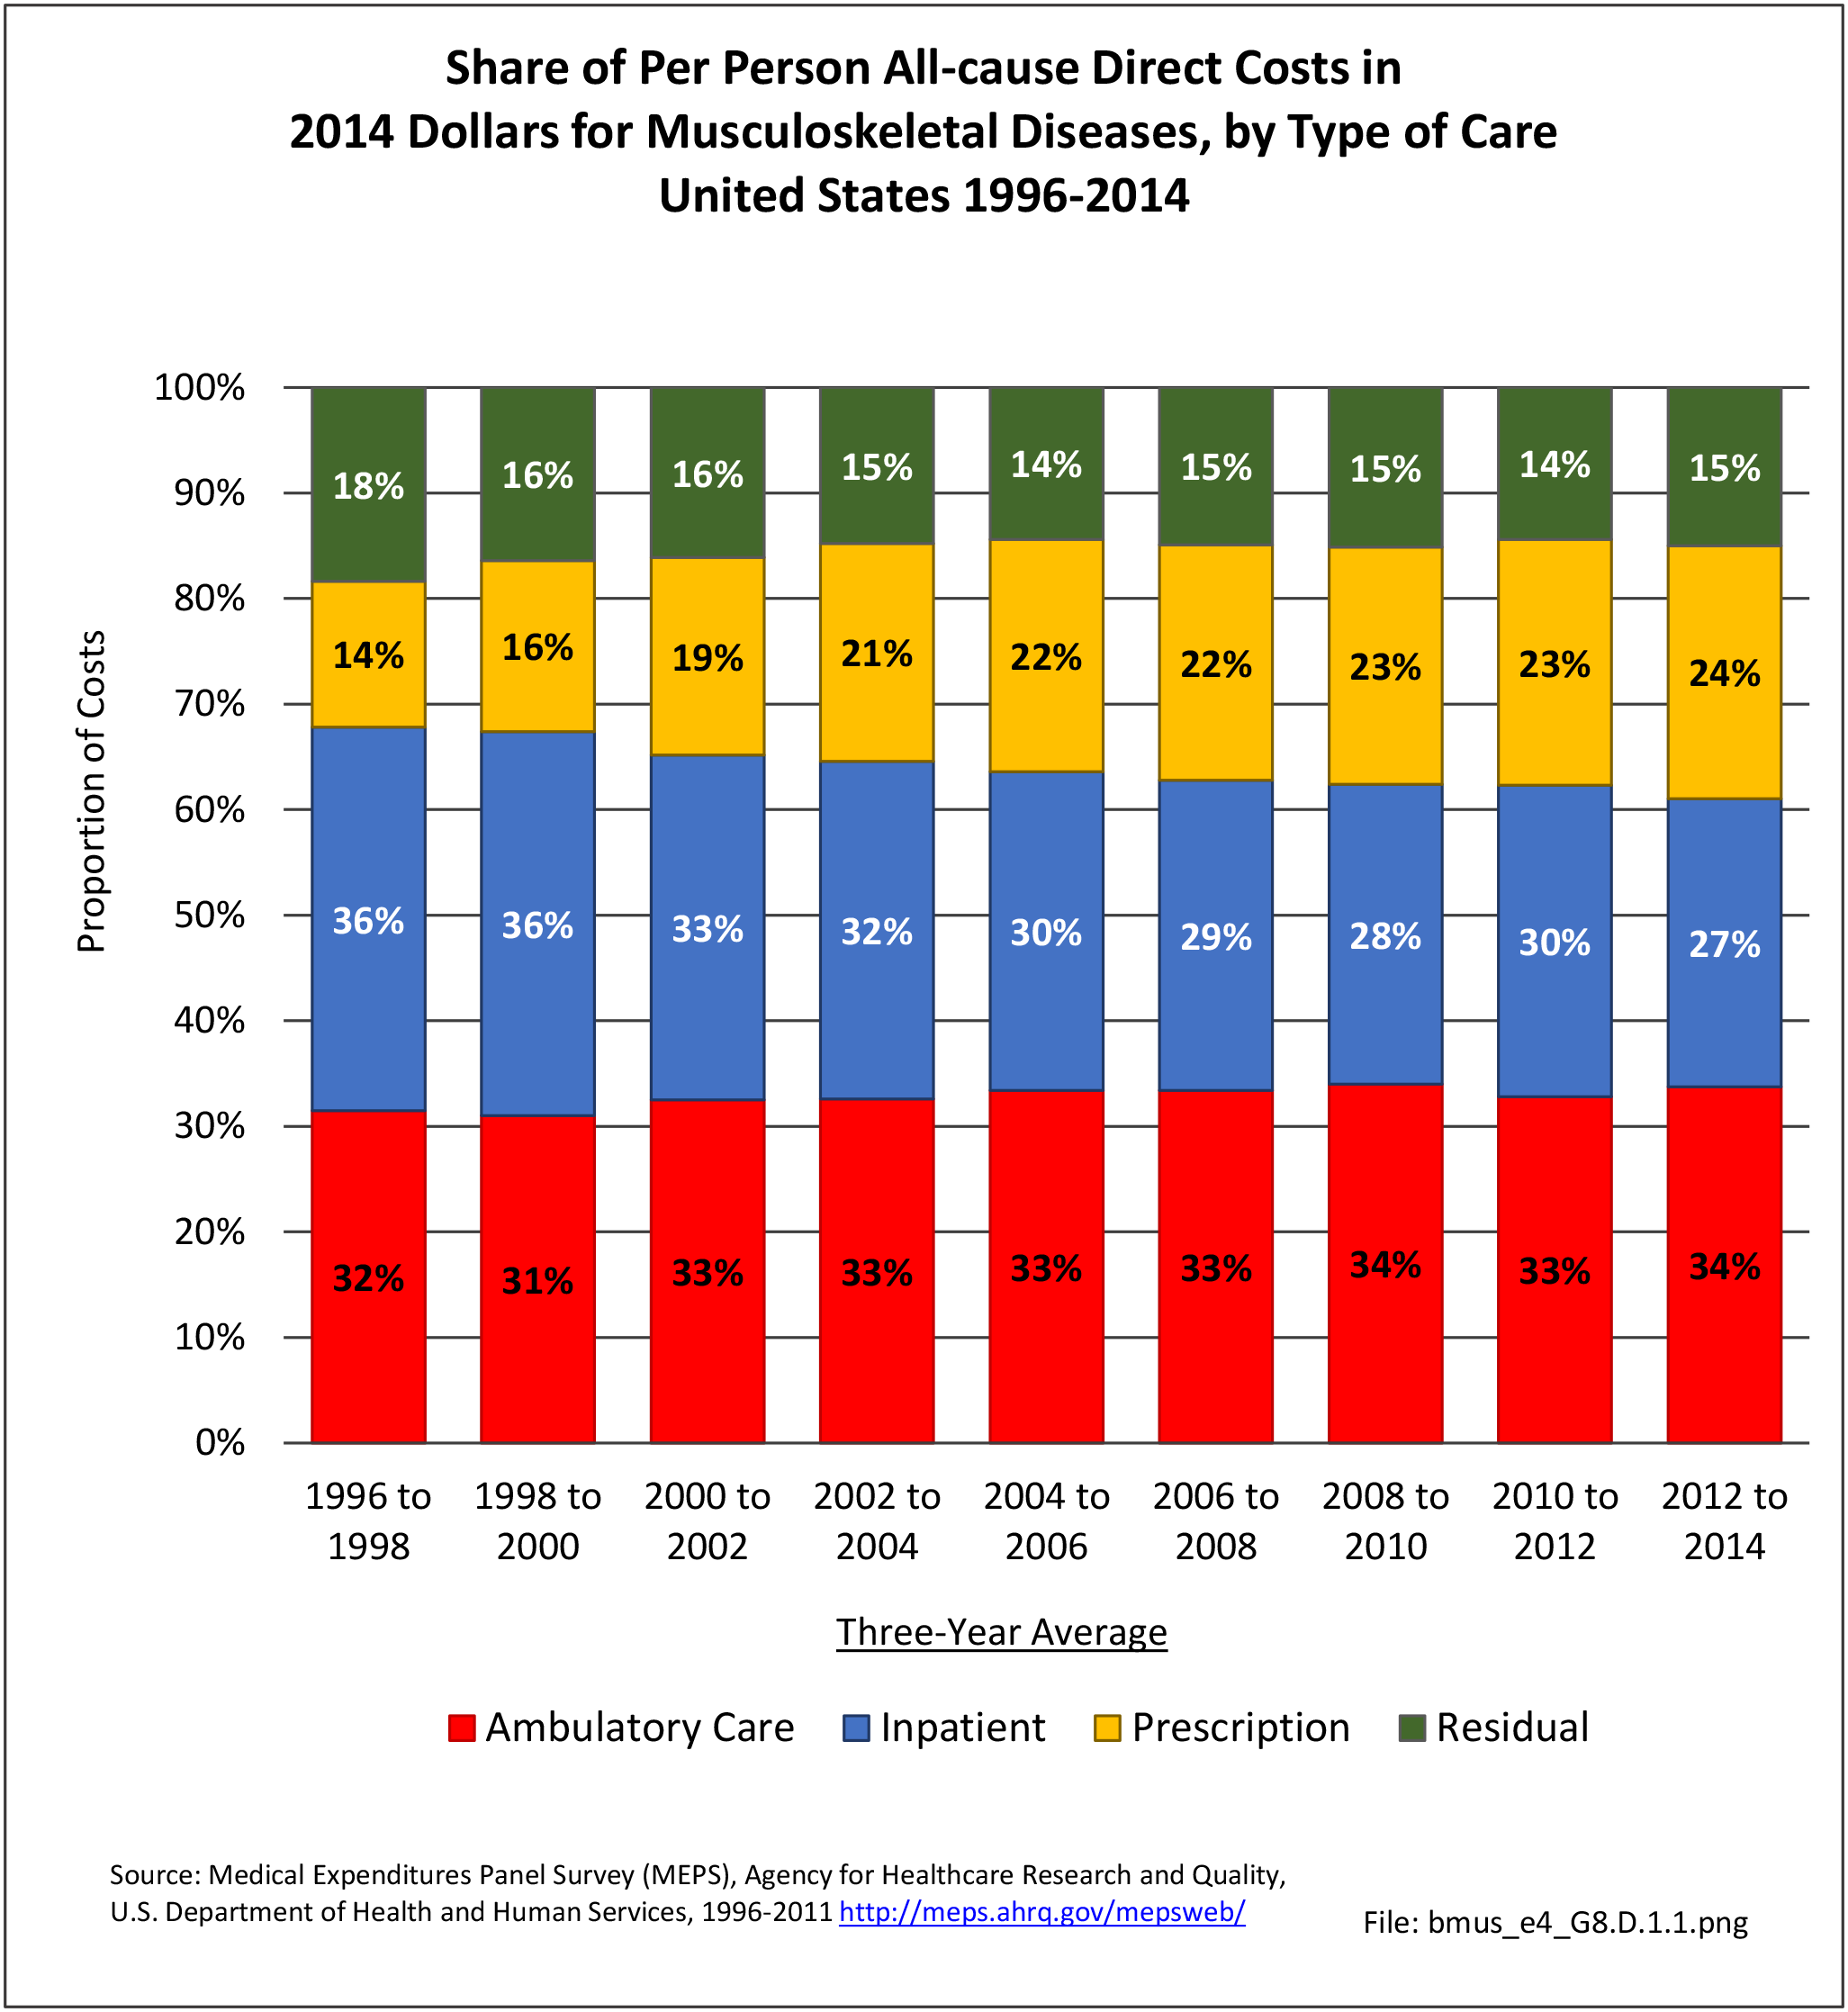
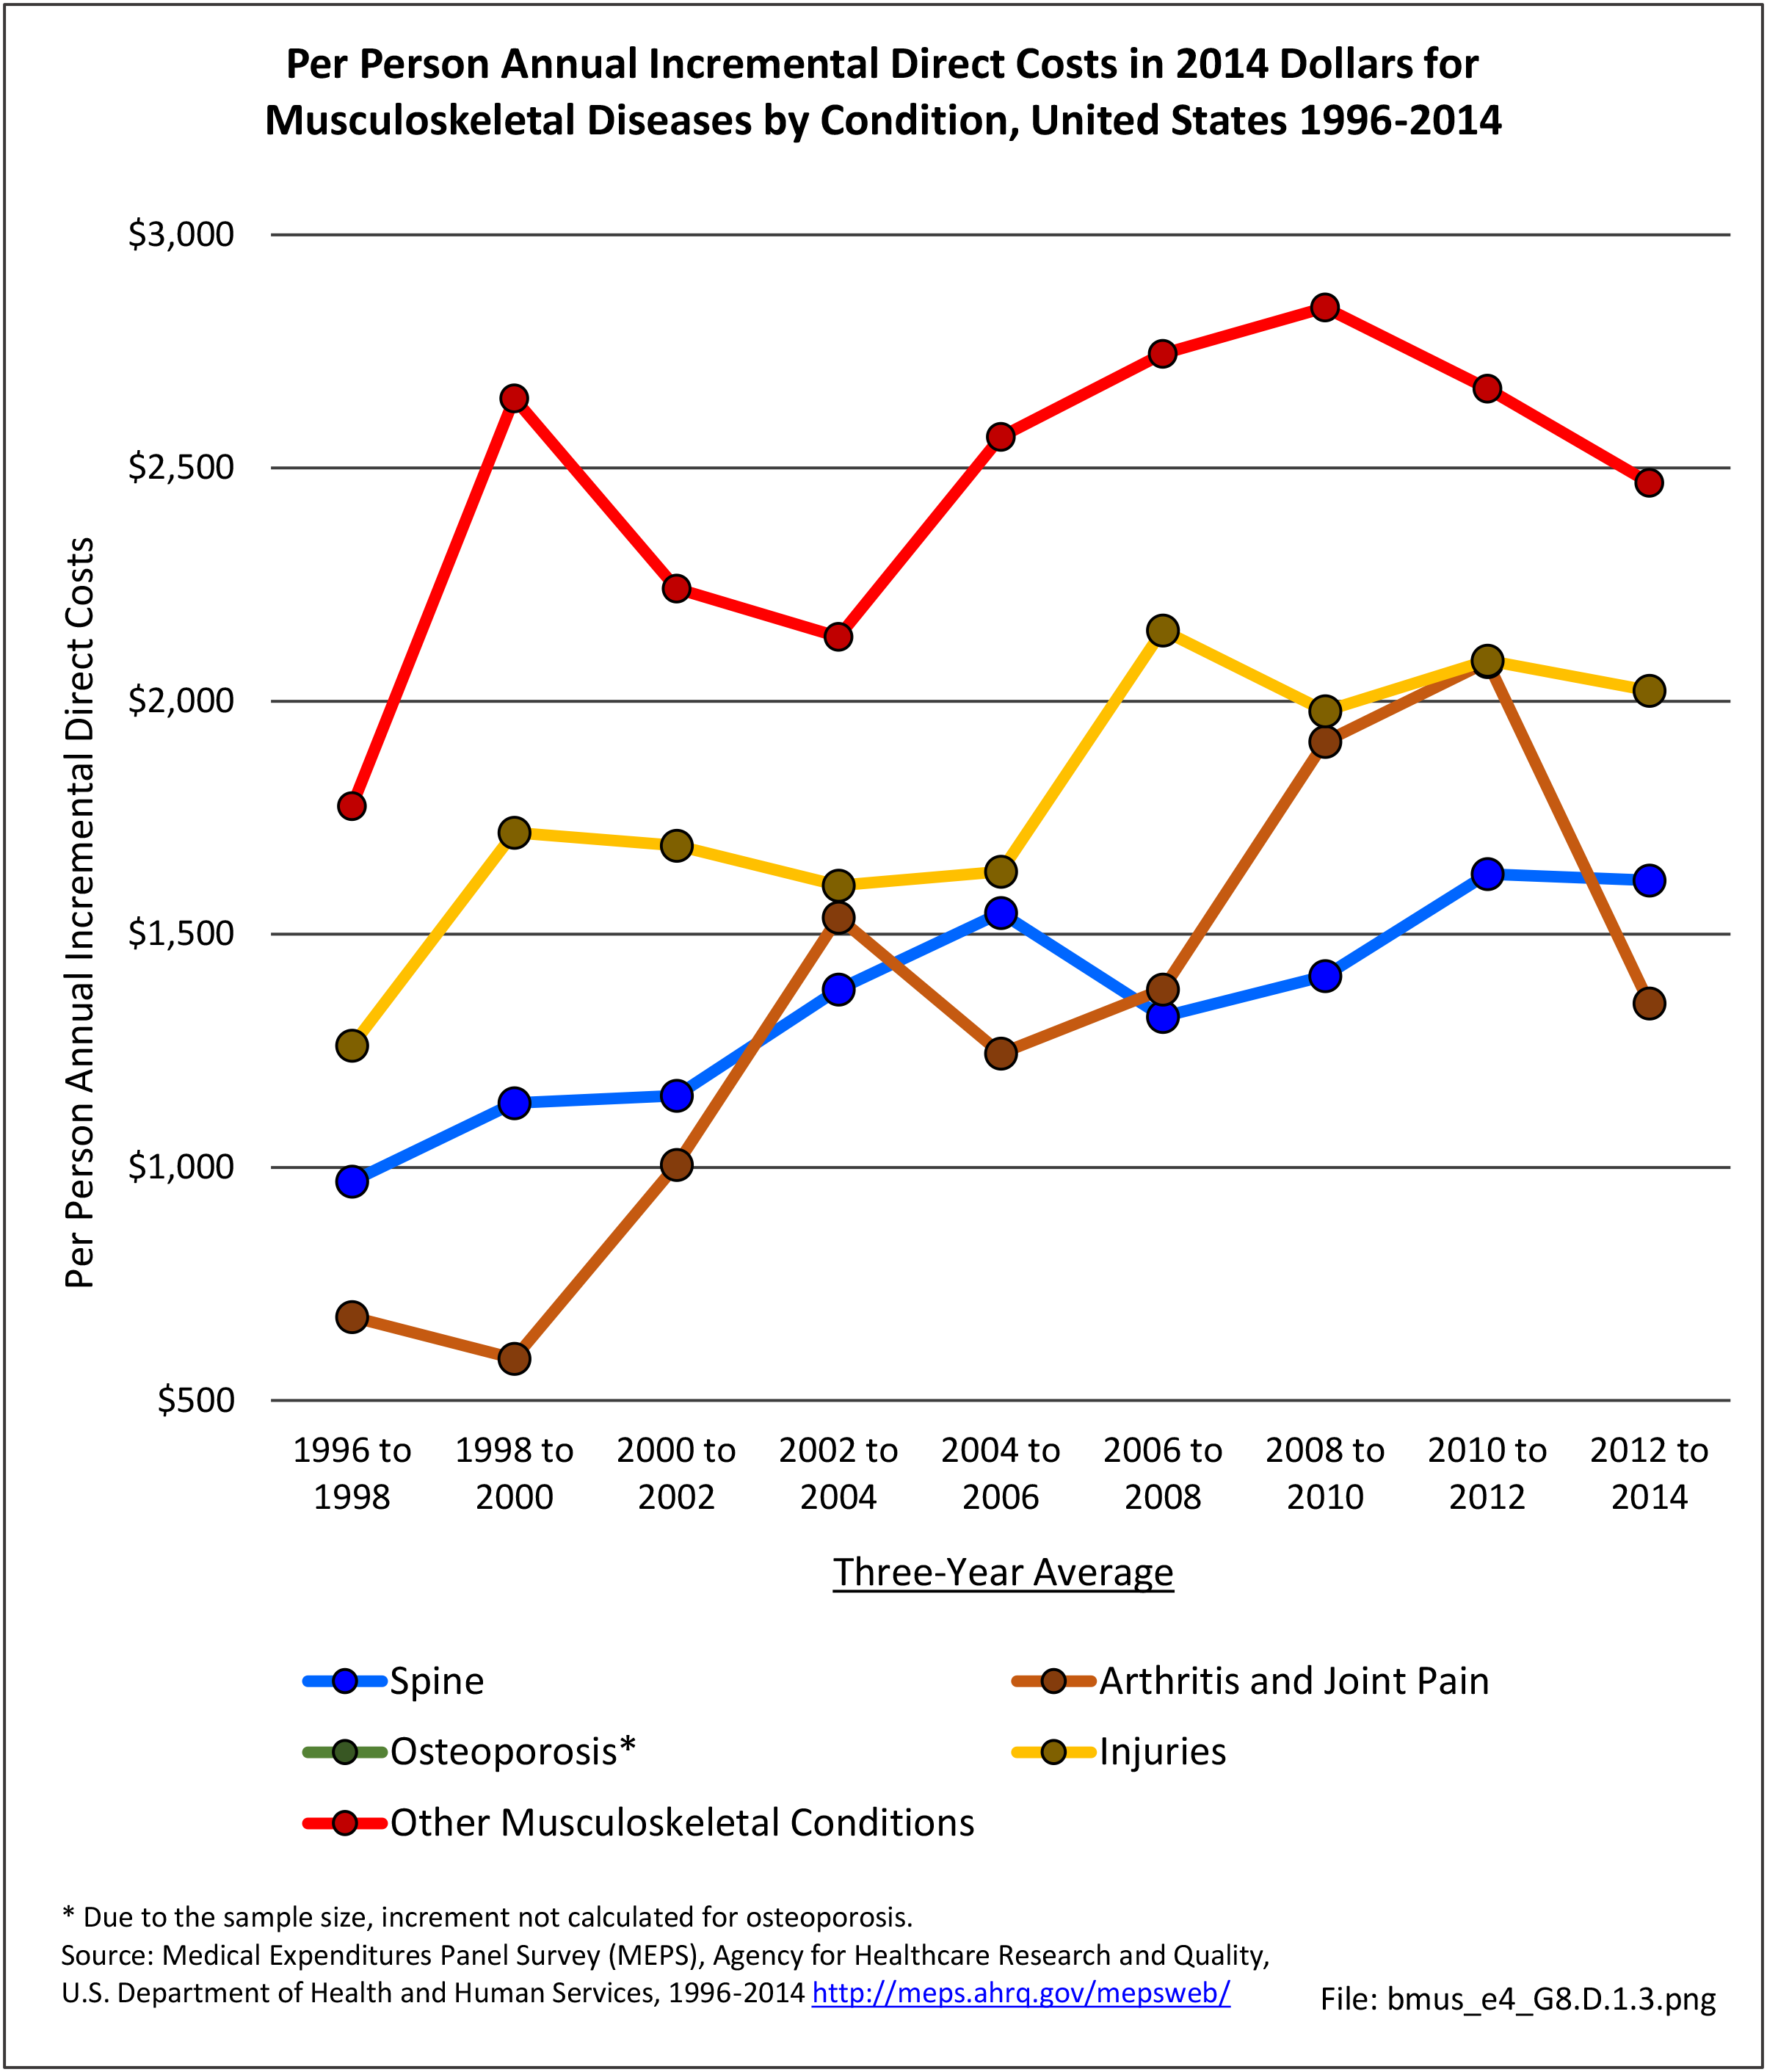
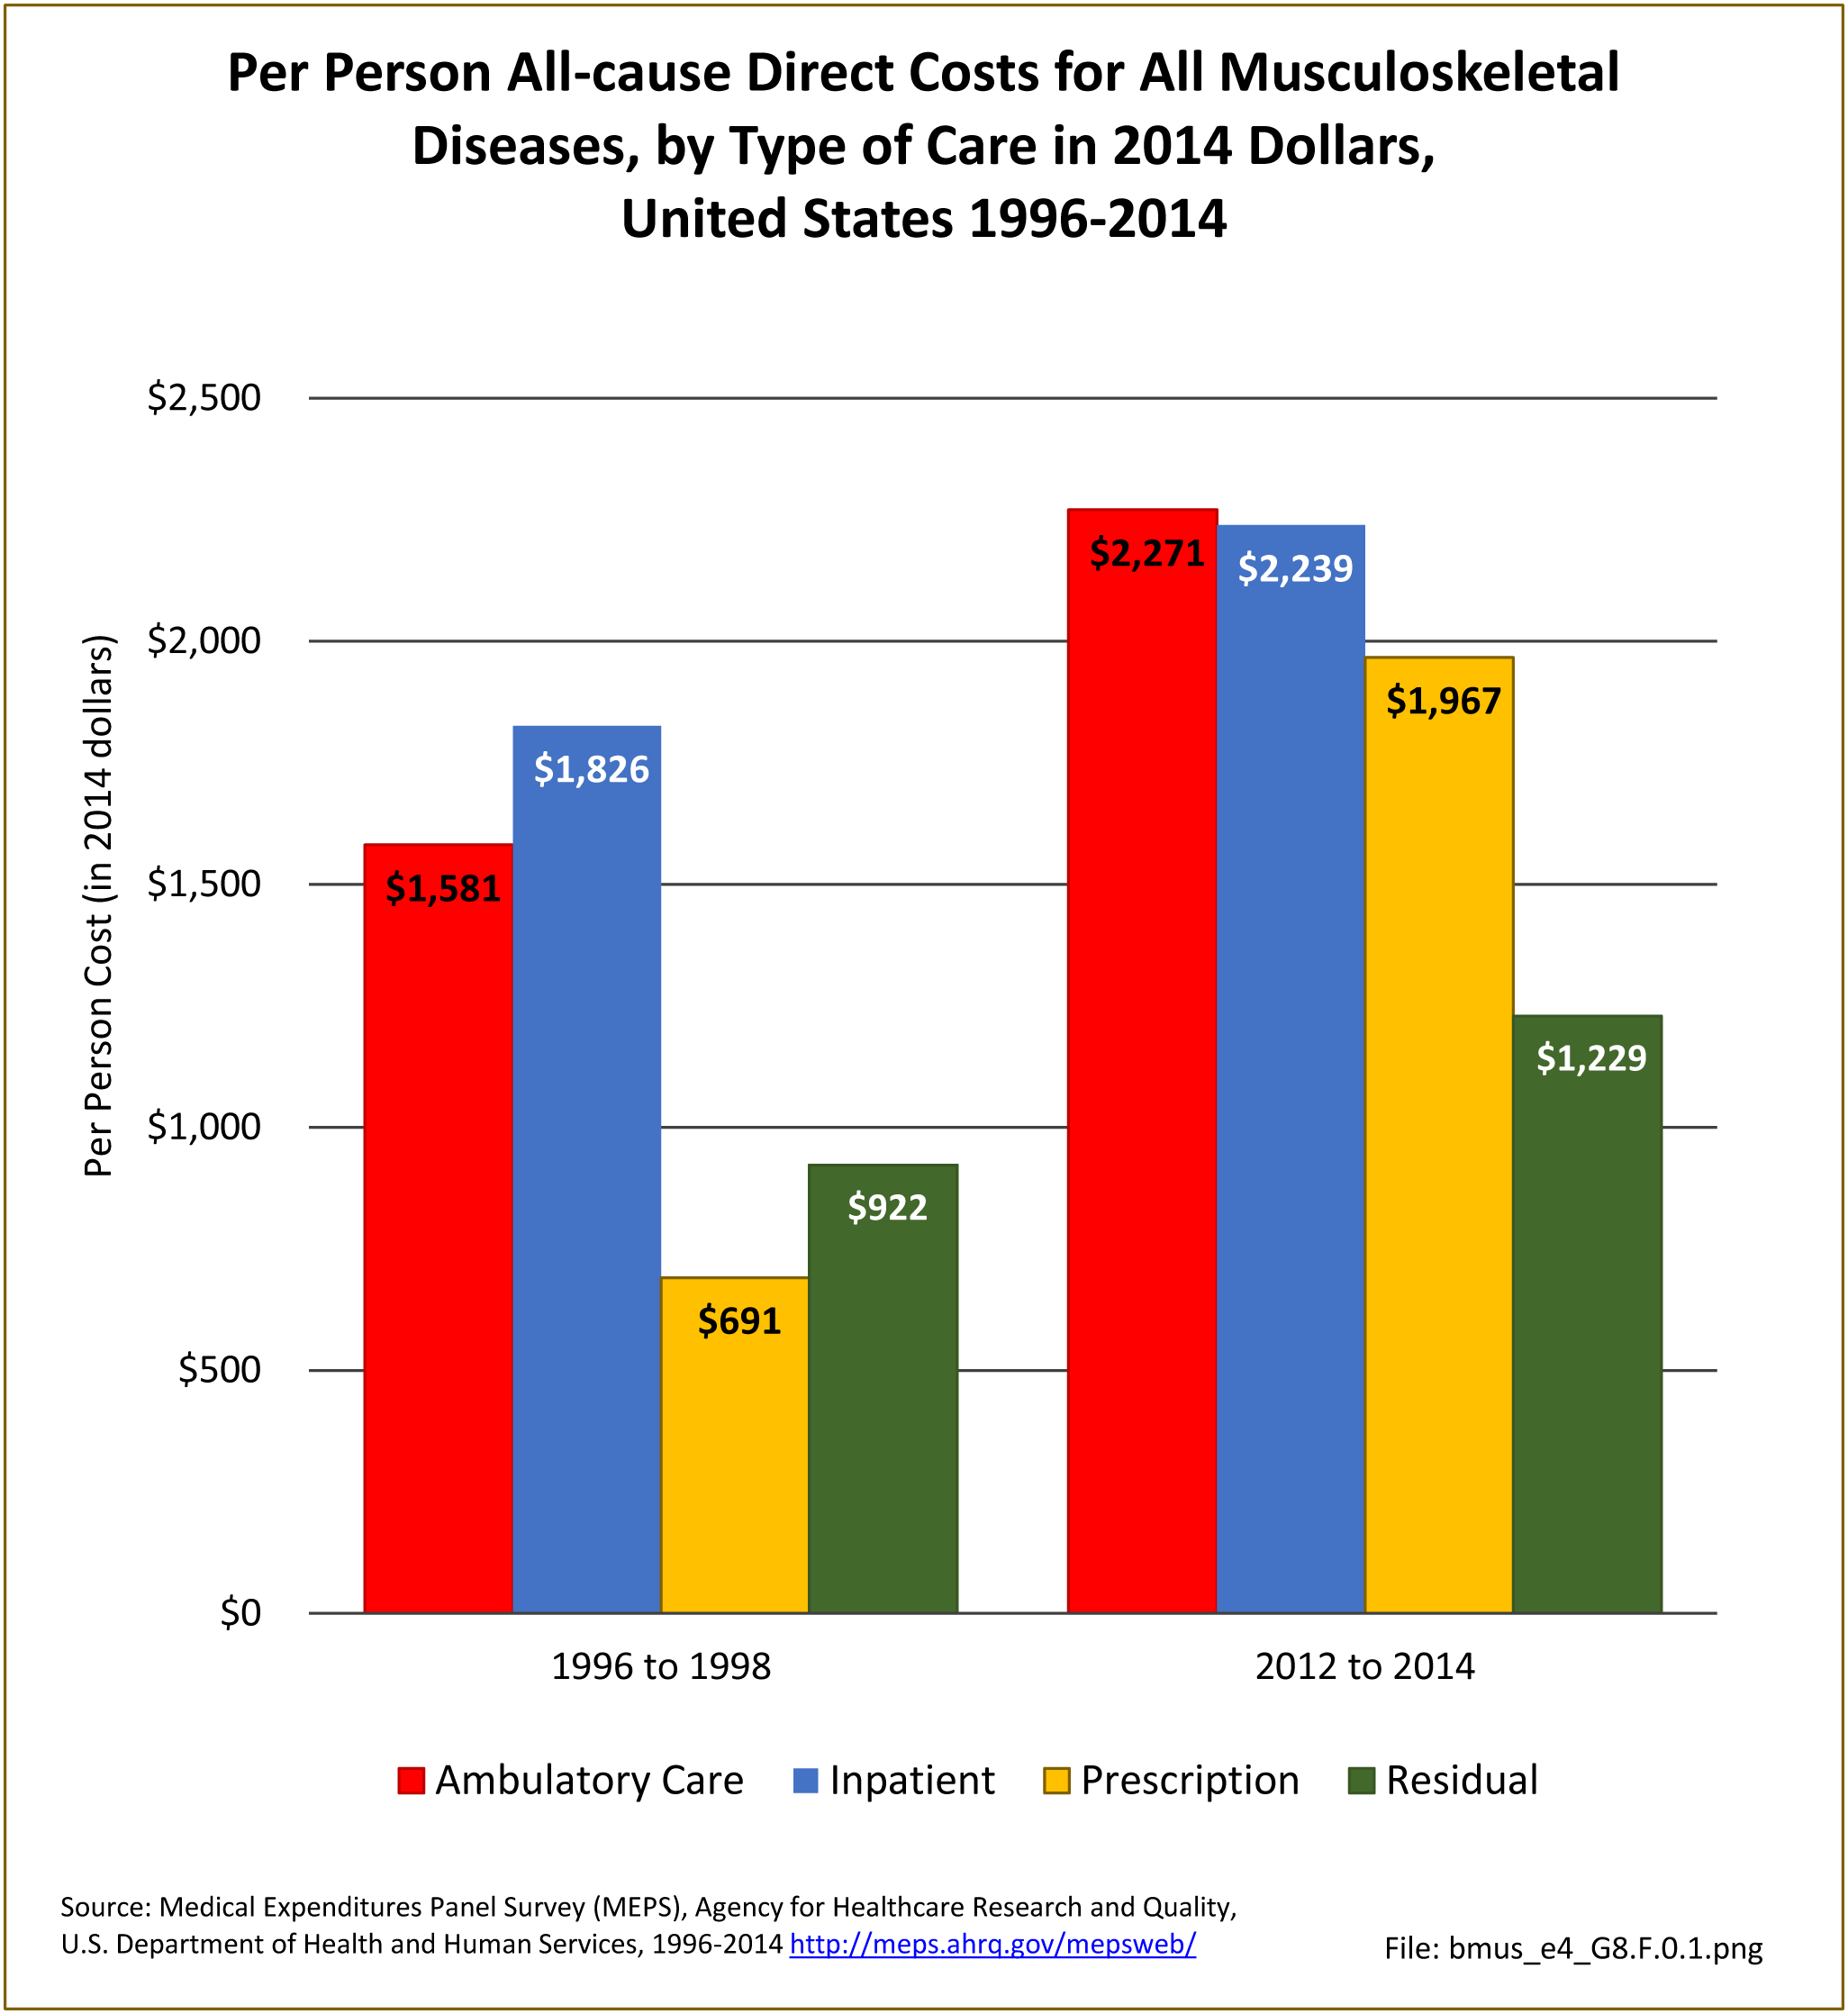
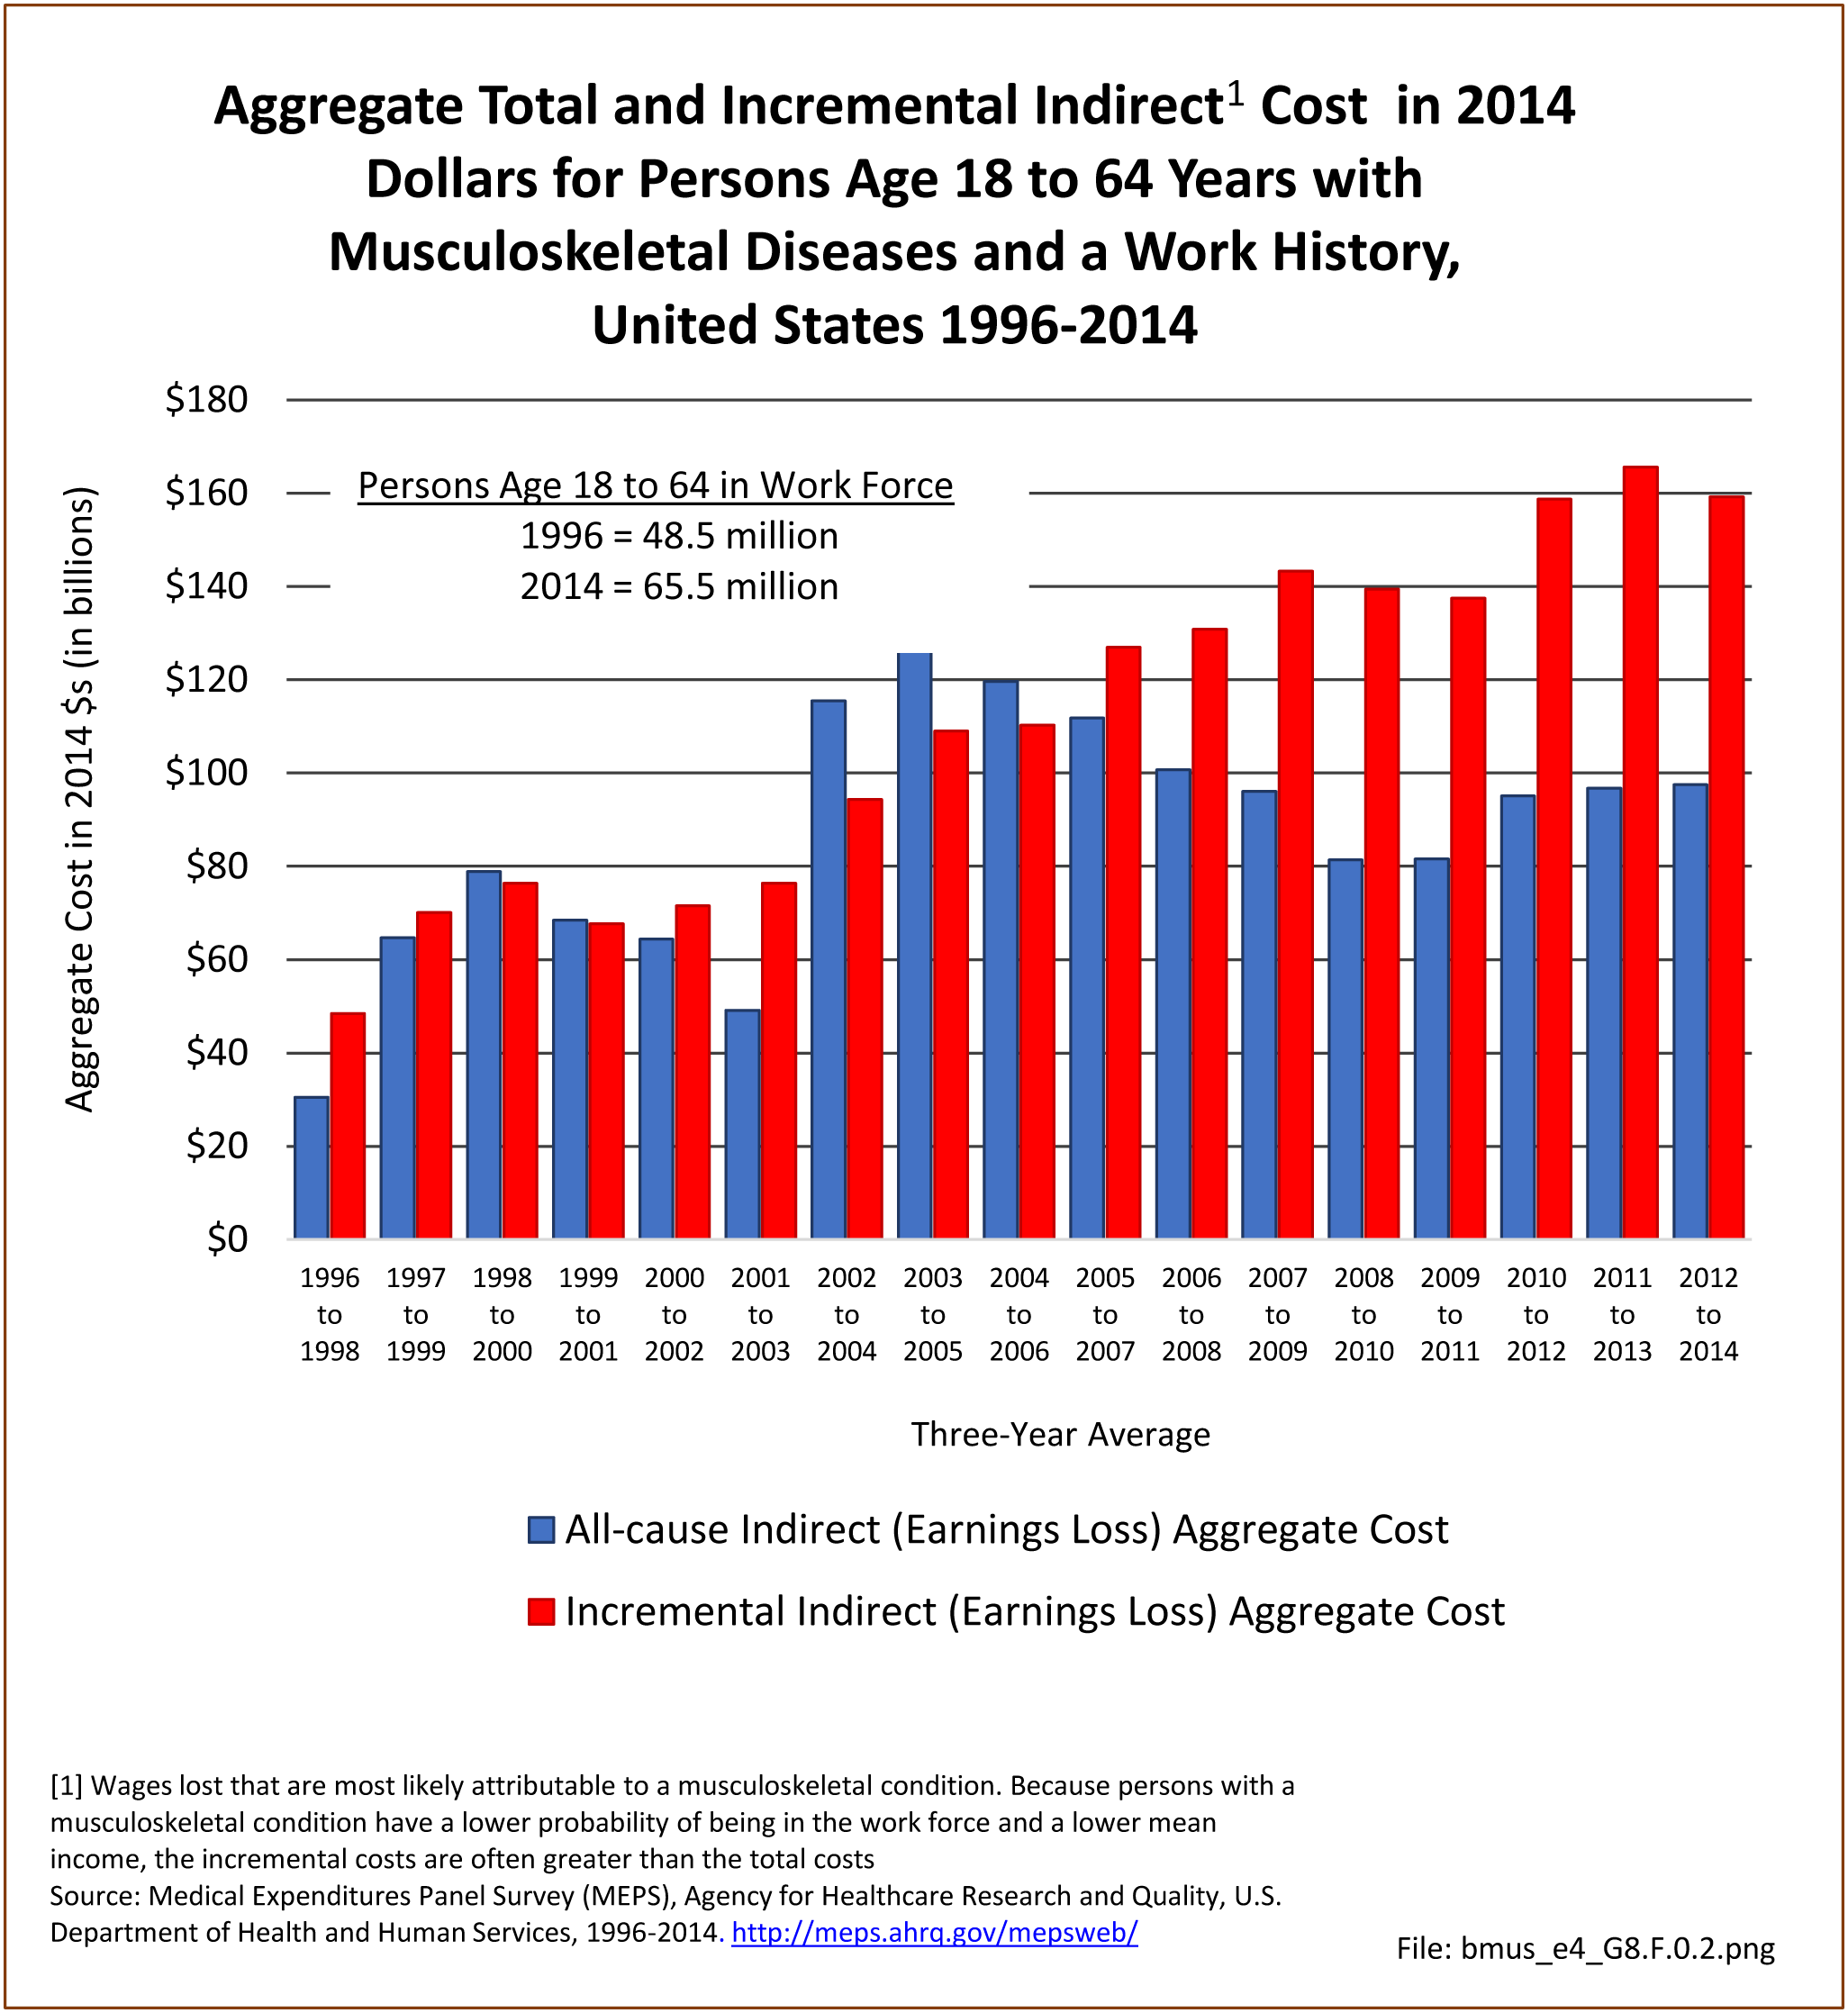
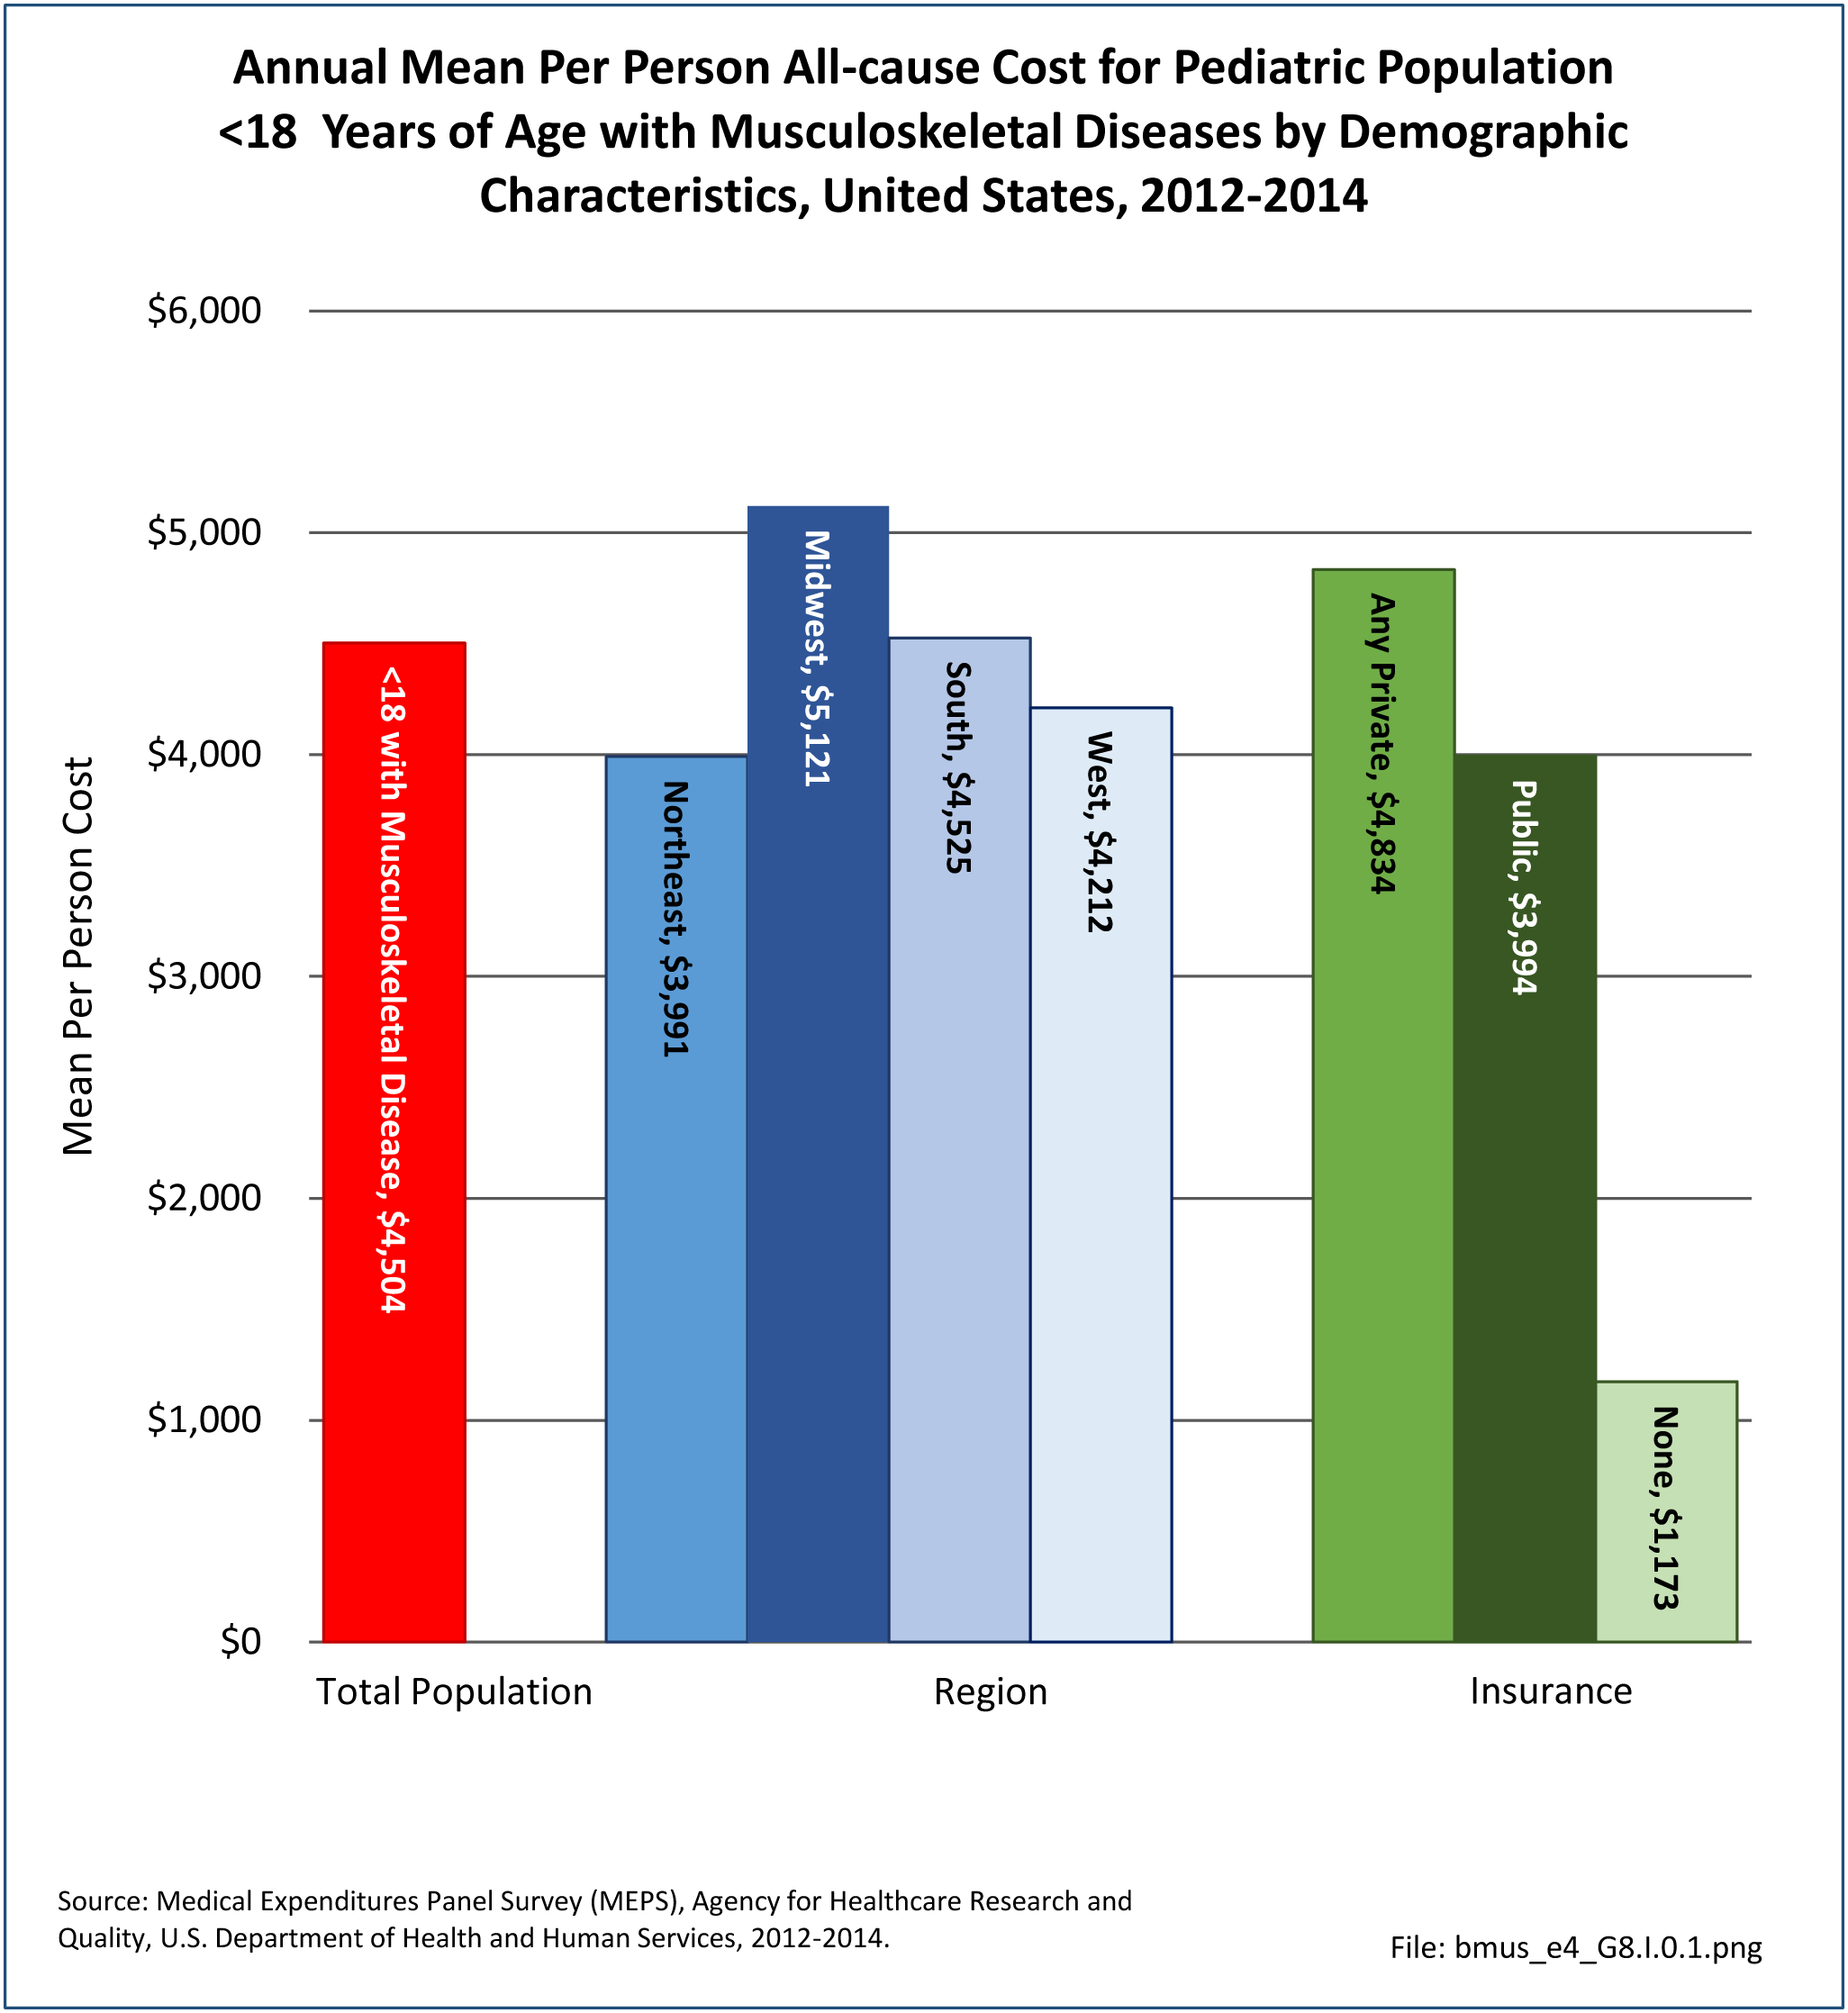
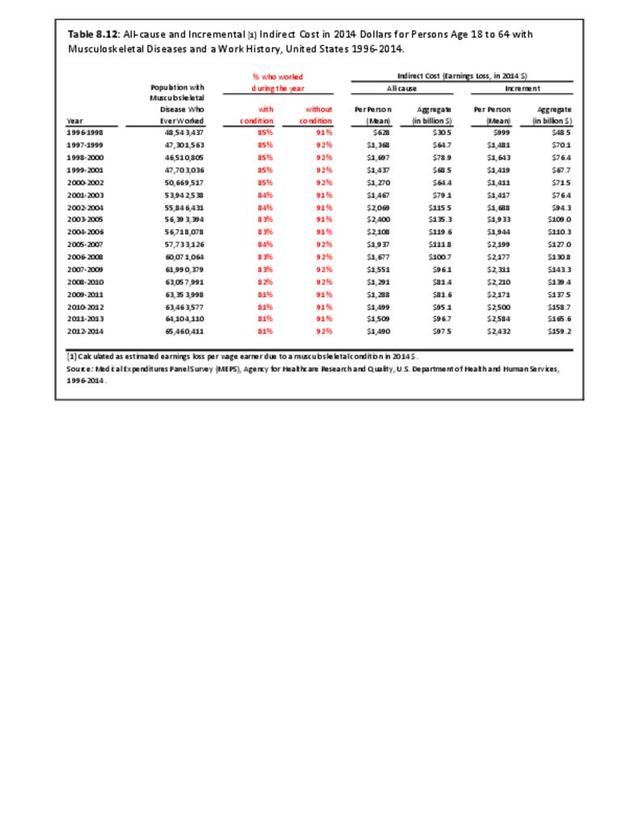
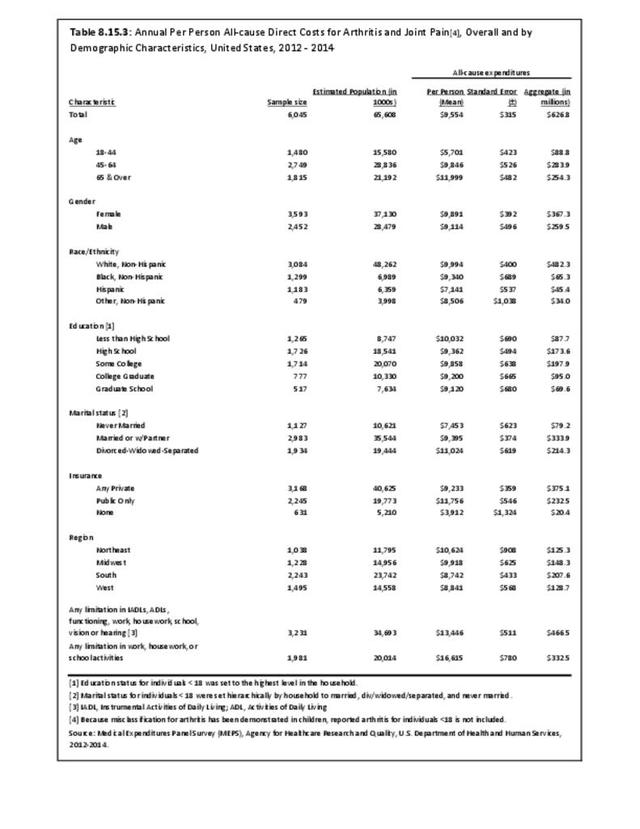
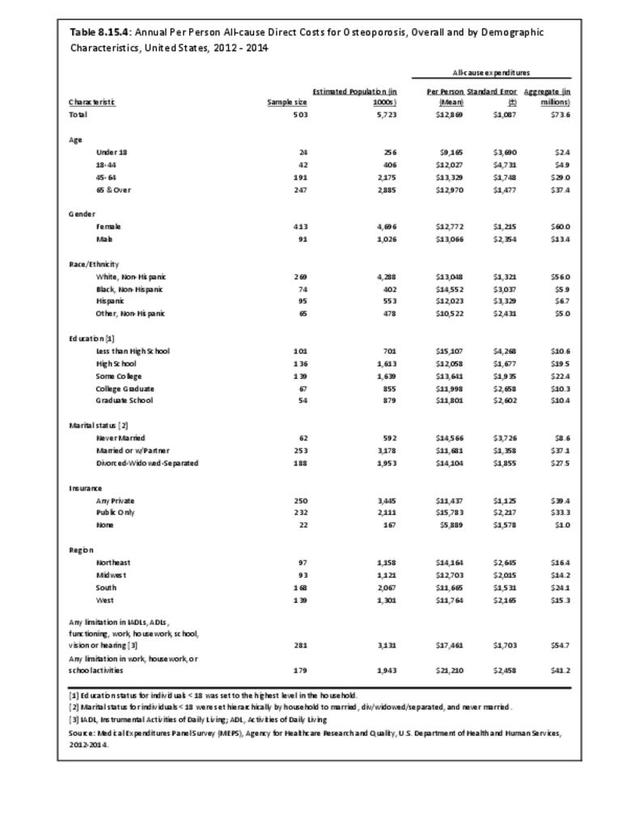
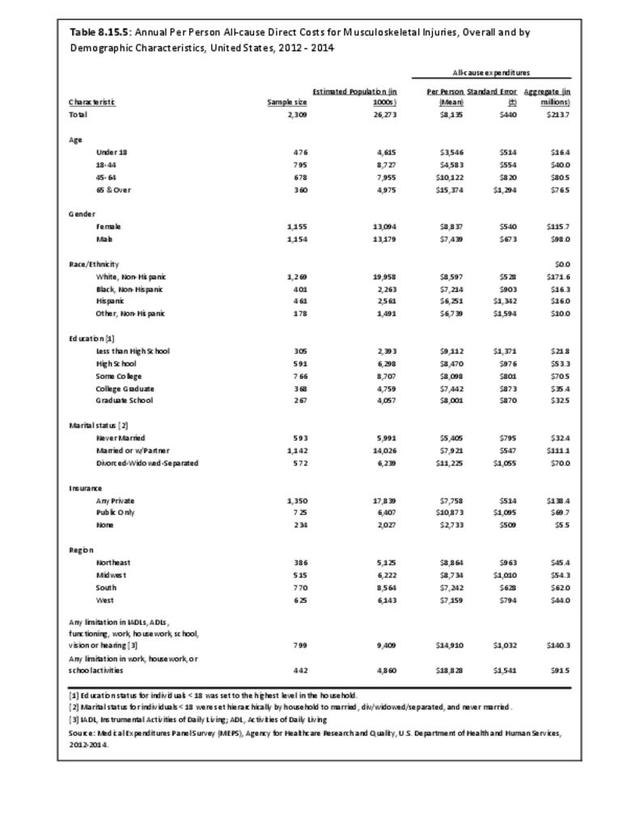
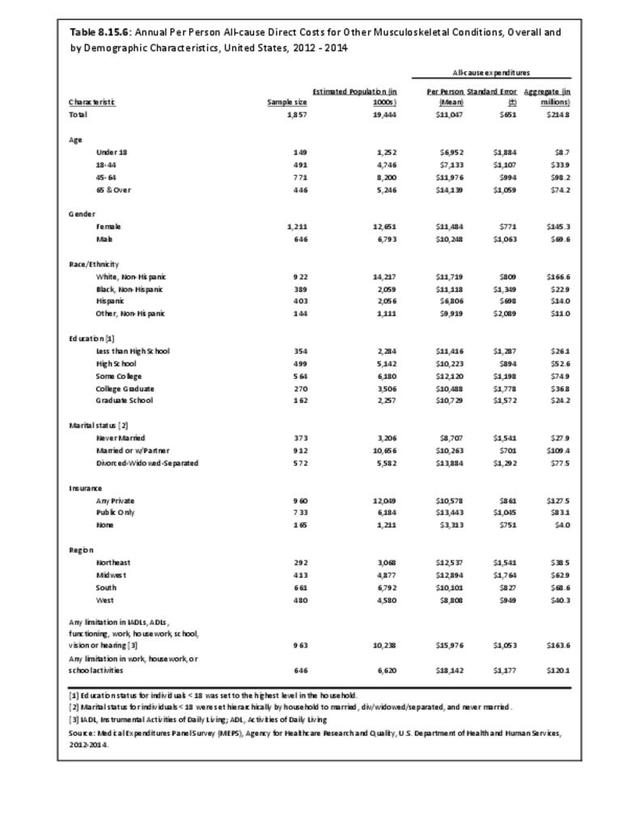
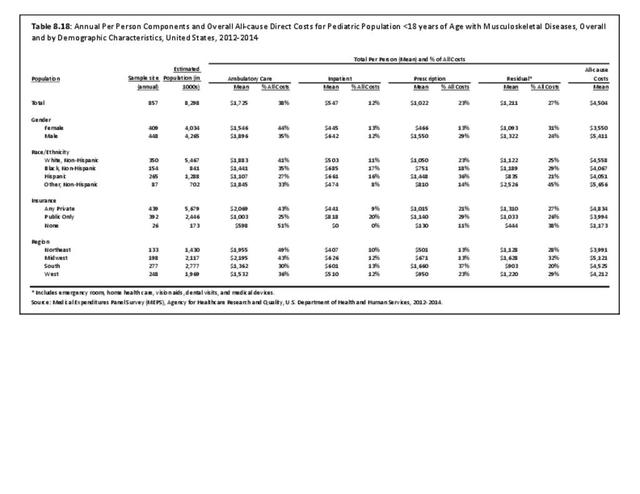
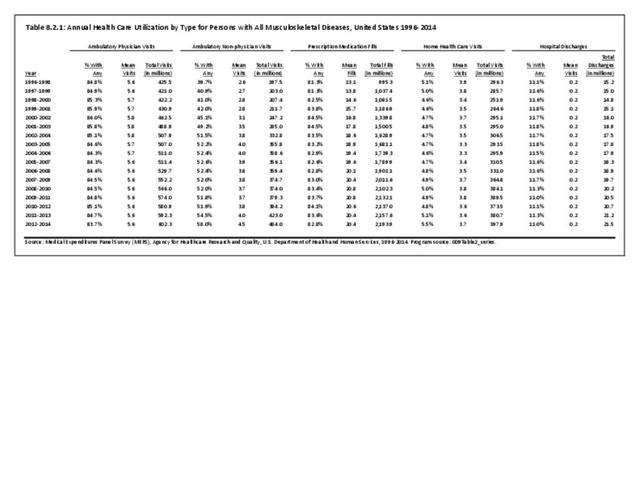
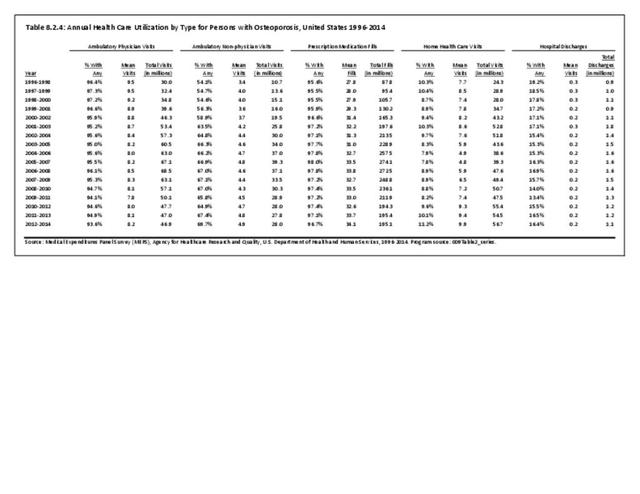
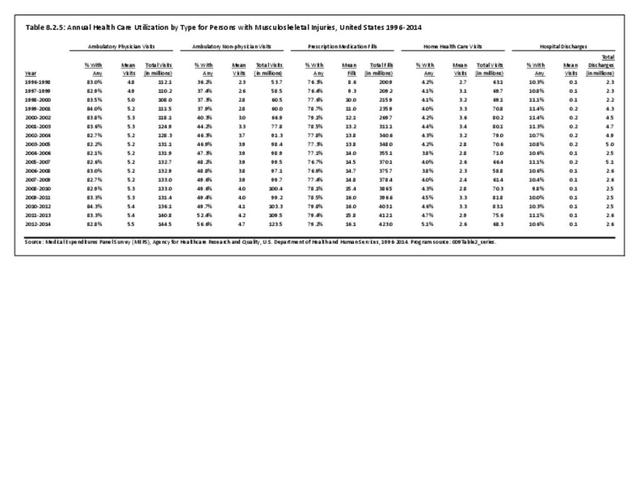
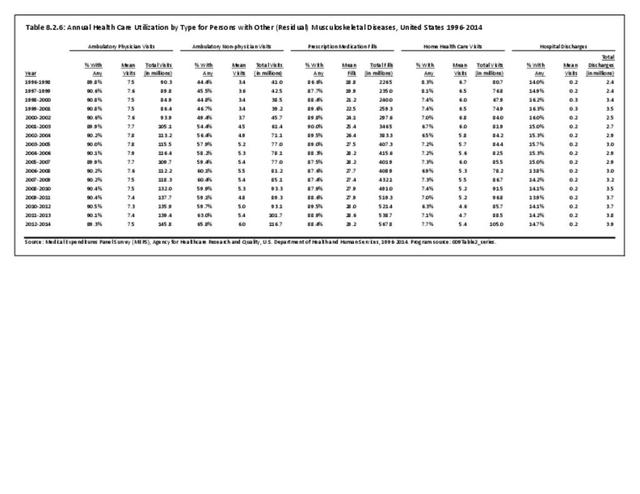
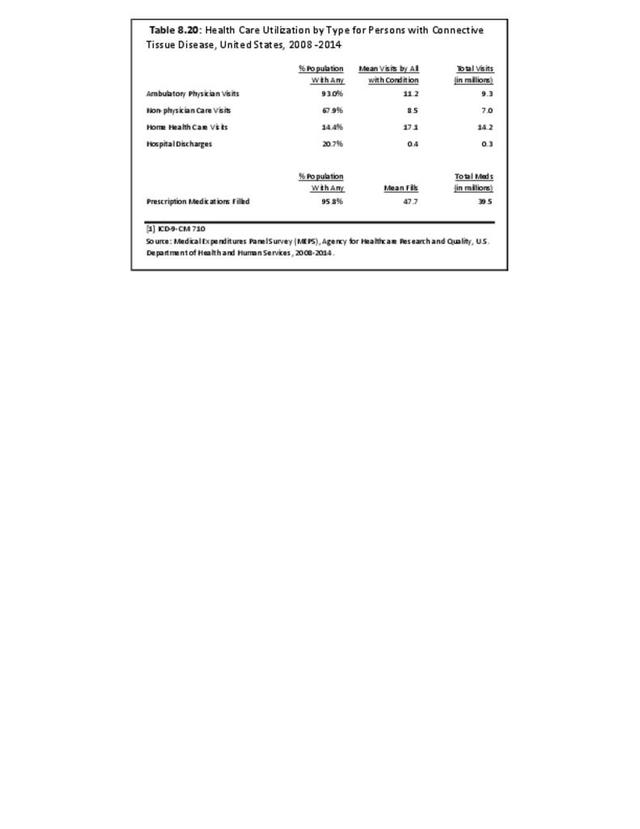
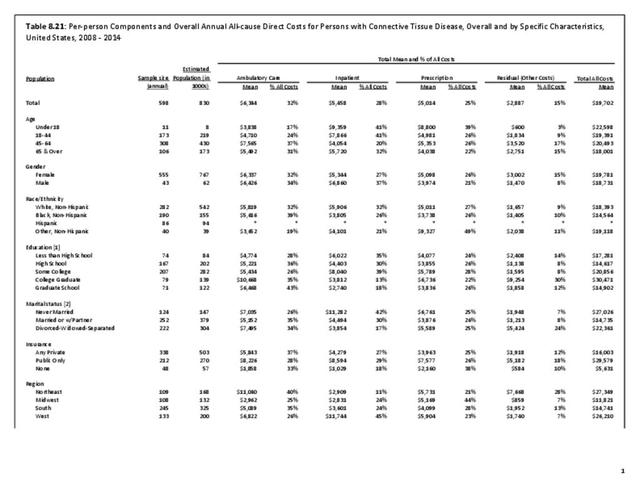
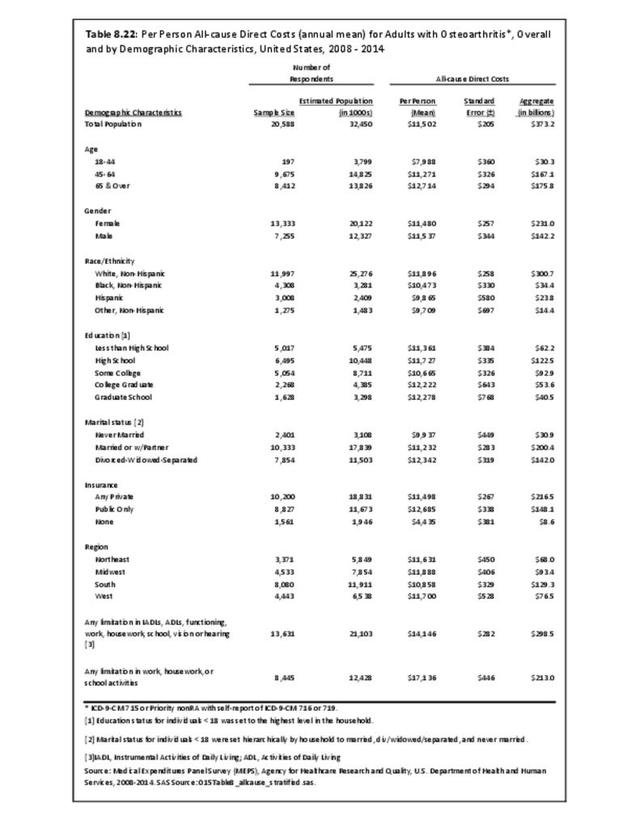
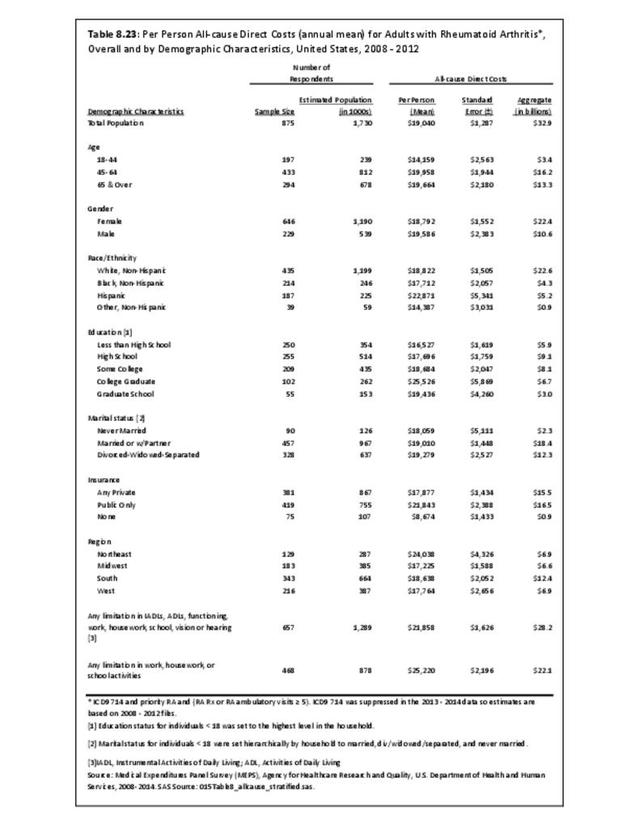
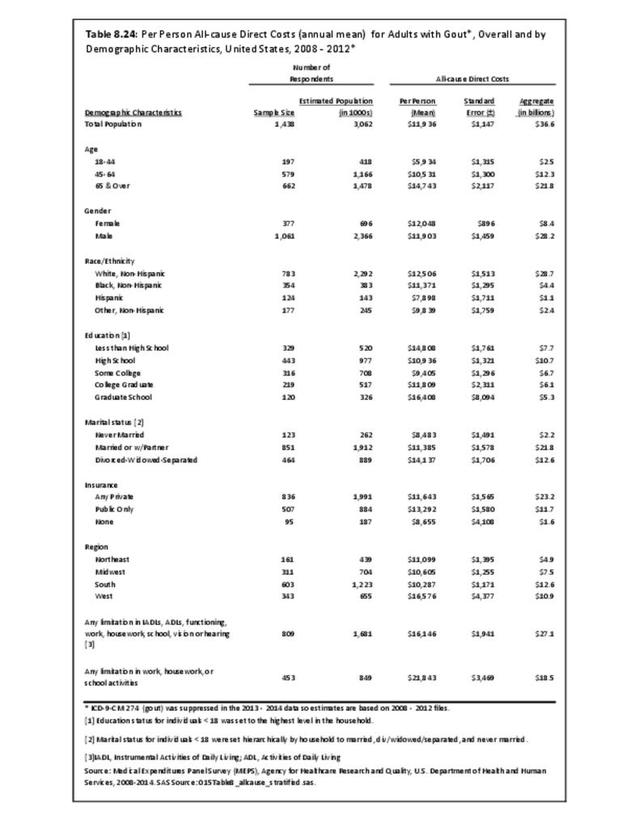
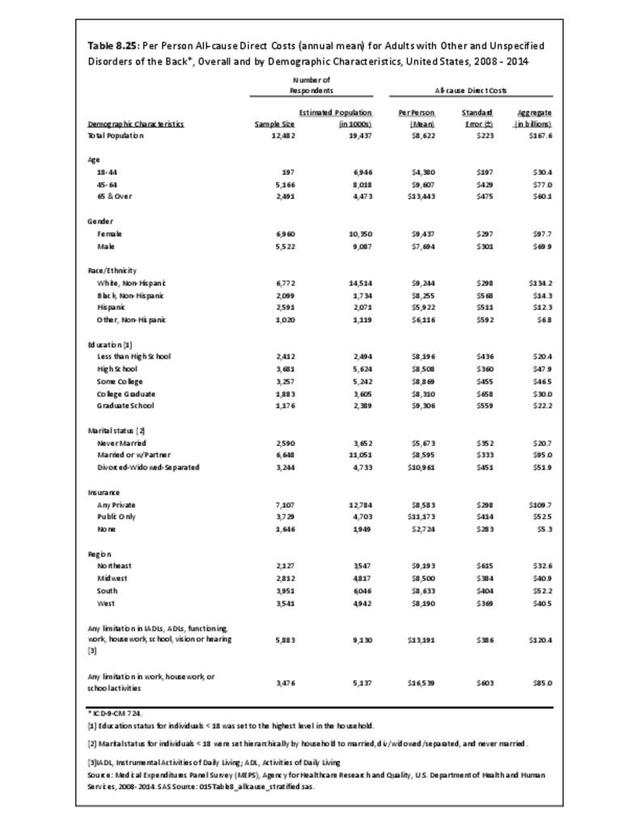
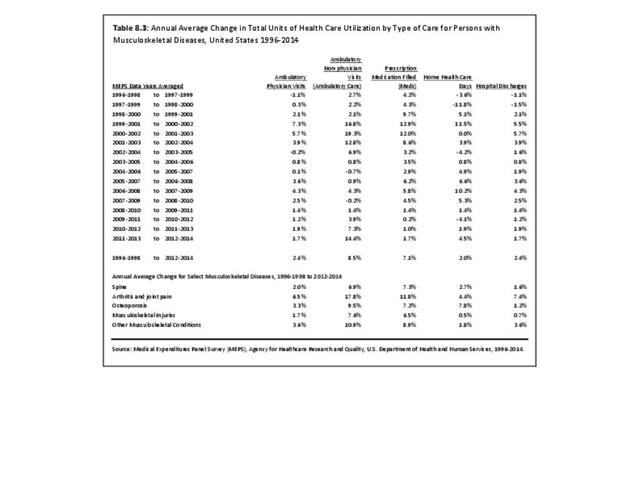
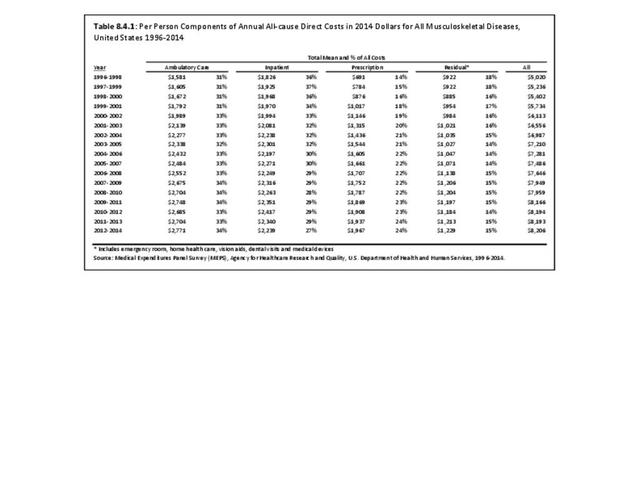
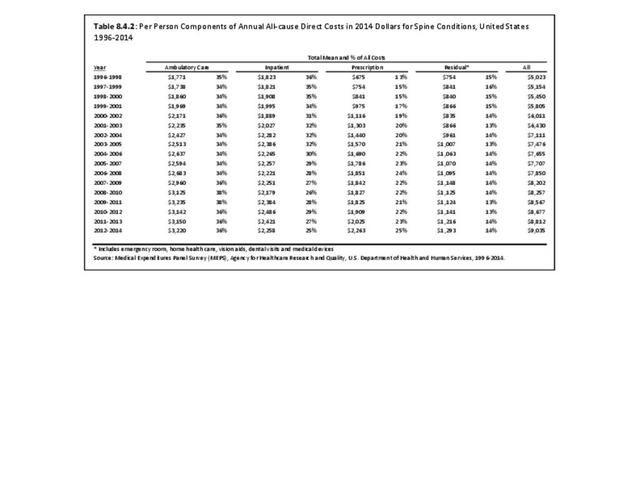
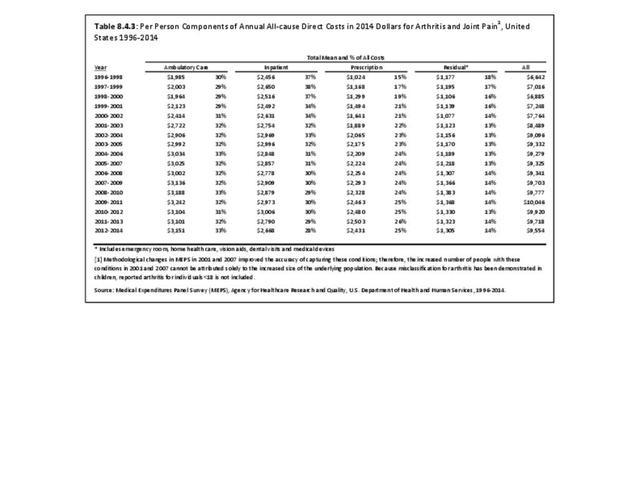
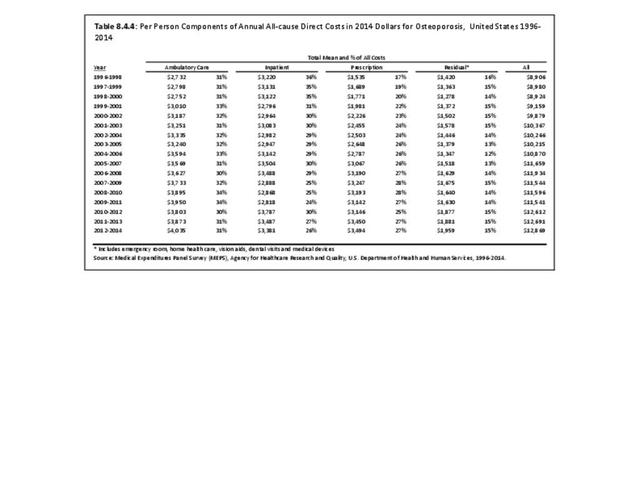
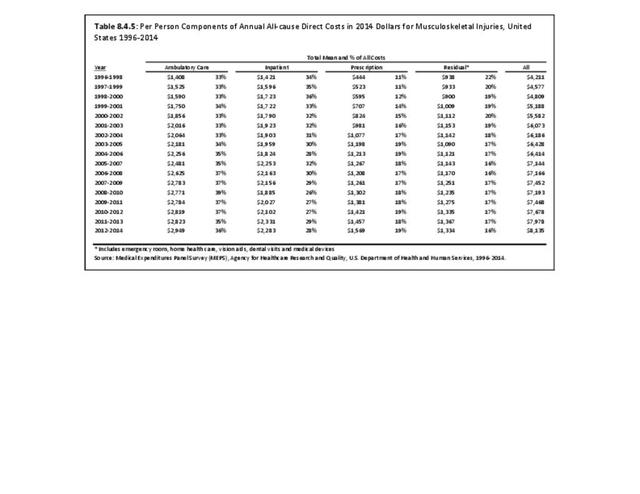
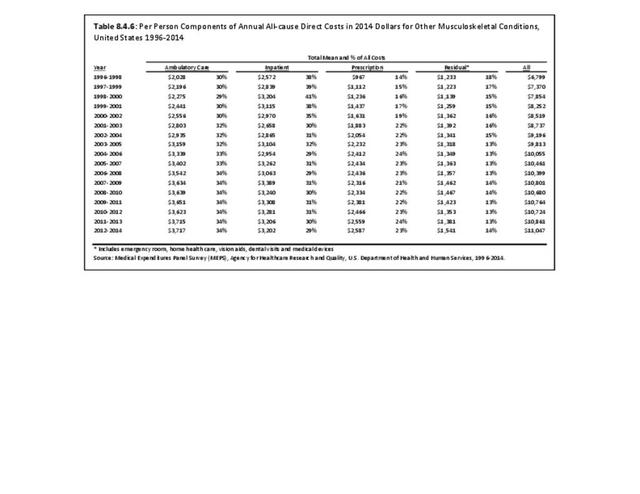
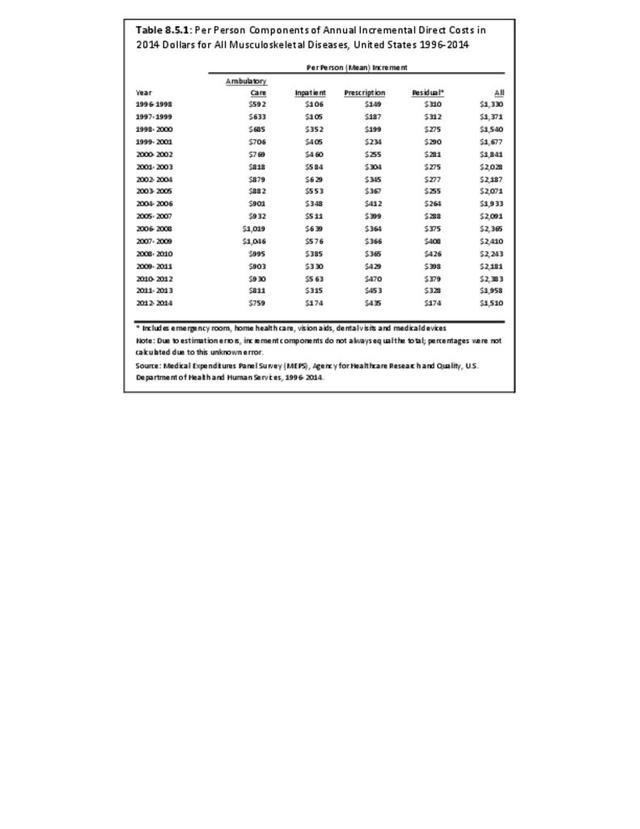
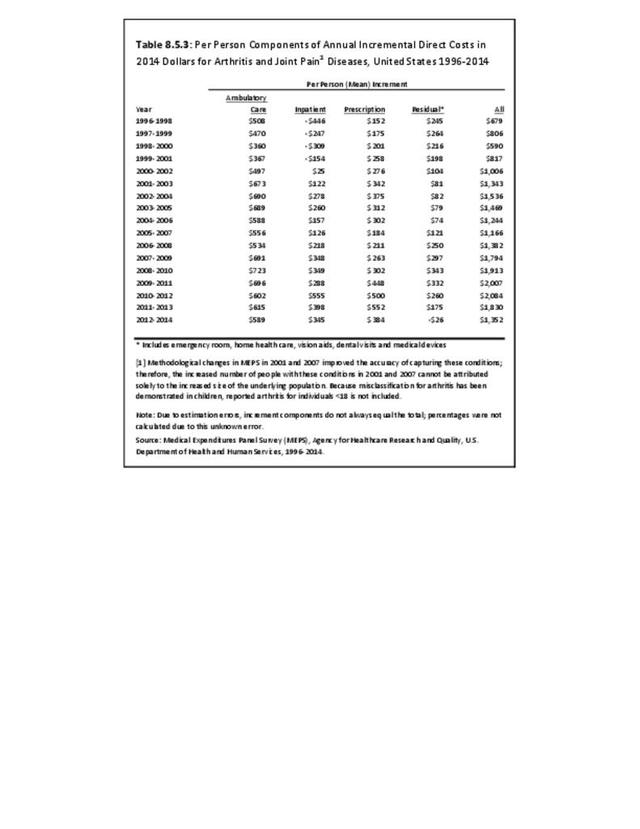
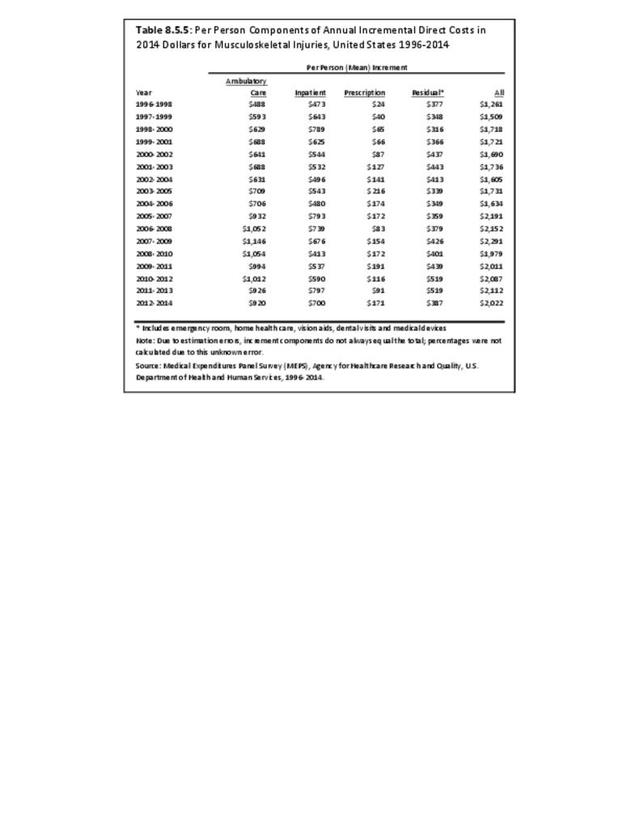
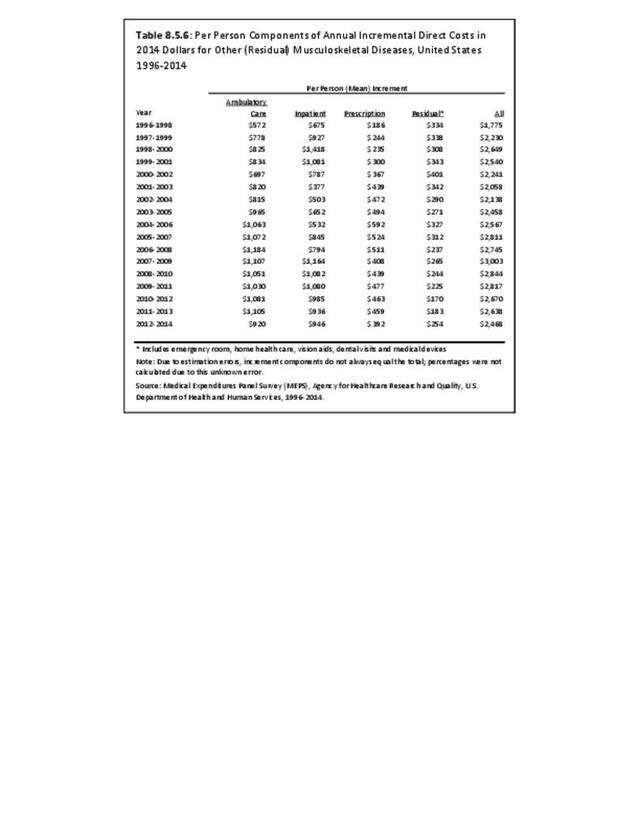
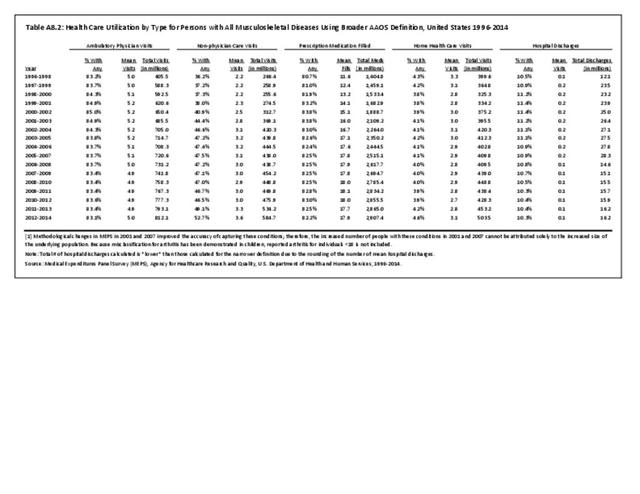
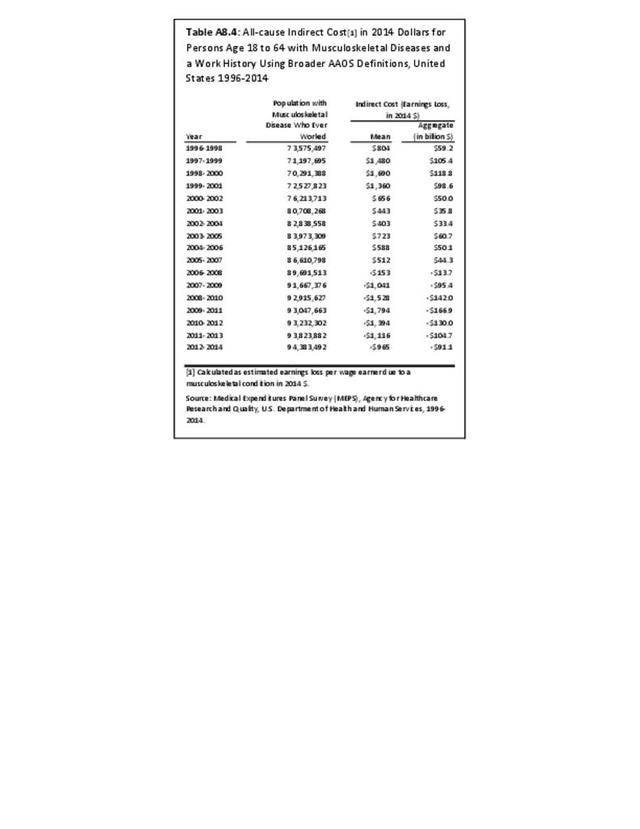
Direct medical costs estimated here capture four types of healthcare resources consumed: ambulatory visits (to both physicians and non-physicians), prescription medications, home health care visits, hospital discharges, and “residual” (all other types of care). Direct medical costs in this chapter measure actual amounts paid, rather than charges. Indirect costs estimated in this chapter are those associated with lost wages. In this edition of BMUS, we have subset analysis of lost wages not just to individuals with a work history, but to those ages 18 to 64 — the typical age range for persons in the workforce. Previous editions of BMUS did not subset lost wage analyses by age, therefore this edition yields lower numbers of individuals in the workforce and, therefore, lower indirect cost estimates when compared with previous editions.
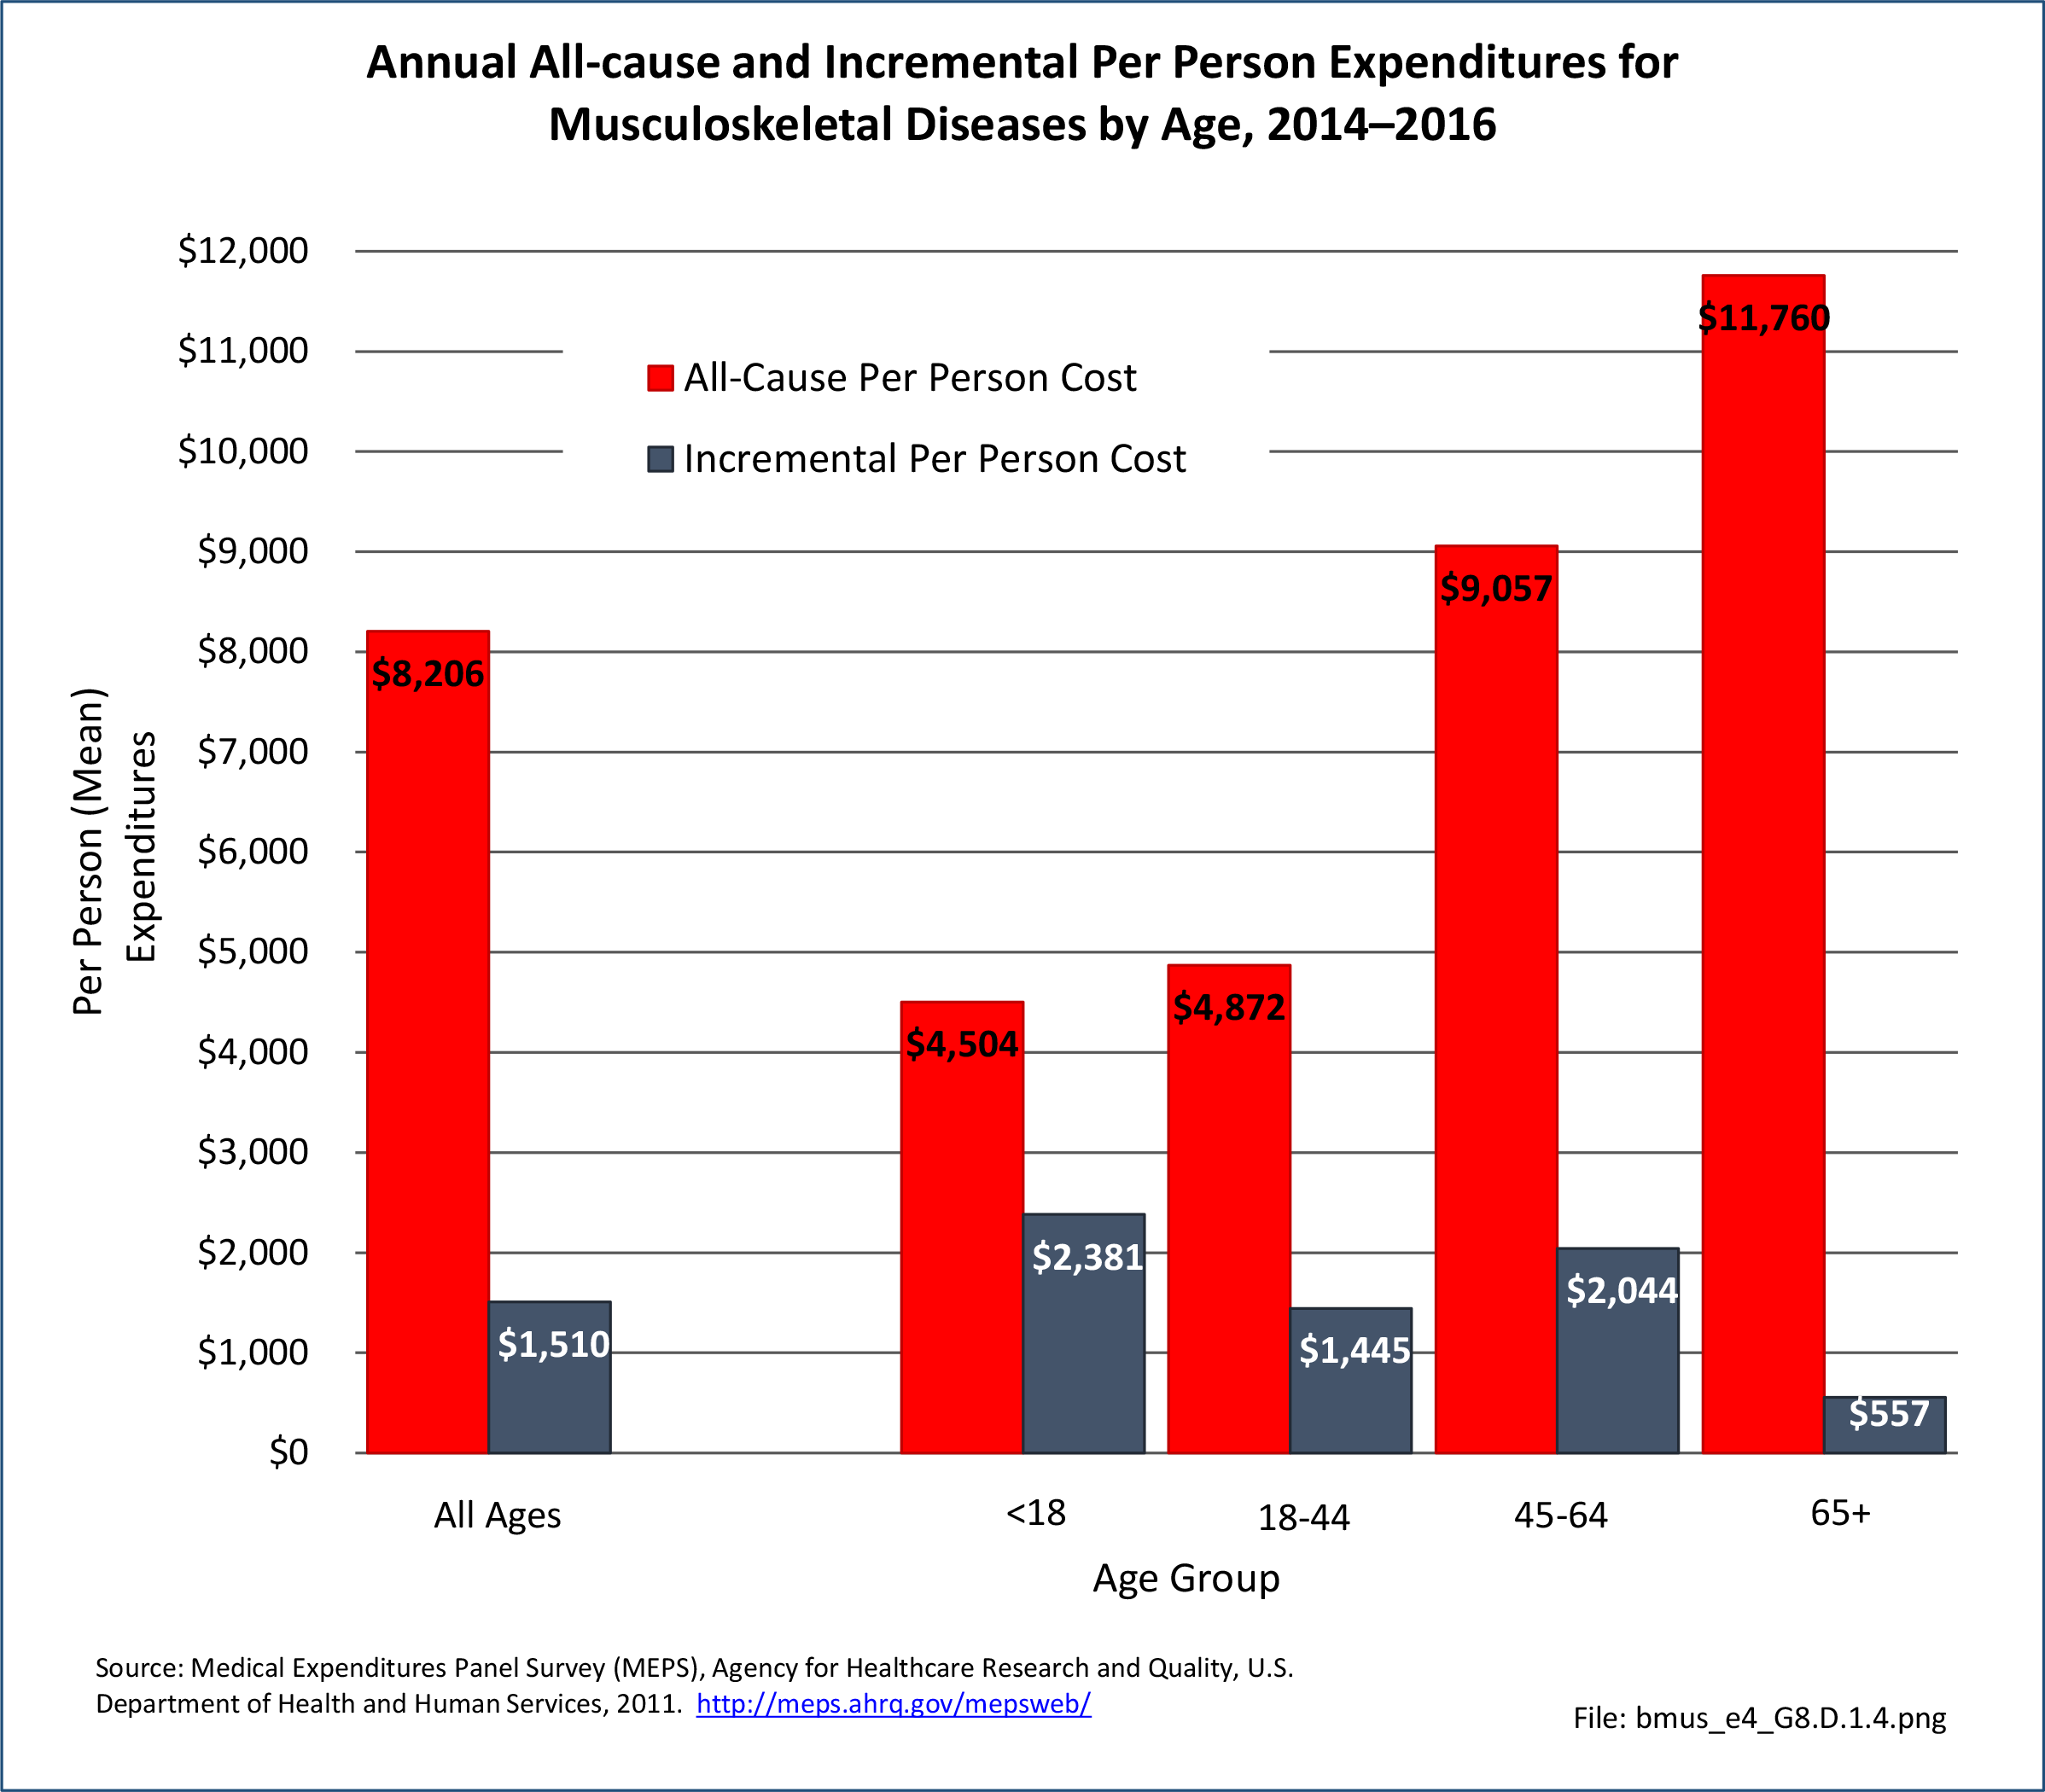
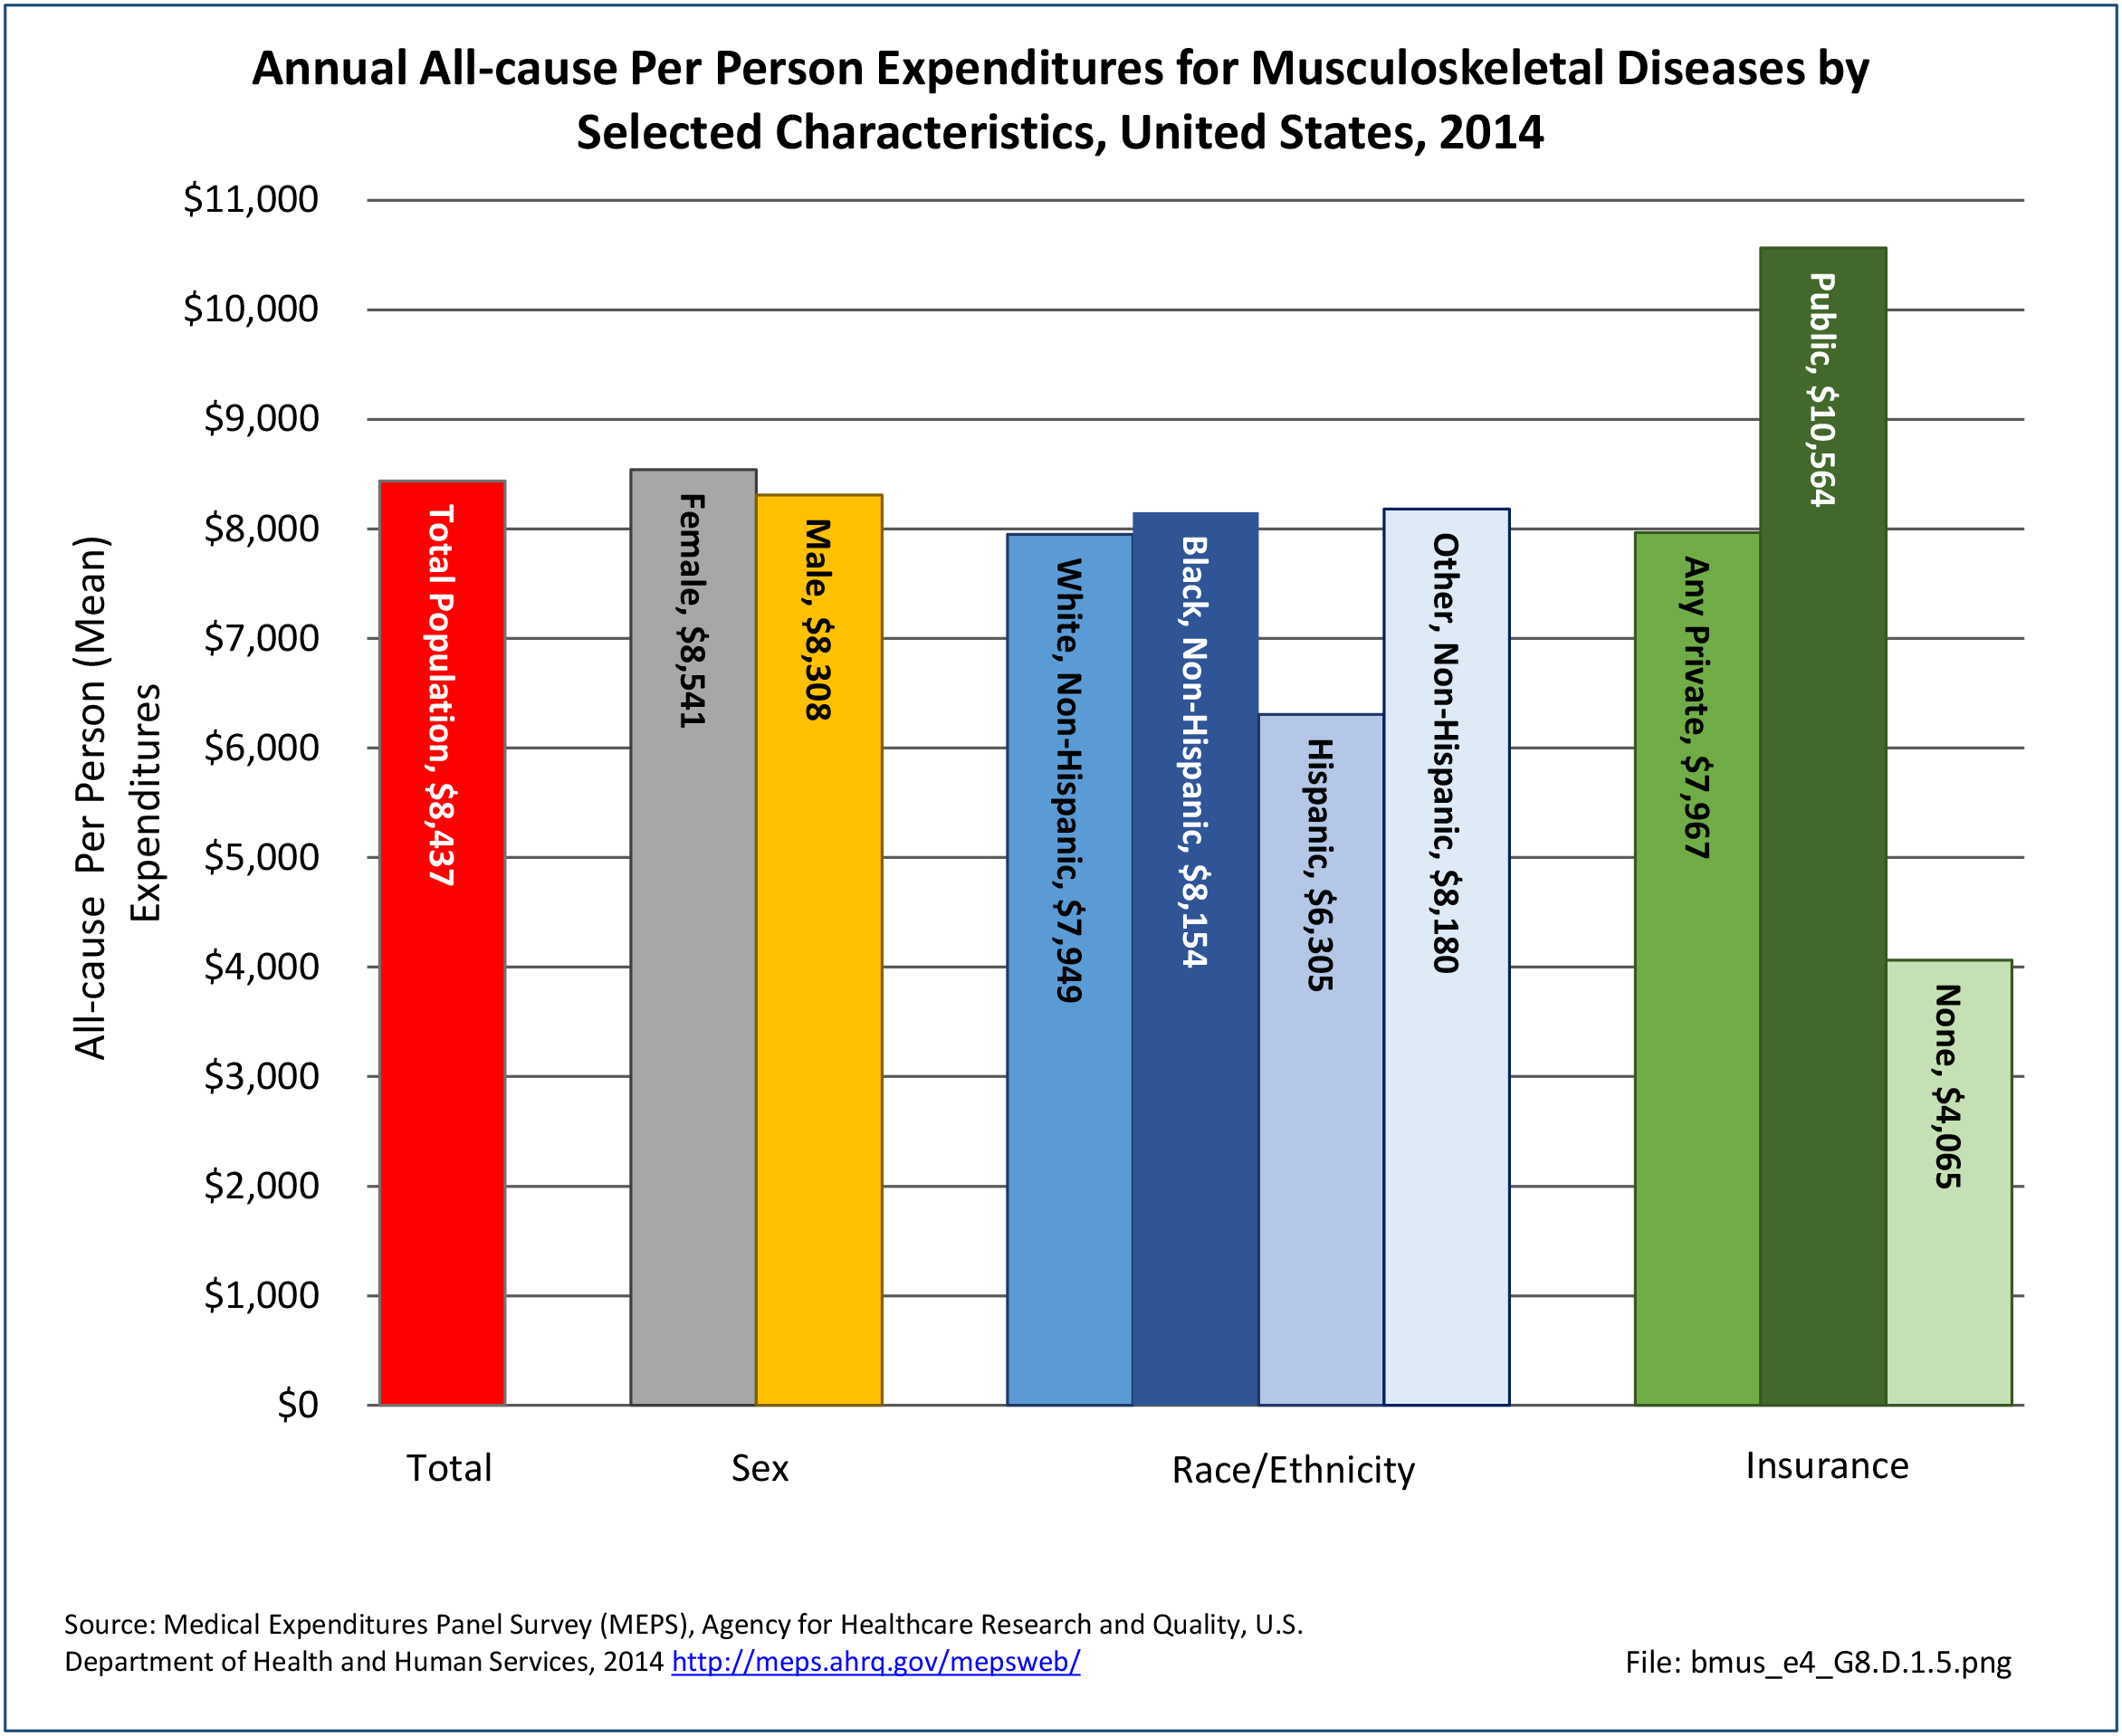
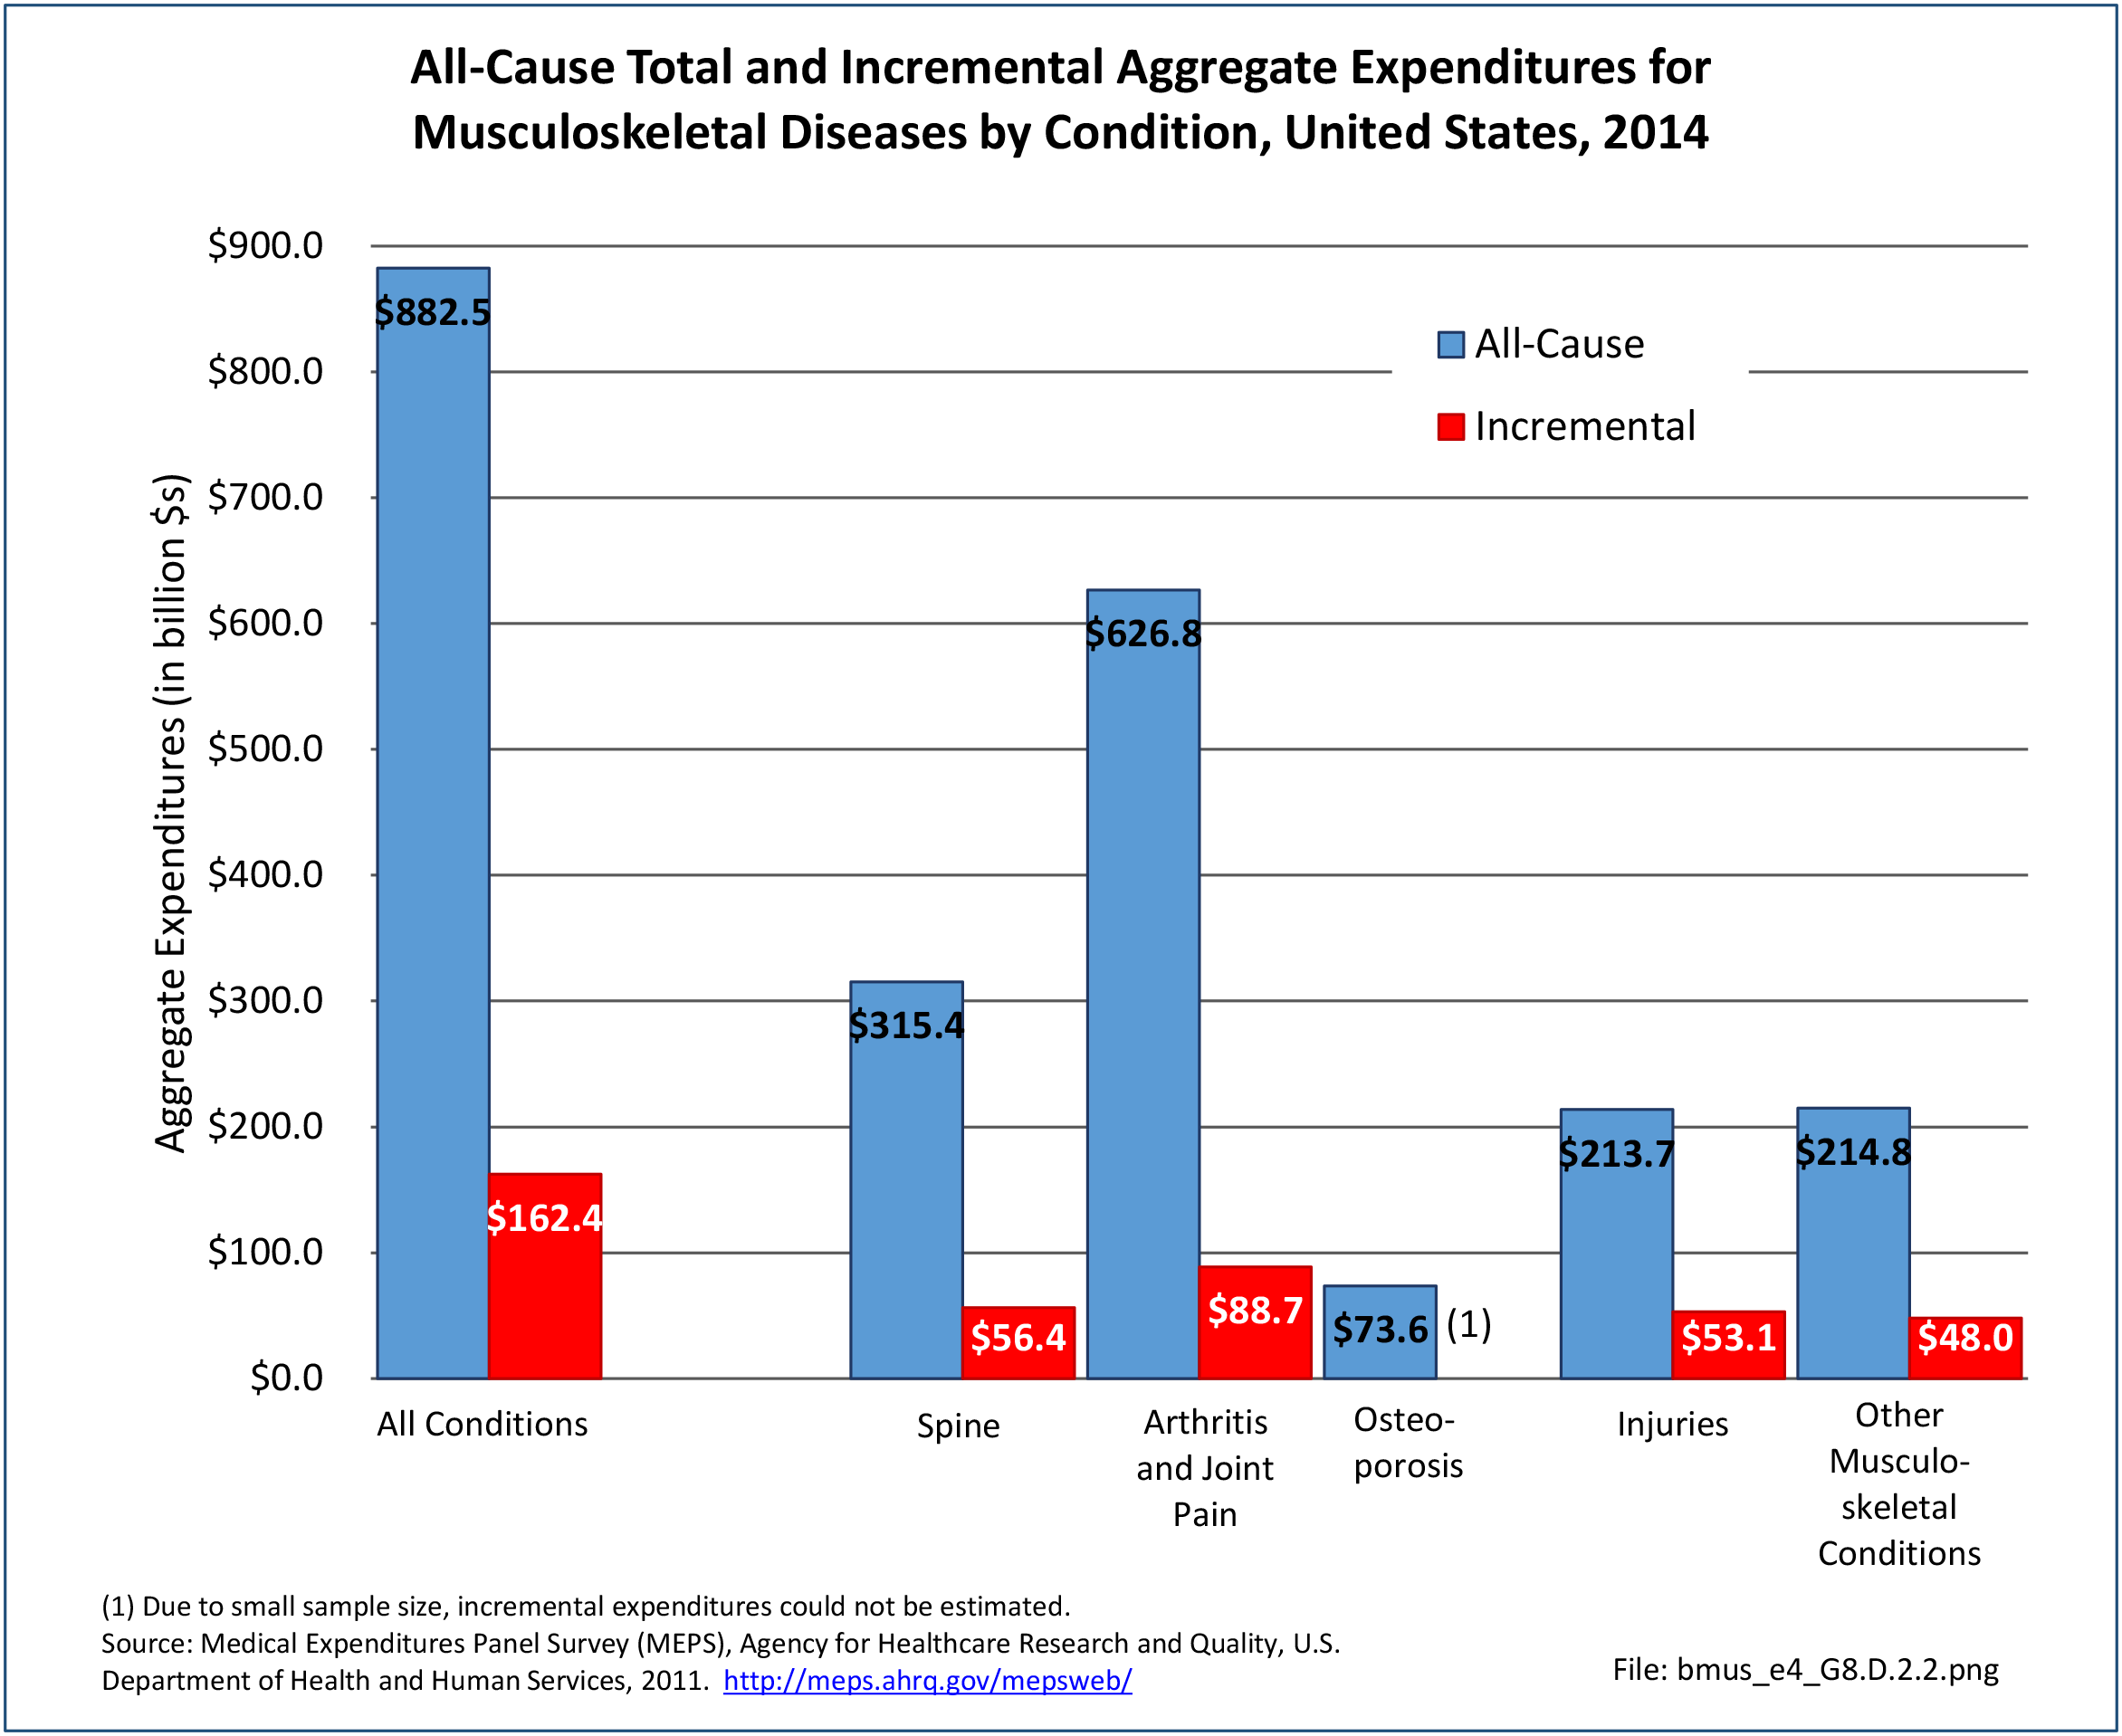
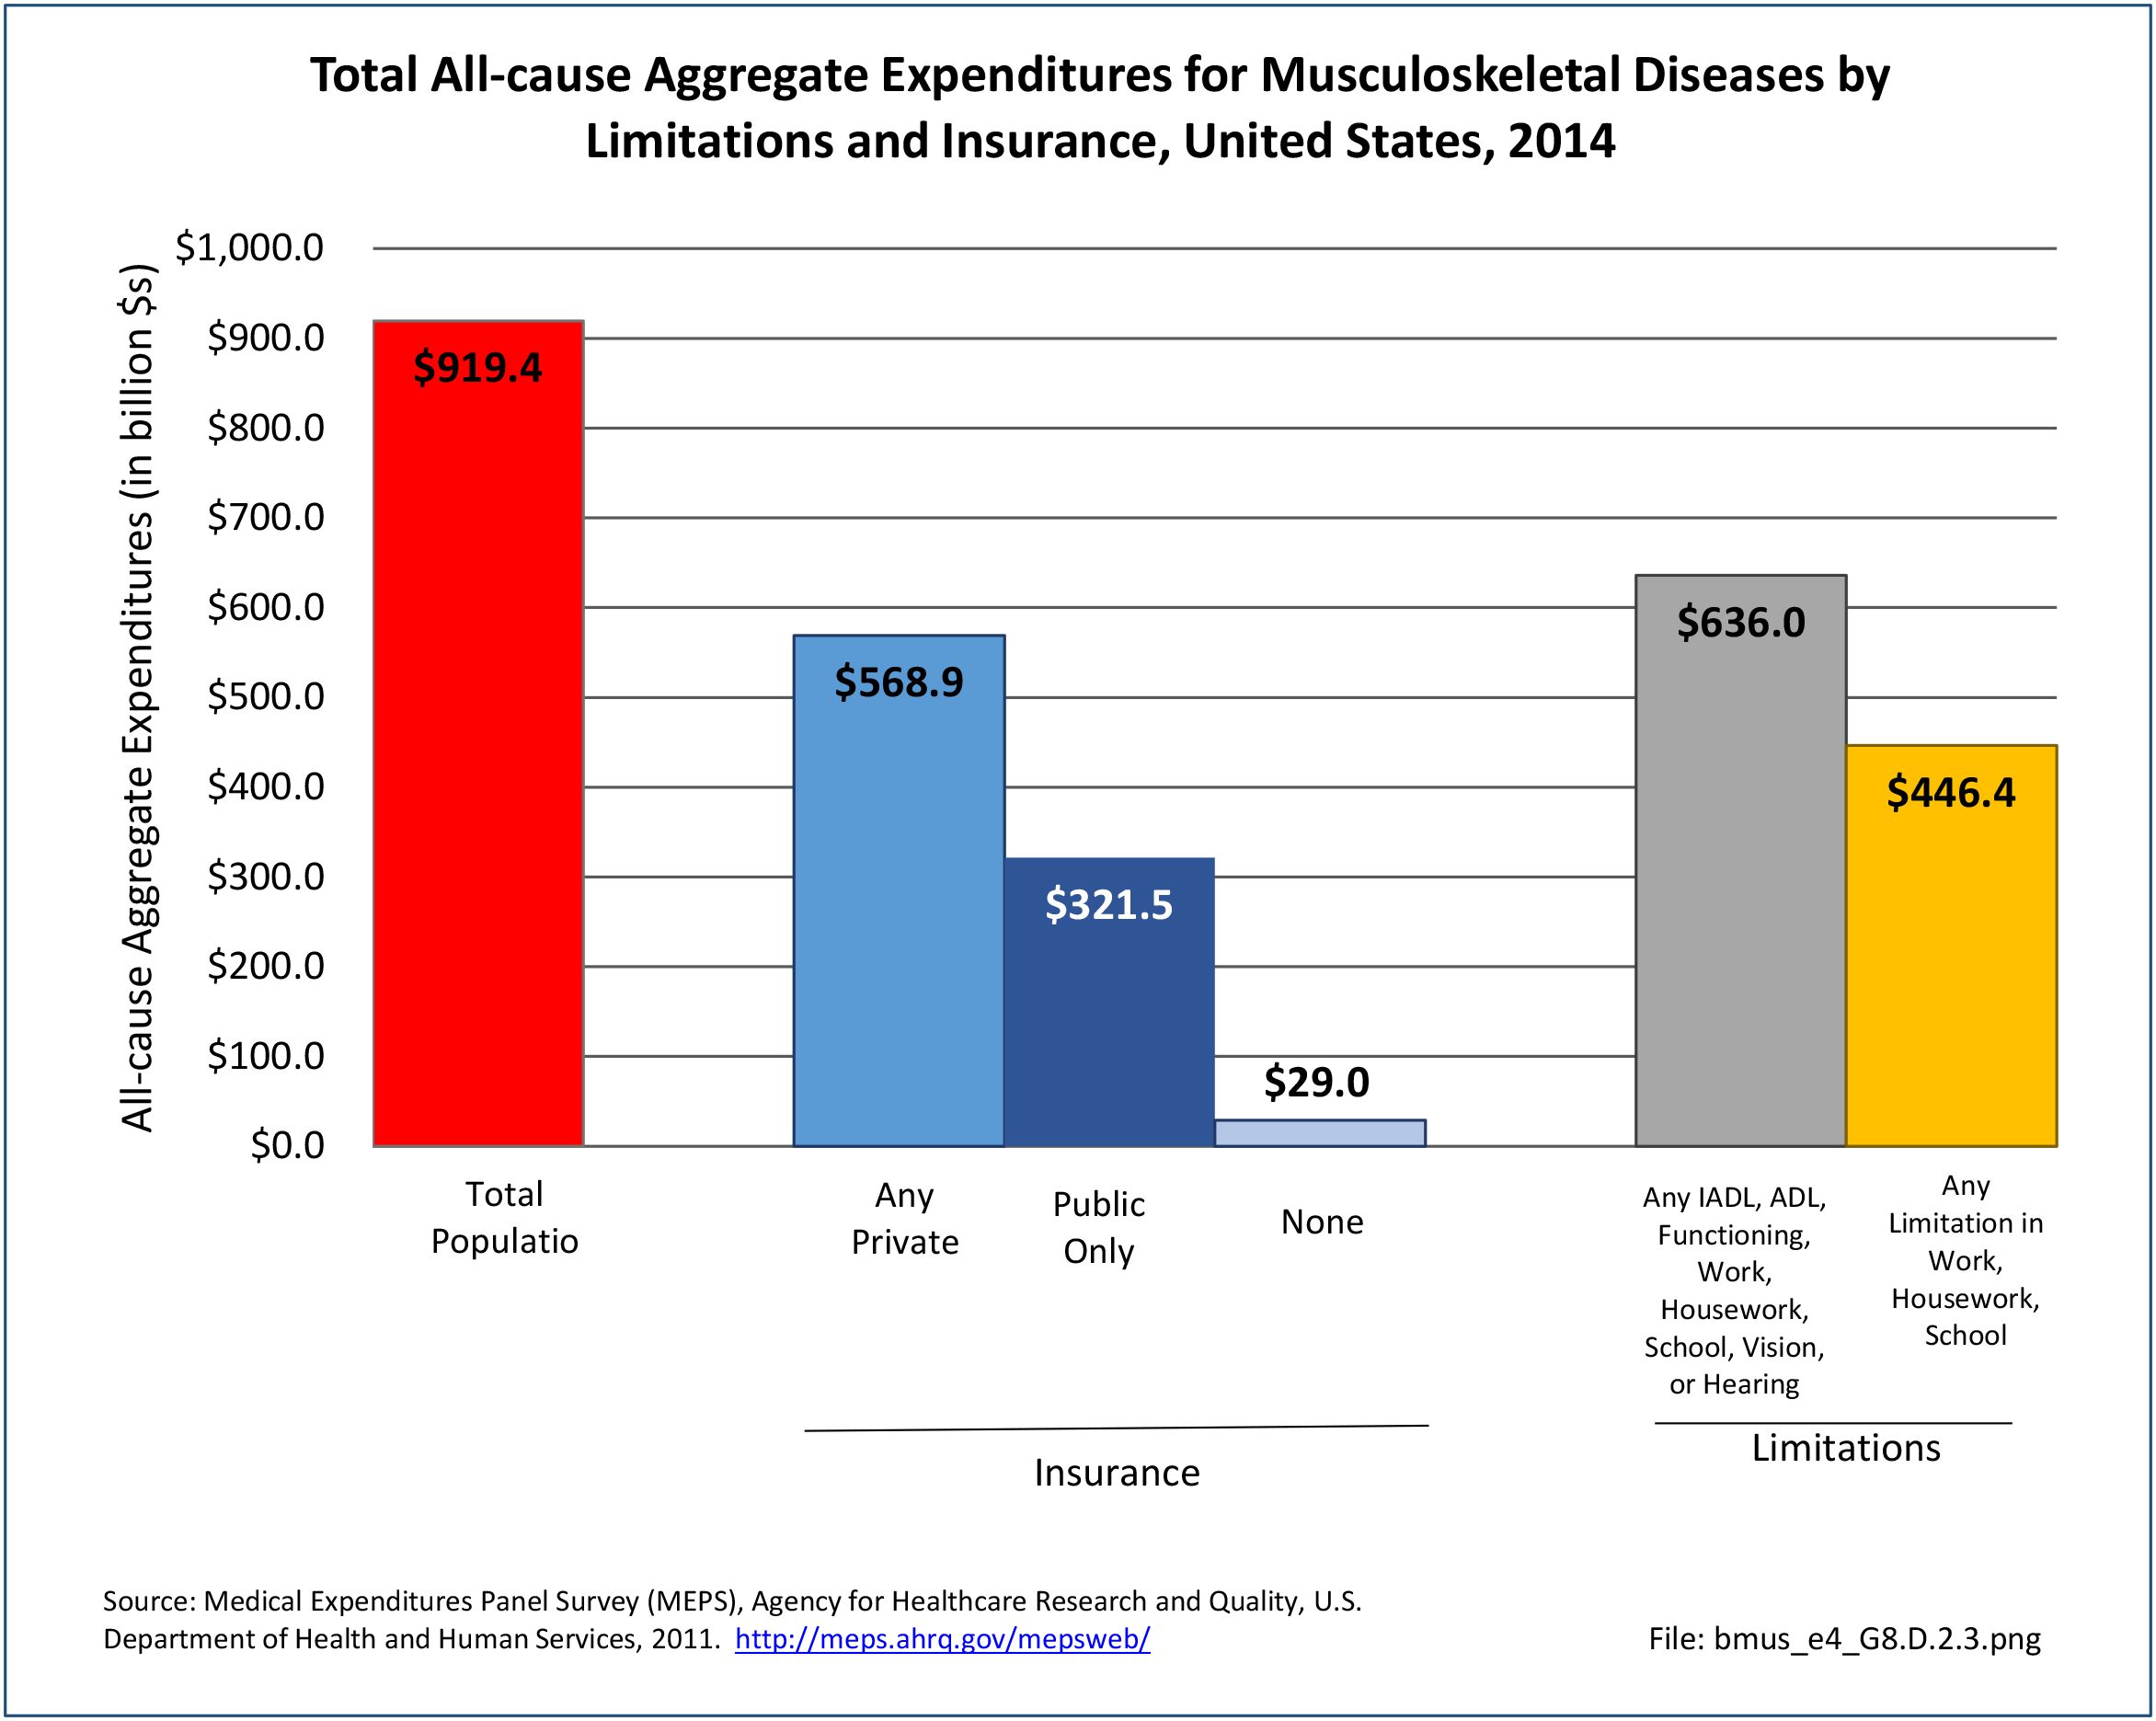
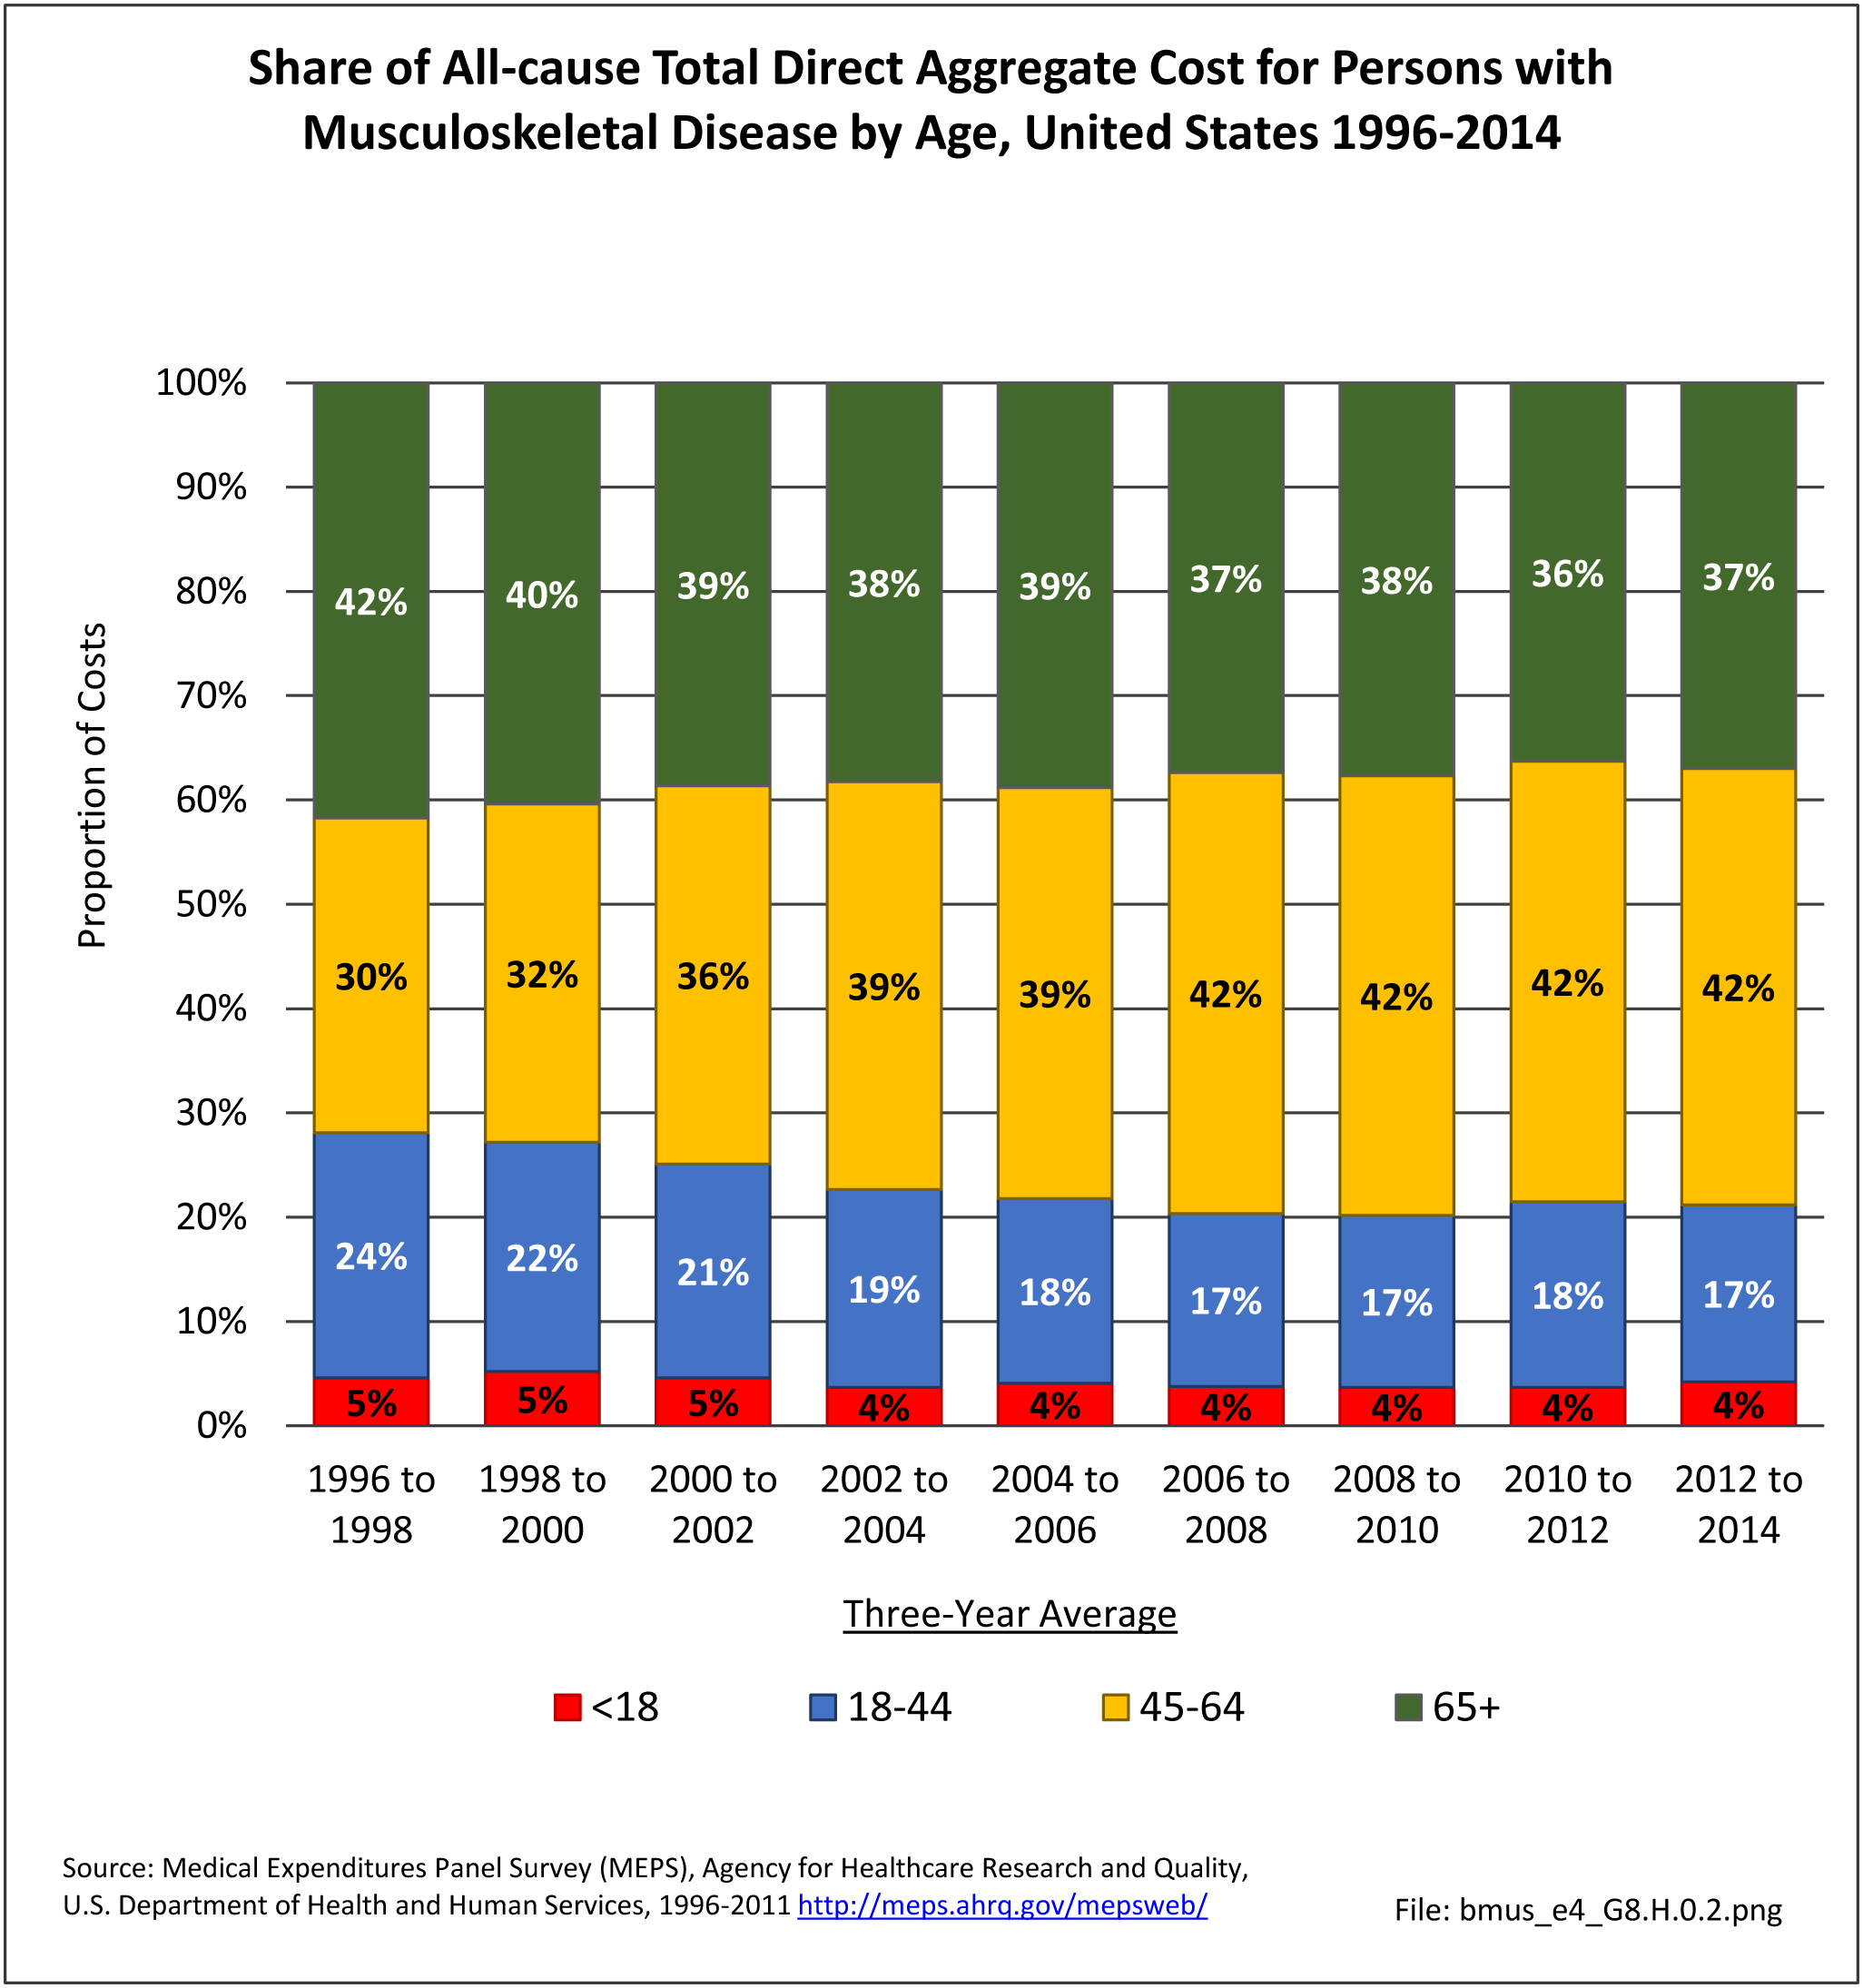
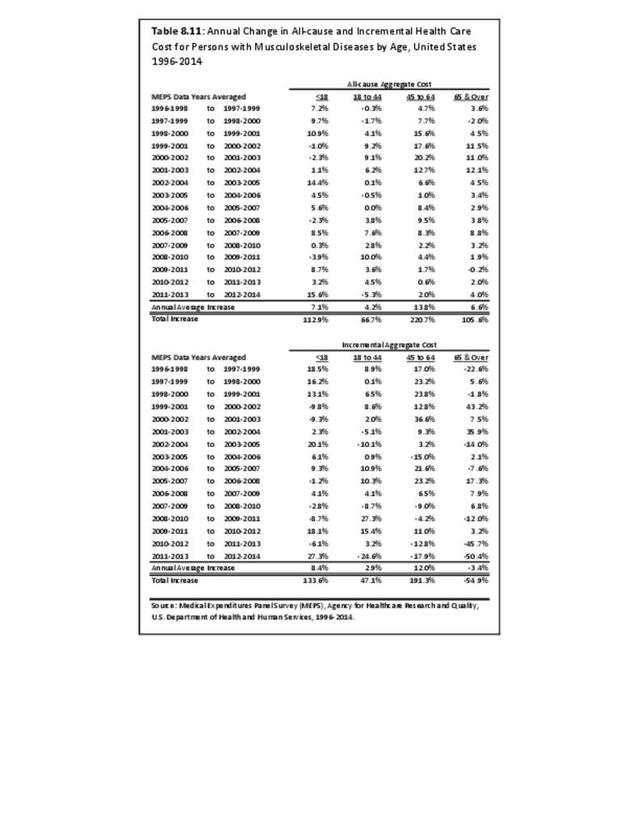
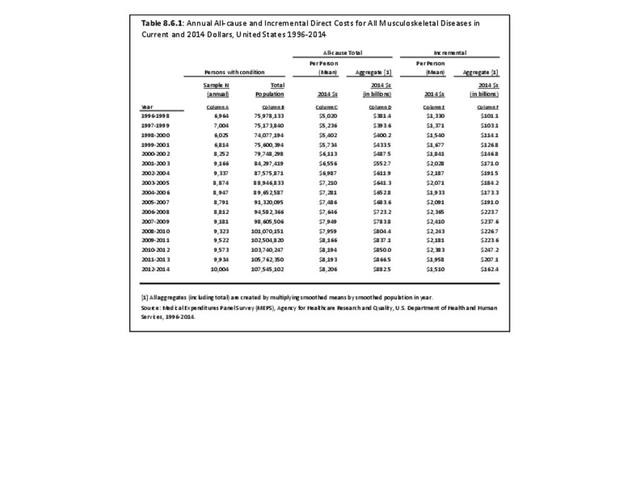
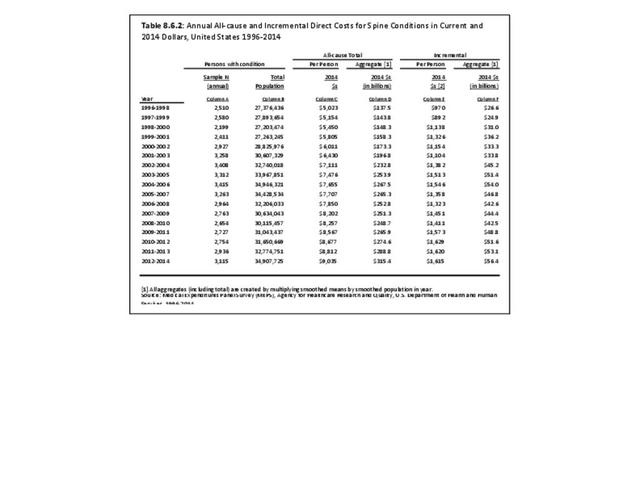
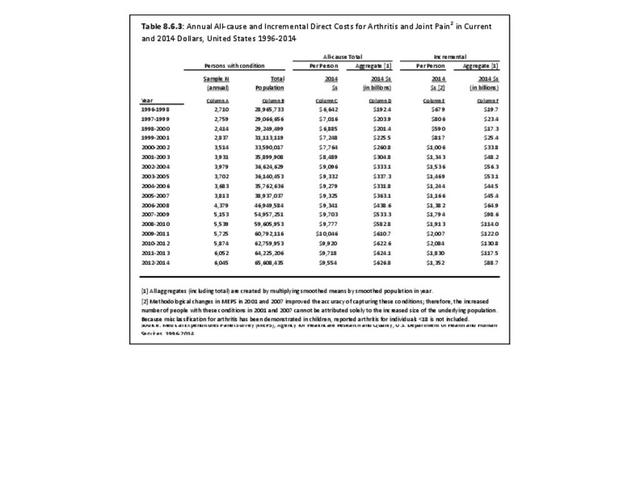
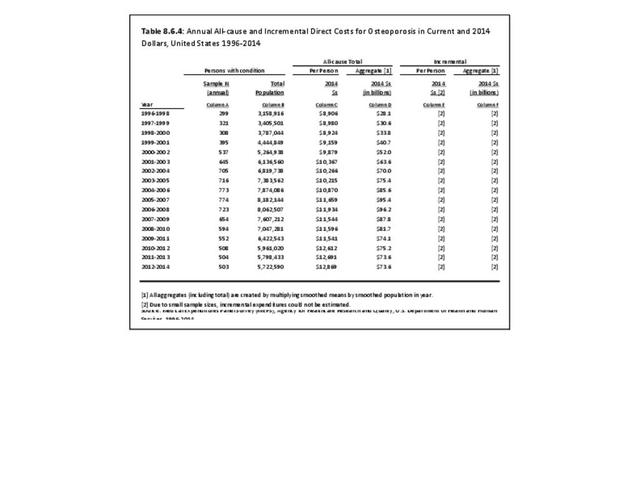
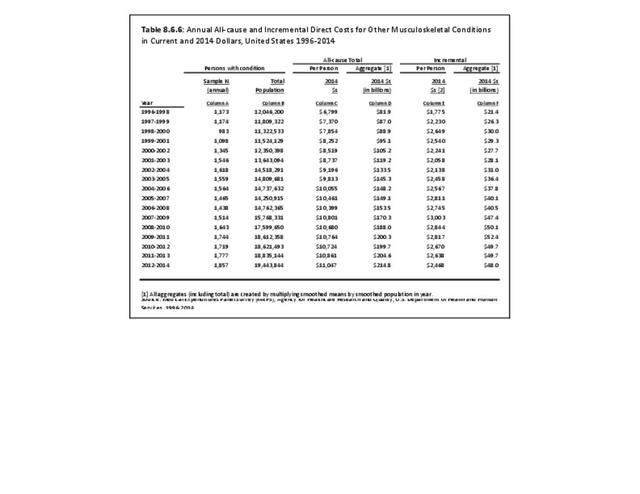
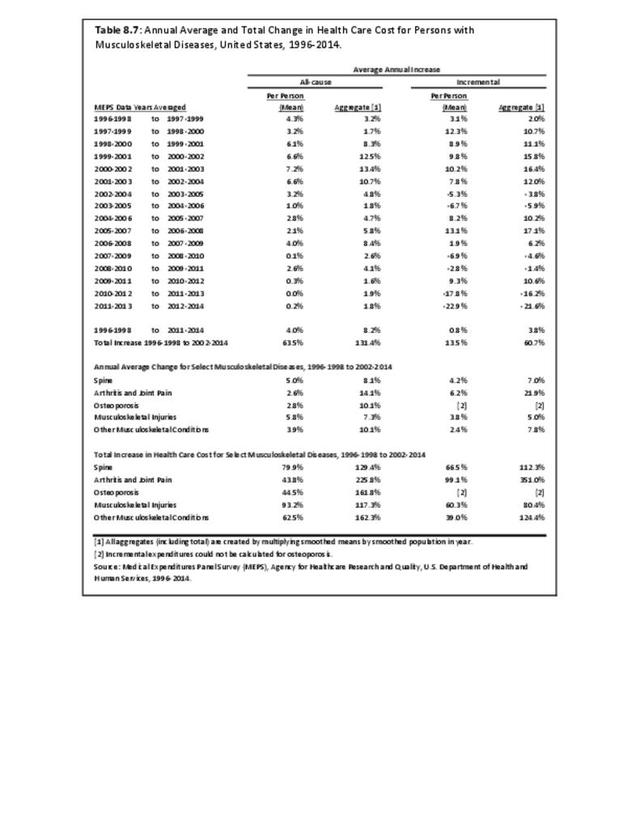
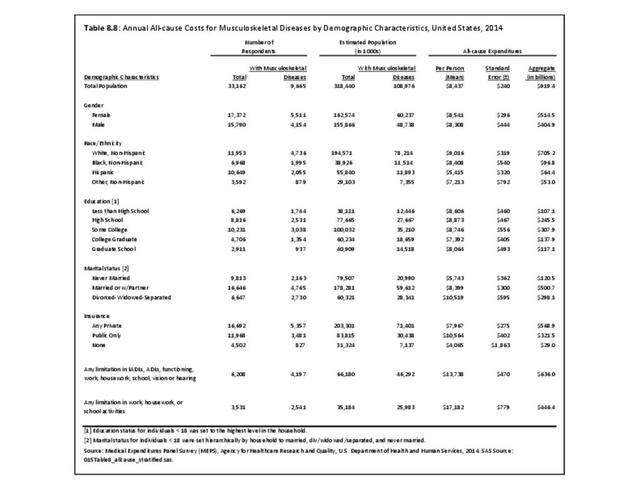
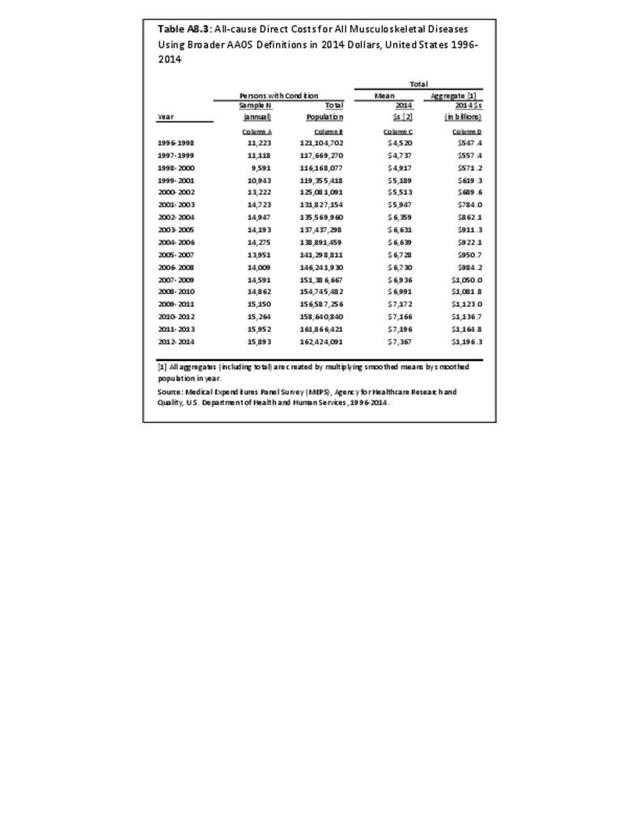
All-cause costs include medical expenditures or lost wages for persons with musculoskeletal disease, regardless of whether those costs are due to the musculoskeletal disease or another medical condition.
Incremental costs are those estimated as attributable to musculoskeletal disease. Essentially, incremental costs are calculated as the difference in costs for those patients with musculoskeletal conditions versus costs simulated for those individuals in the absence of musculoskeletal conditions. The methodology for calculating incremental costs was revised in this edition of BMUS and generally results in estimates that are somewhat lower than those presented in the past. We believe the new methodology more accurately reflects estimated costs.
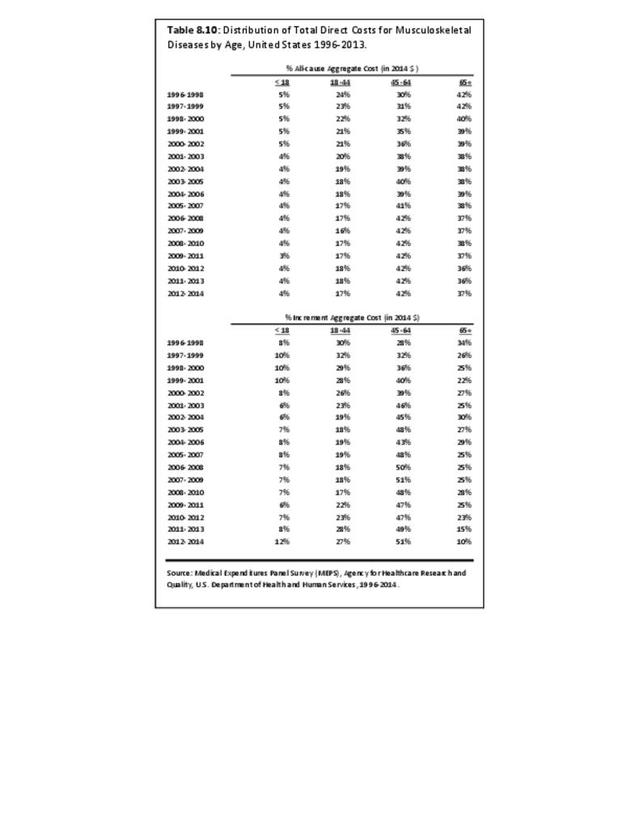
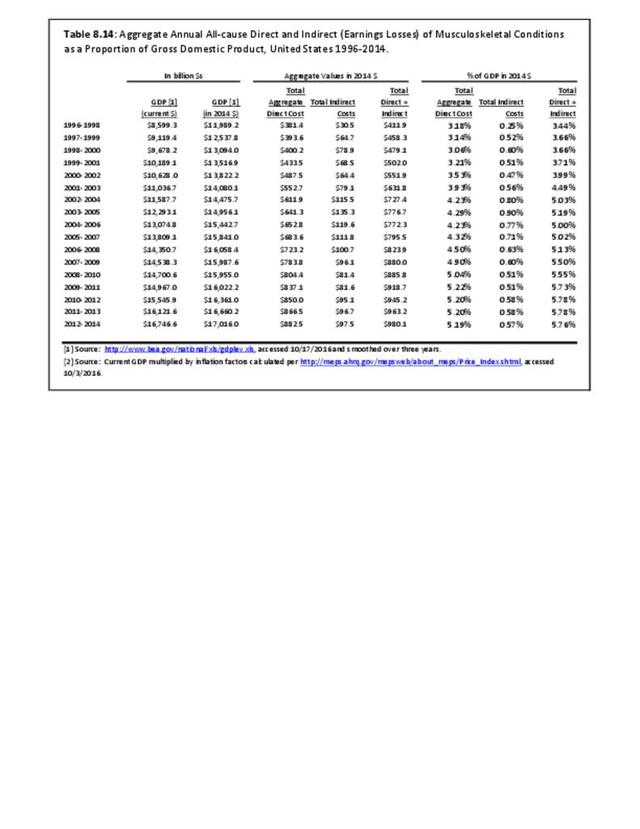
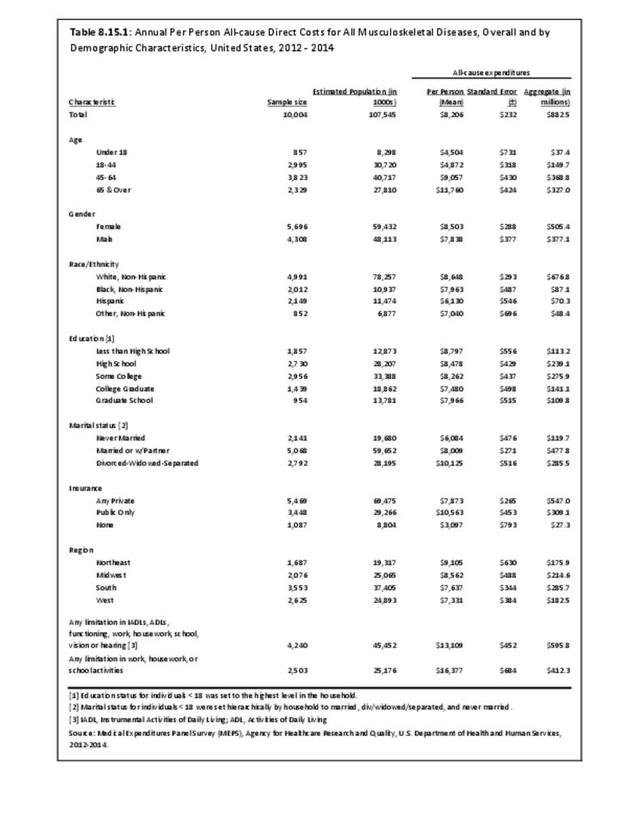
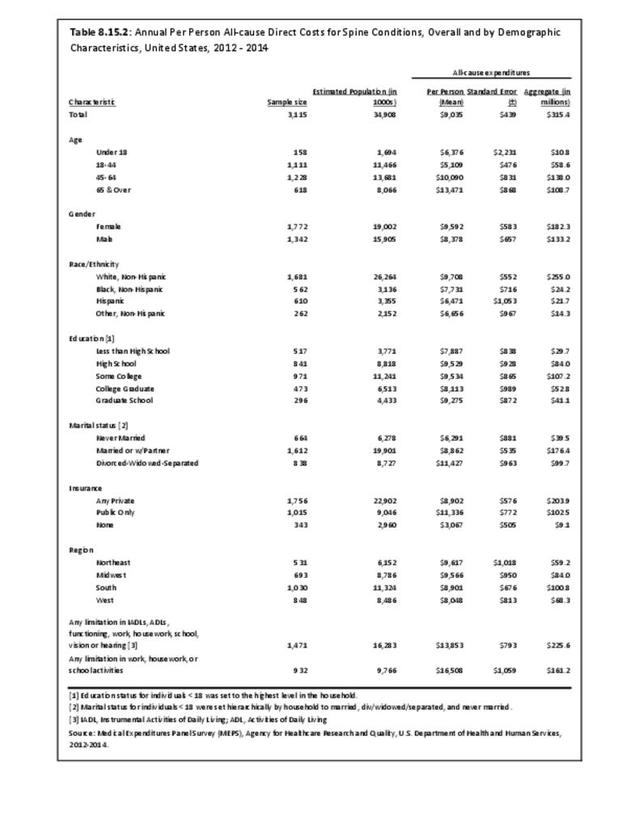
Aggregate costs for both direct and indirect costs are the sum of per-person costs across all individuals with the condition. We provide aggregate all-cause and incremental costs for all musculoskeletal conditions combined, as well as for condition subgroups separately.
The data source for all estimates in this chapter is the US Department of Health and Human Services, Agency for Healthcare Research and Quality Medical Expenditures Panel Survey (MEPS), using "Appropriate Price Indices for Analysis of Health Care Expenditures or Income Across Multiple Years", from the MEPS. The MEPS is a set of large-scale surveys of families and individuals, their medical providers, and employers across the United States. National estimates are calculated by using sampling weights supplied with the survey files. MEPS is the most complete source of data on the cost and use of health care and health insurance coverage currently available.
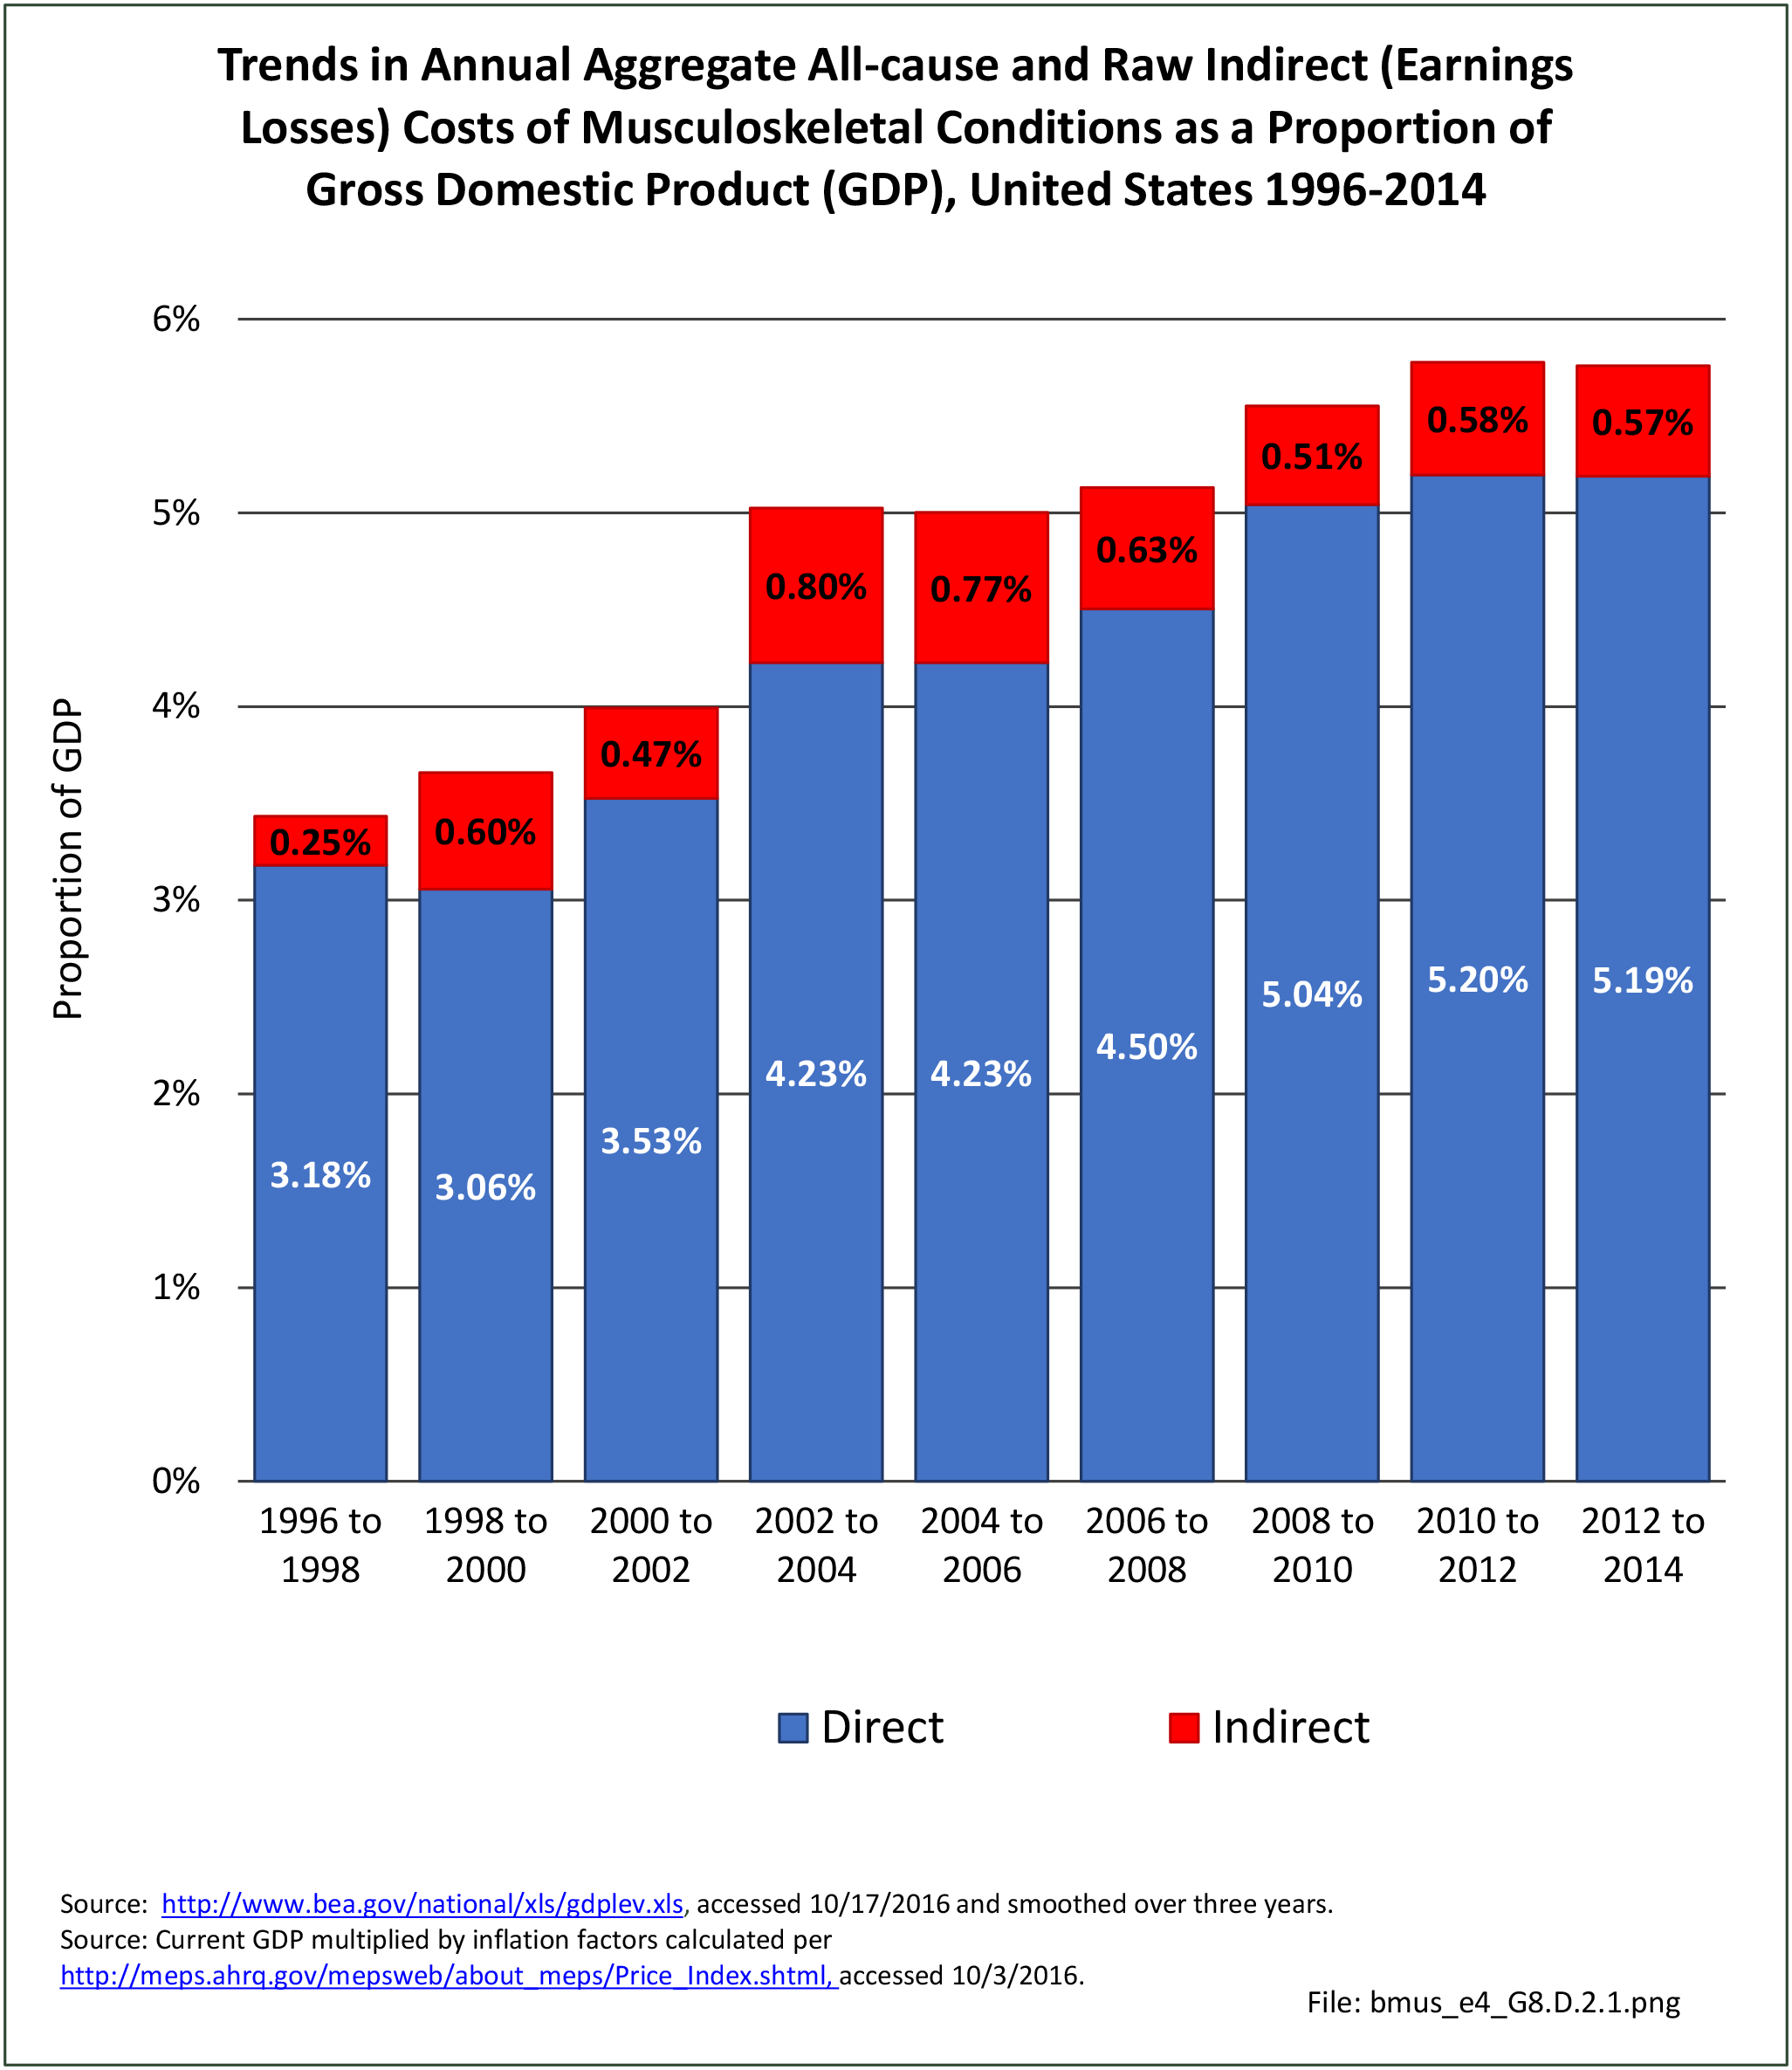
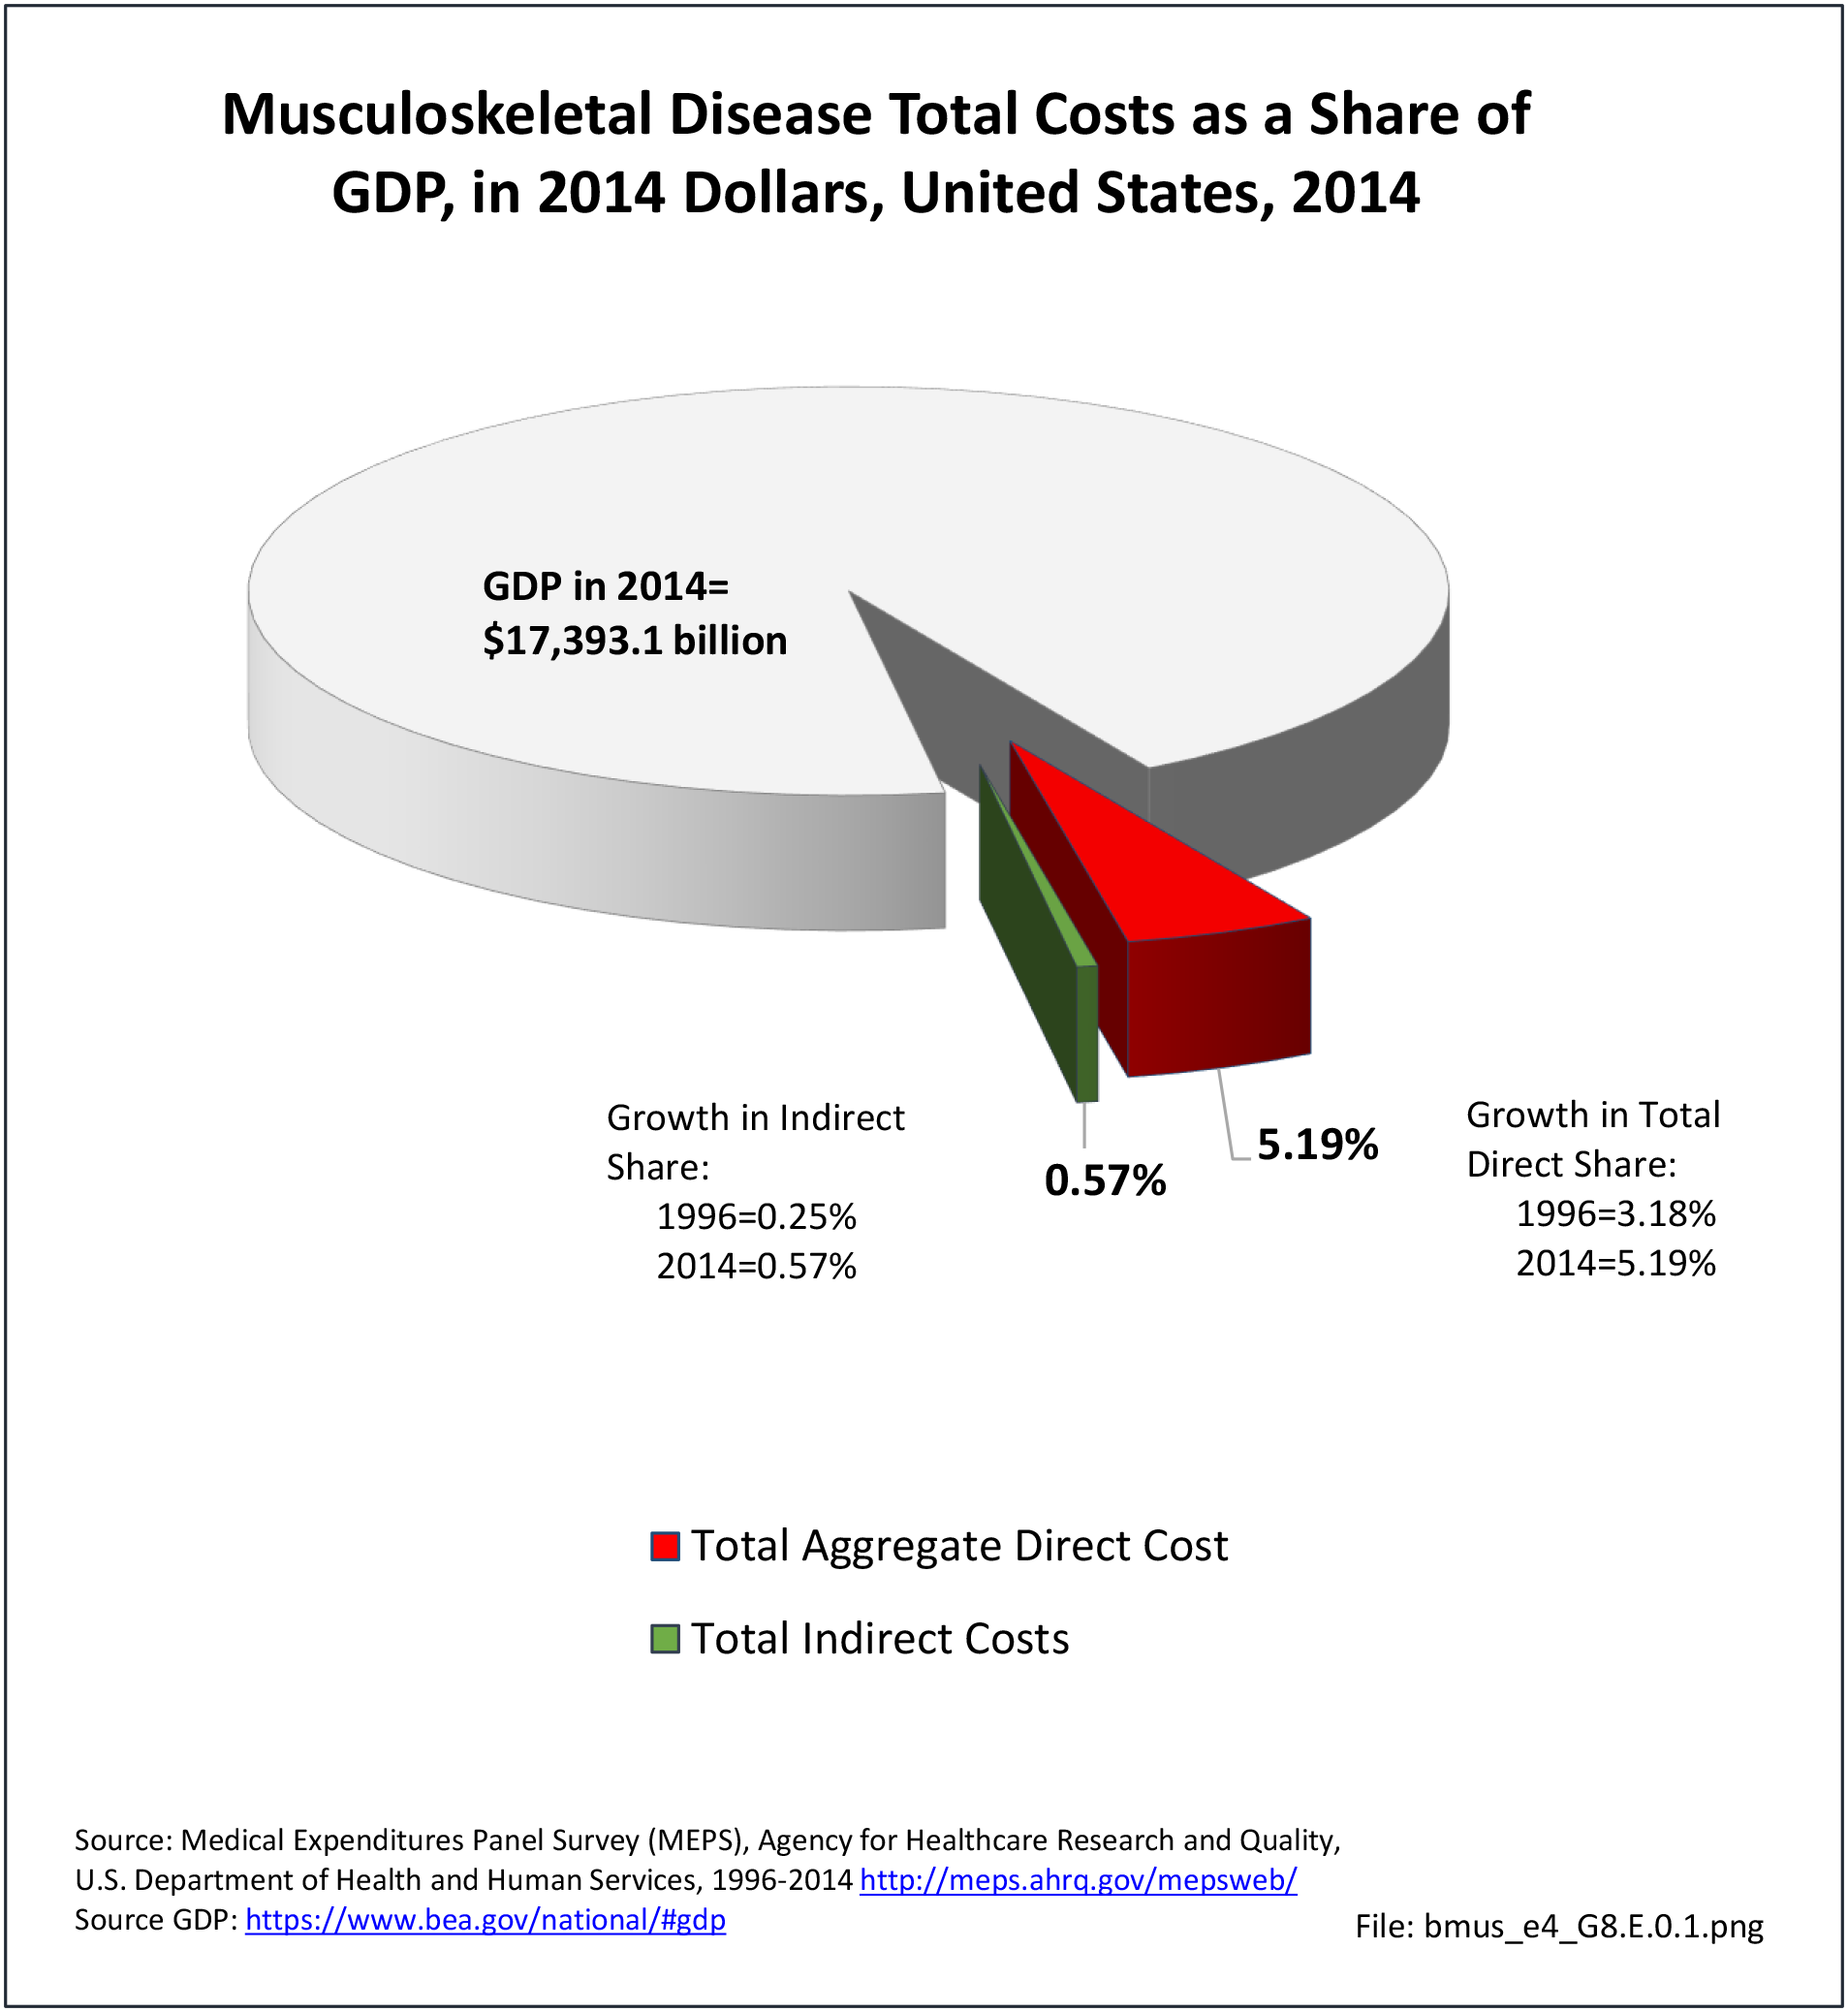
To demonstrate the effect of musculoskeletal conditions on the US economy, aggregate costs as a share of the Gross Domestic Product (GDP) are shown. The GDP is the market value of all goods and services produced in the United States. Because it is released annually, it can be used to measure changes in the size of the economy over time. The GDP is the best known of the national income and product accounts (NIPA), and is often used to create a comparison measure across years.
Edition:
- Fourth Edition