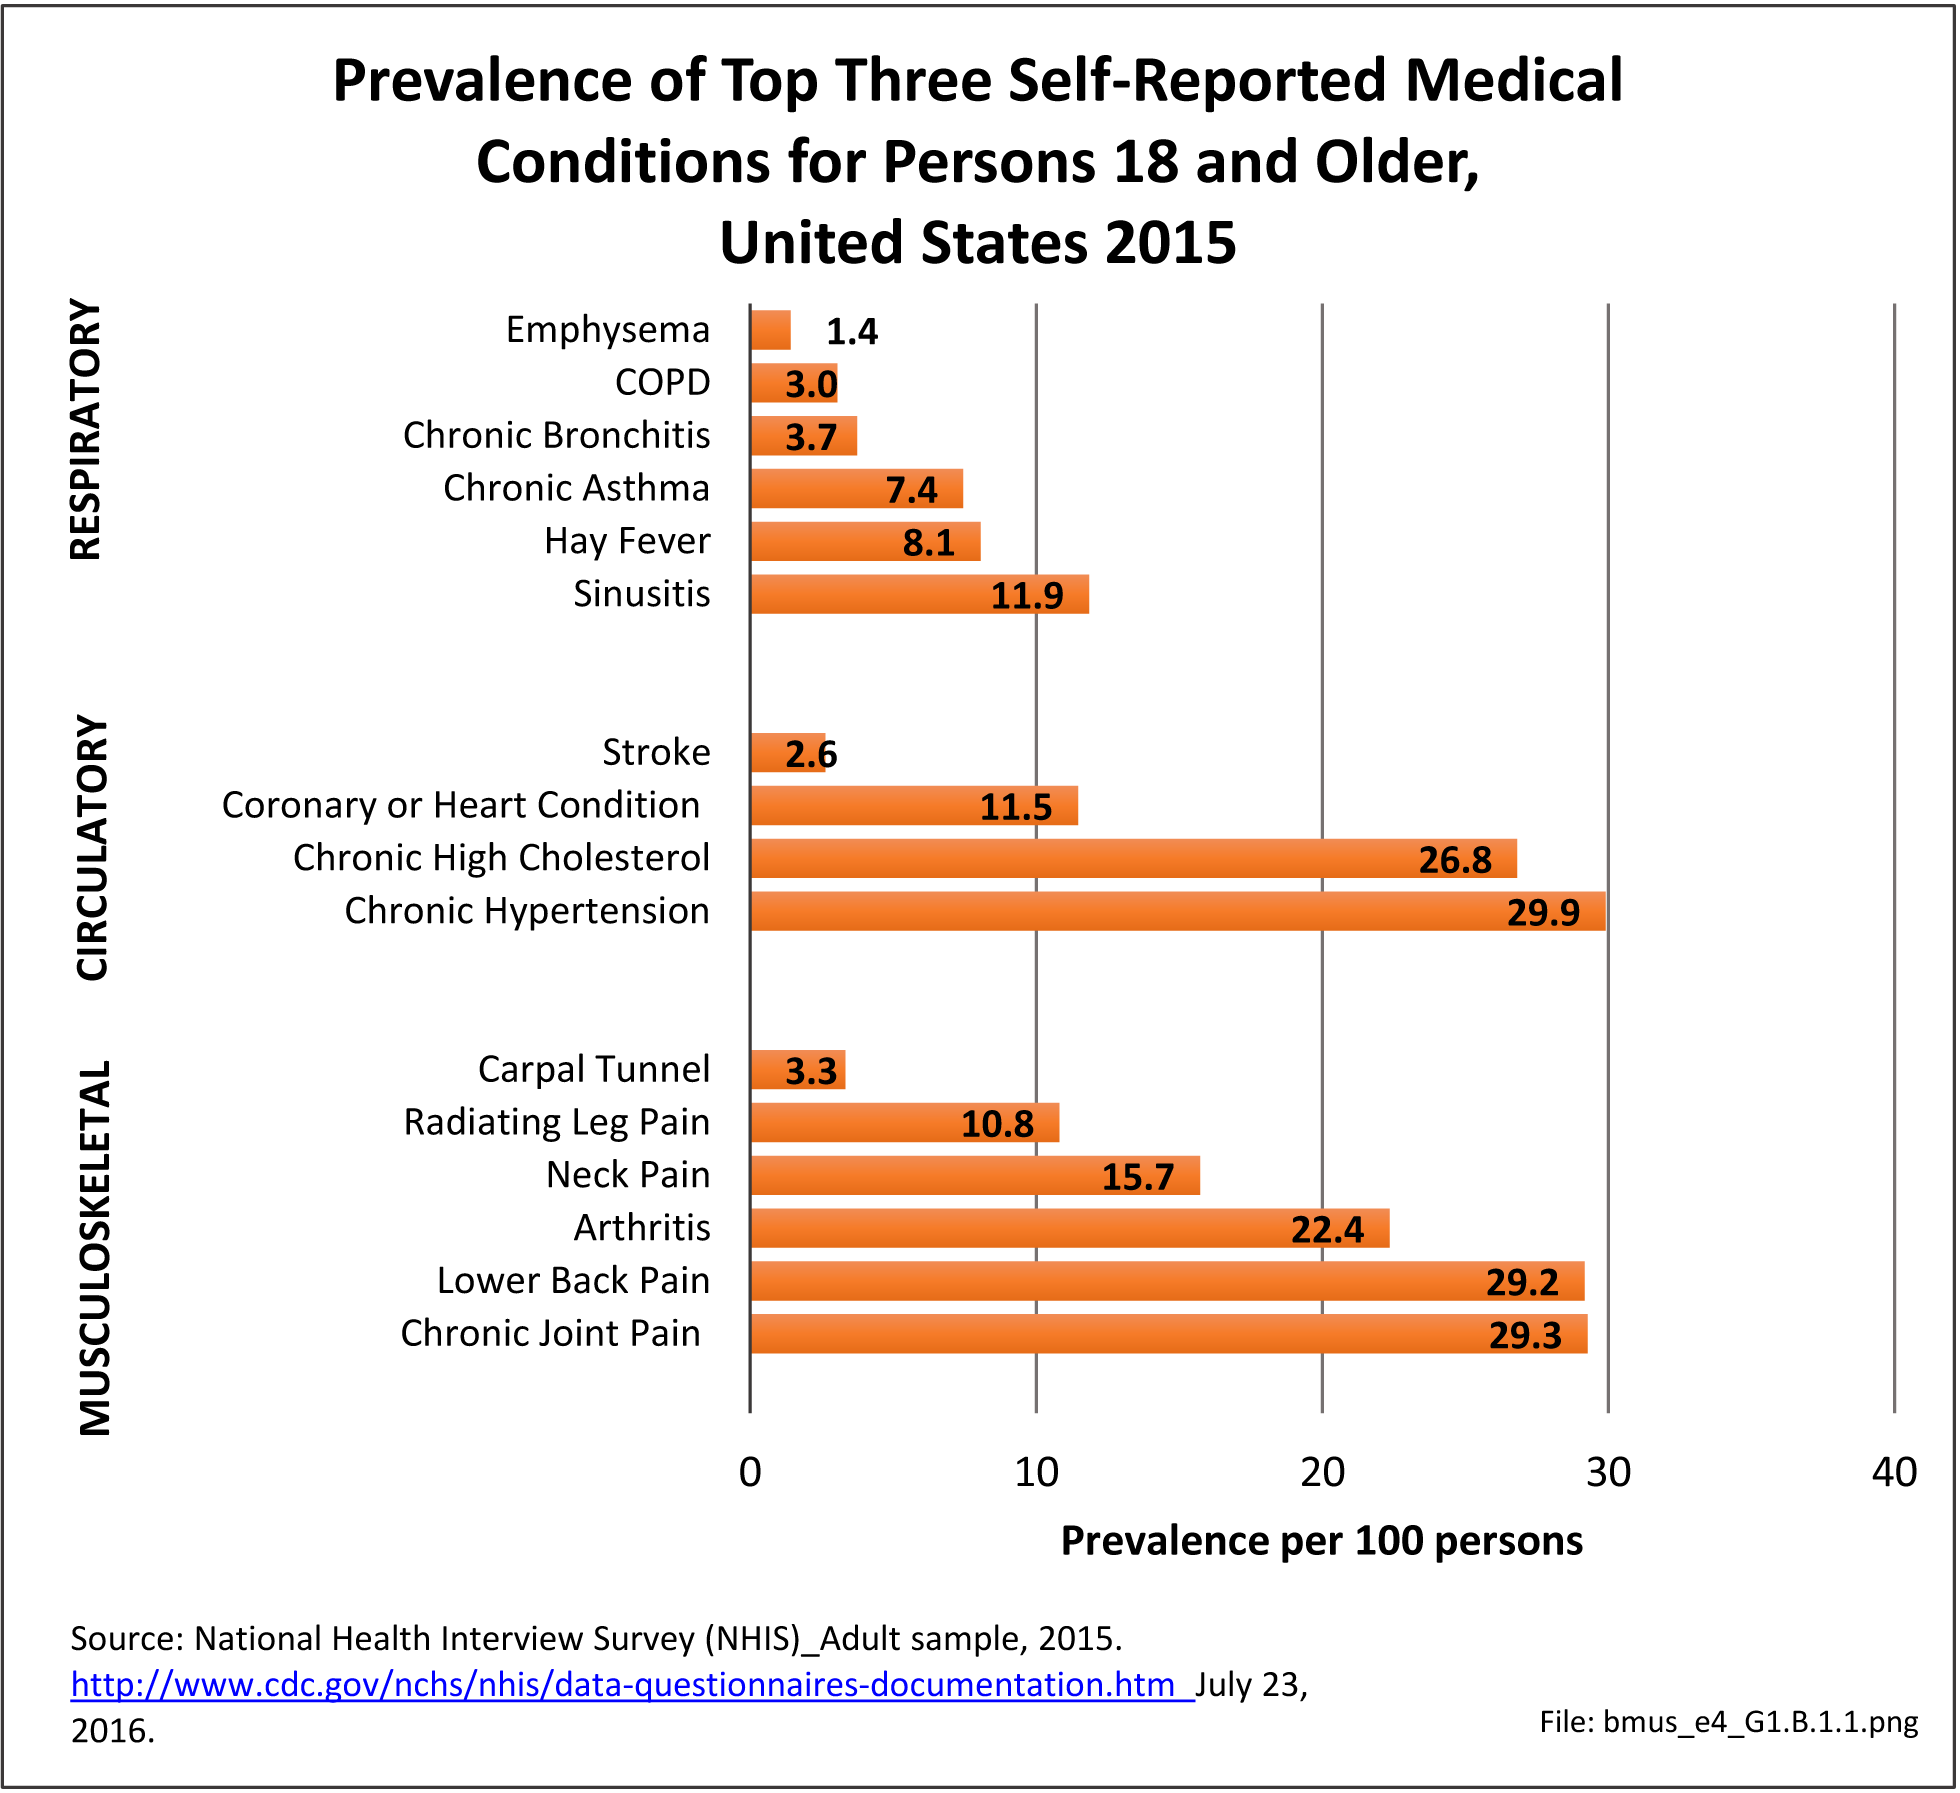
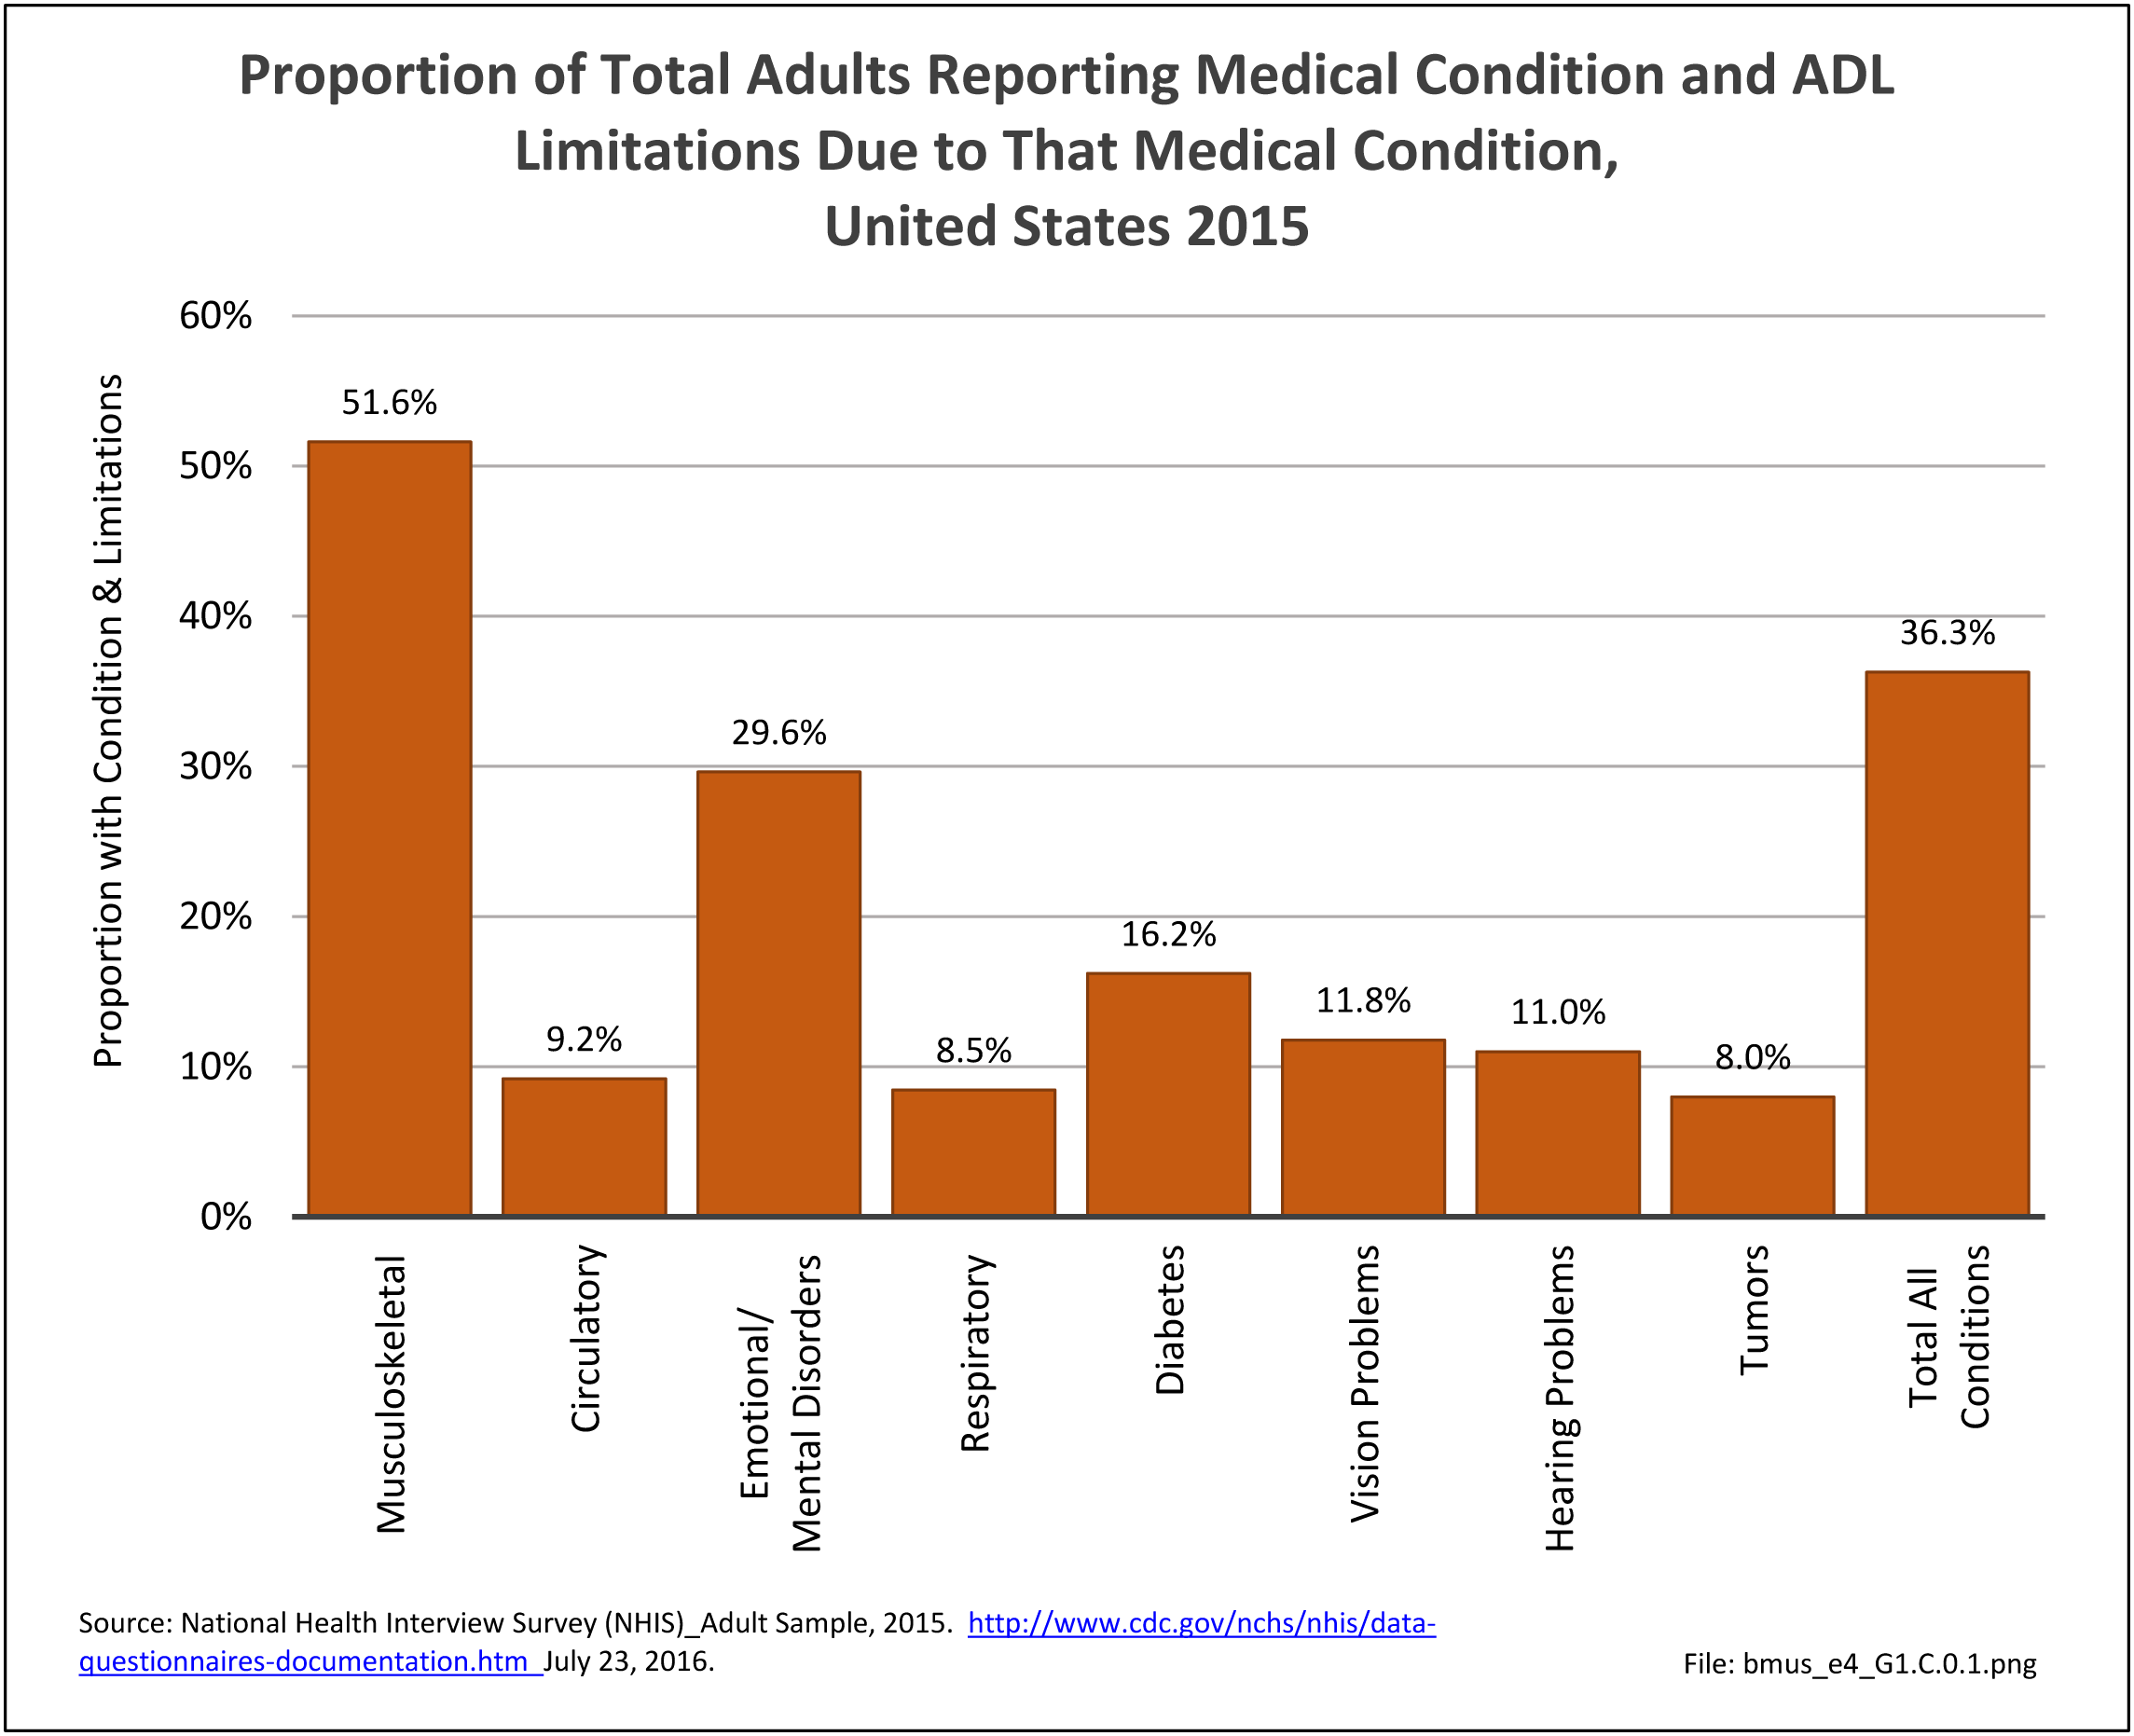
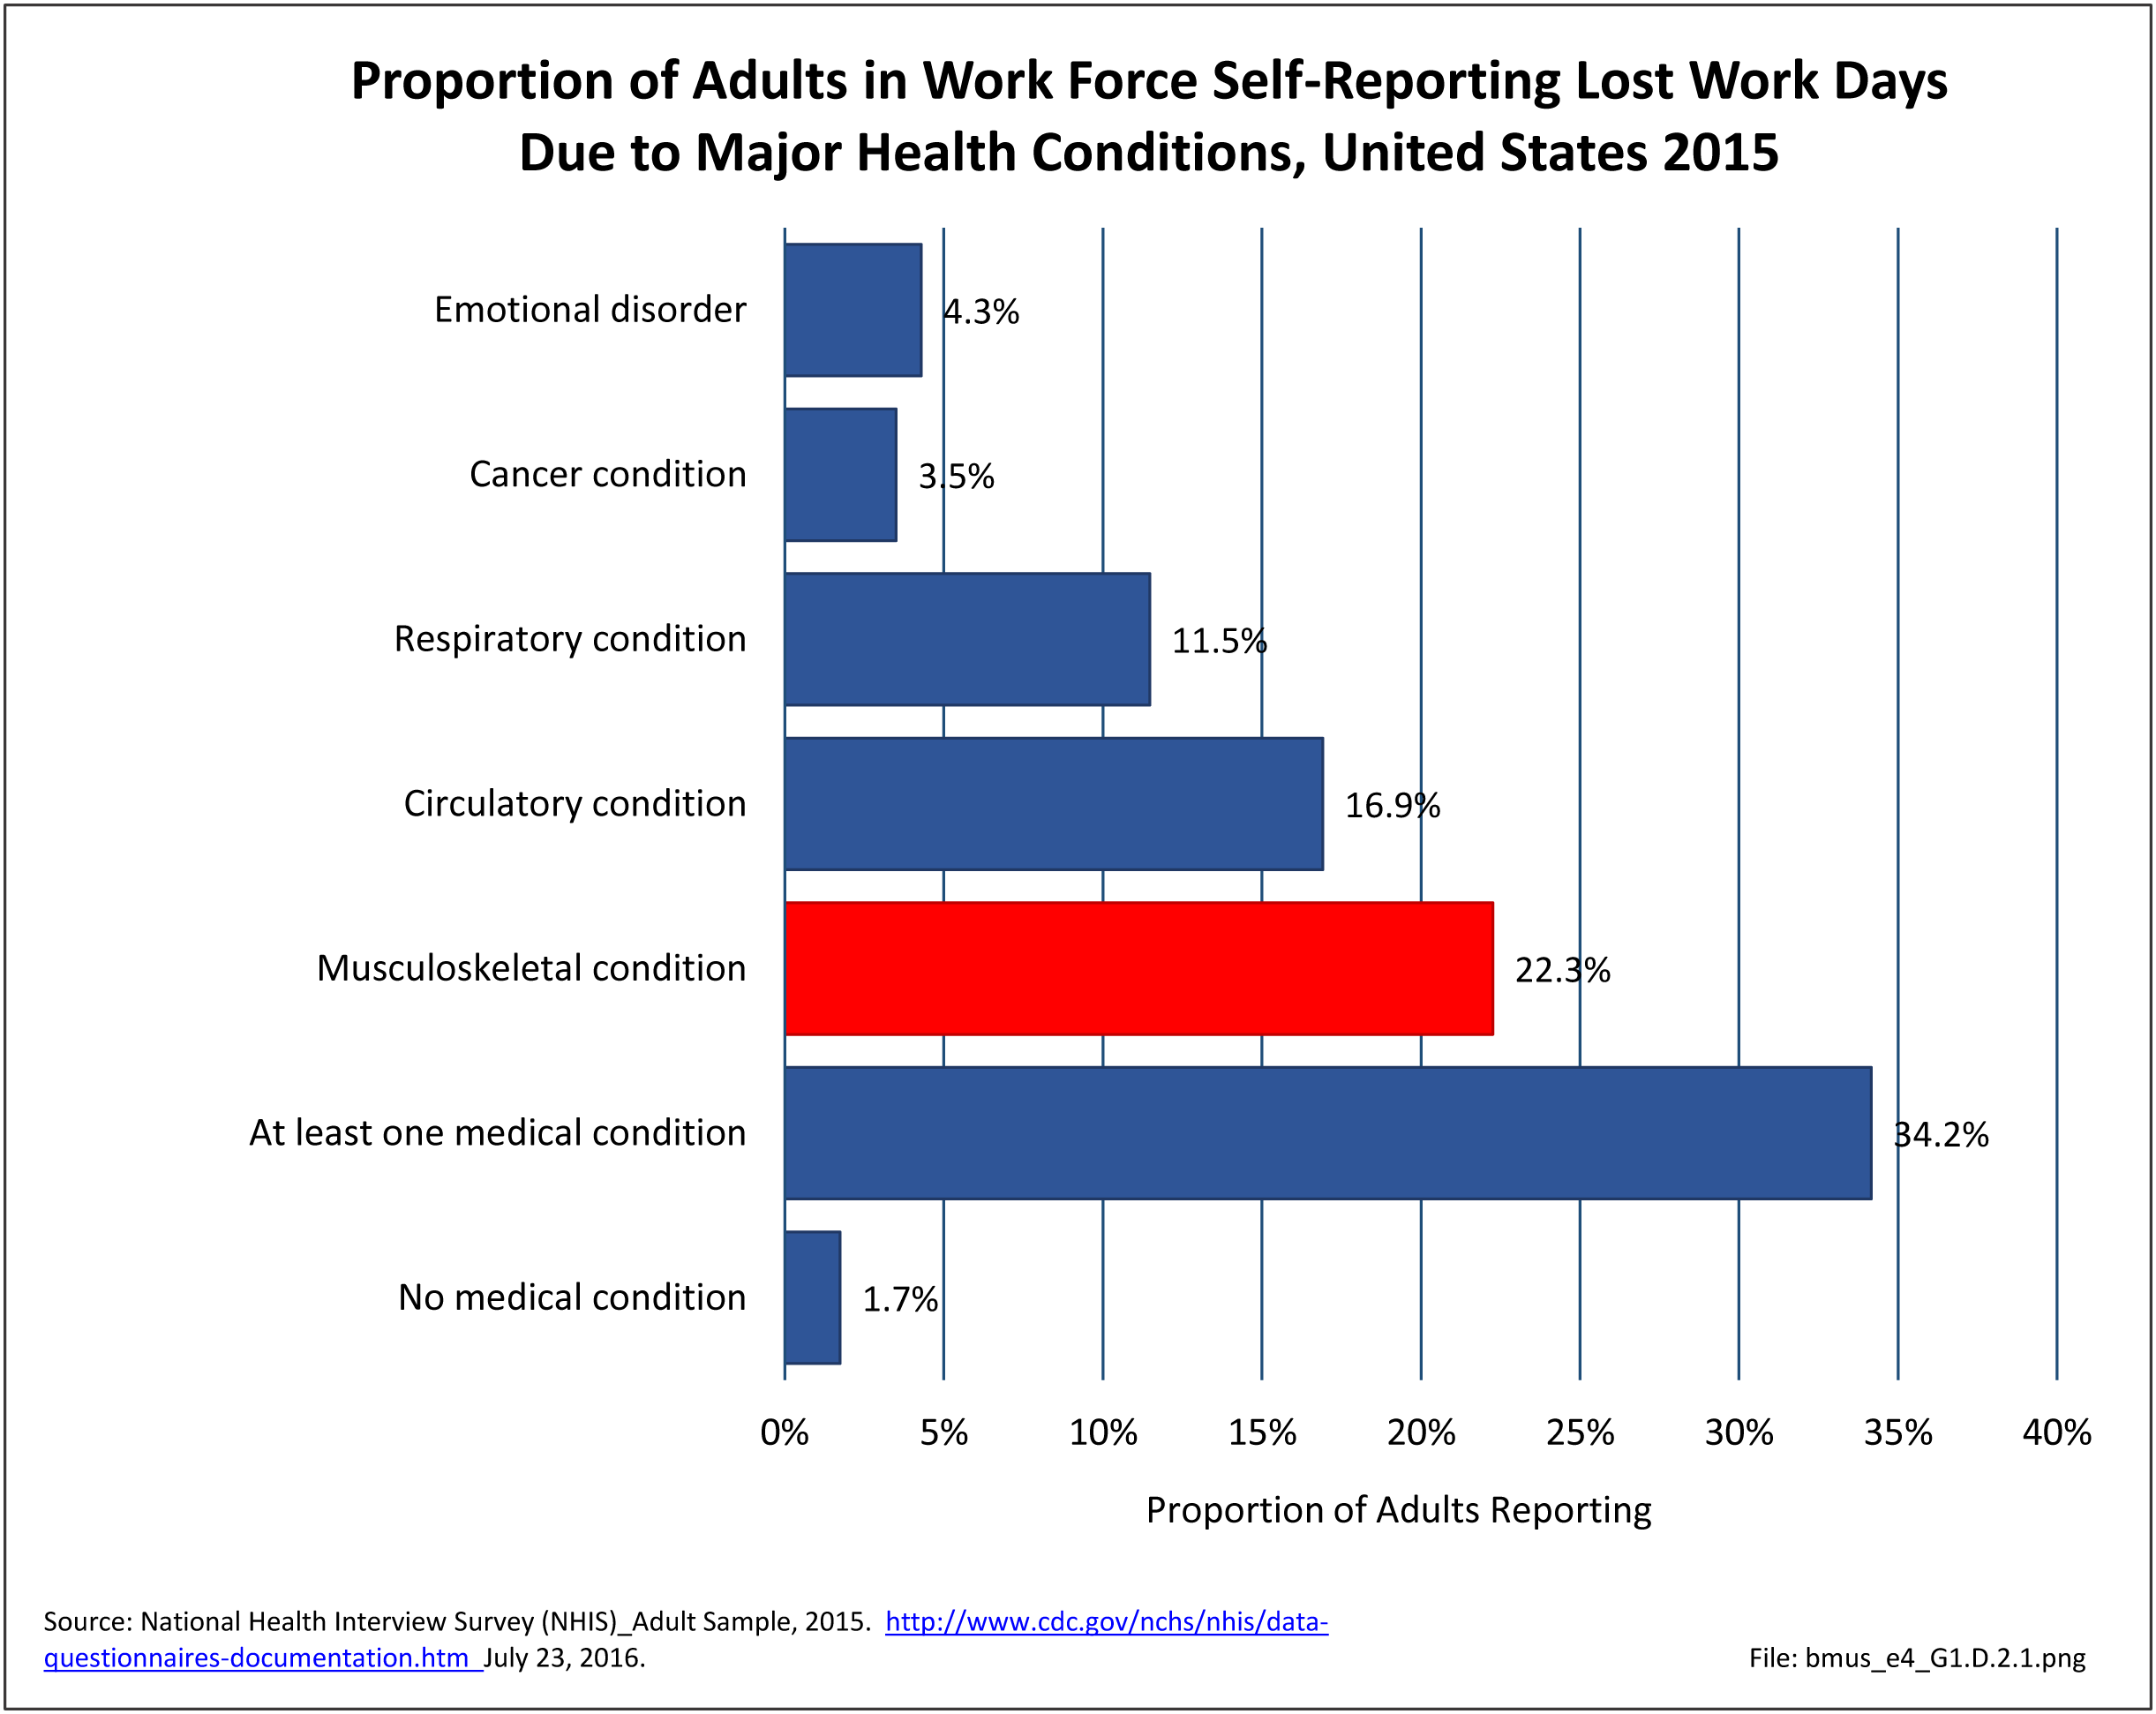
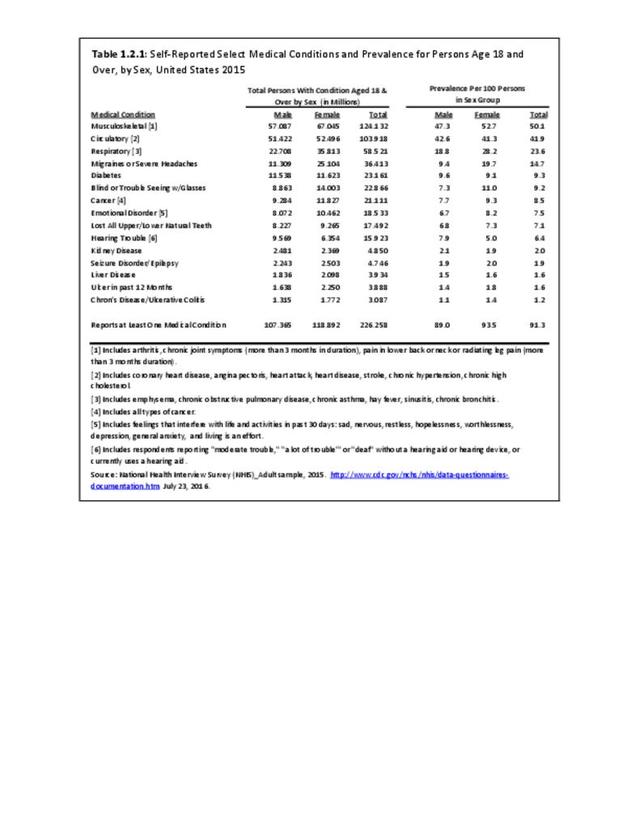
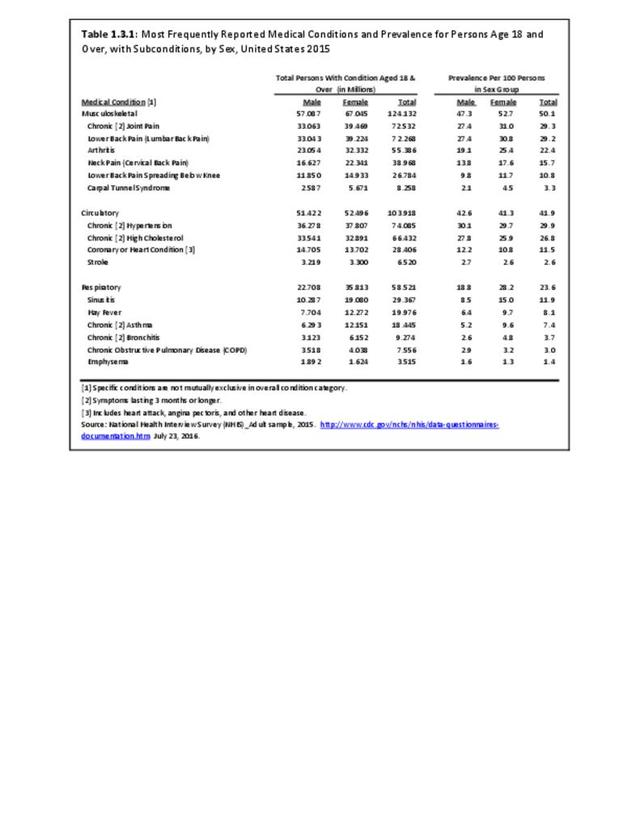
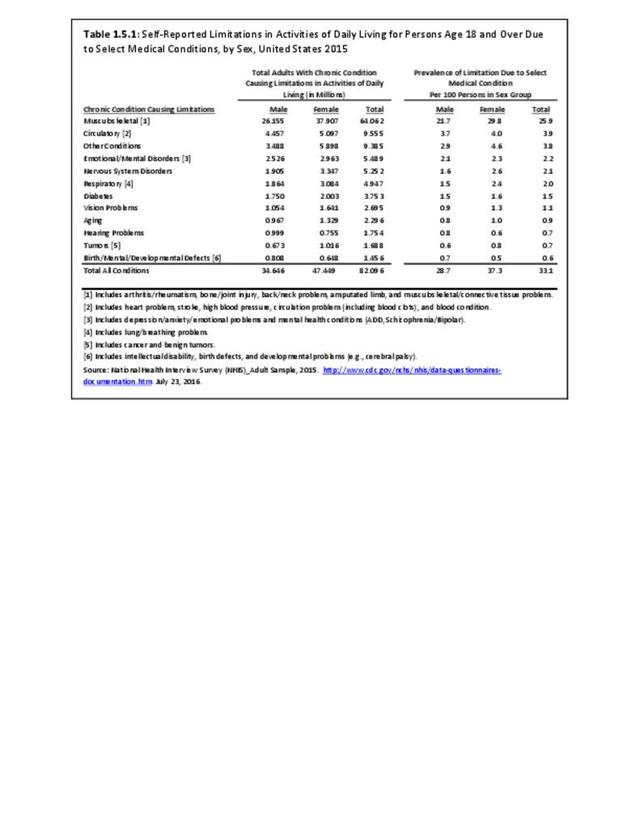
In the National Health Interview Survey (NHIS) in 2015, an annual survey of self-reported health conditions used throughout this chapter to highlight chronic health conditions of the US population, musculoskeletal medical conditions were reported by 124.1 million adults in the United States, representing one in two persons age 18 and over of the estimated 2015 population. The rate of chronic musculoskeletal conditions found in the adult population is greater than that of chronic circulatory conditions, which include coronary and heart conditions, and twice that of all chronic respiratory conditions, the next two most common health conditions. While the rate of circulatory conditions is approaching the rate of musculoskeletal conditions, the majority of circulatory conditions involve high blood pressure and high cholesterol, both of which are controlled medically and do not necessarily lead to the high levels of disability and pain found in arthritis and back pain. (Reference Tables 1.2.1 PDF CSV and 1.3.1 PDF CSV)
Demographic Differences
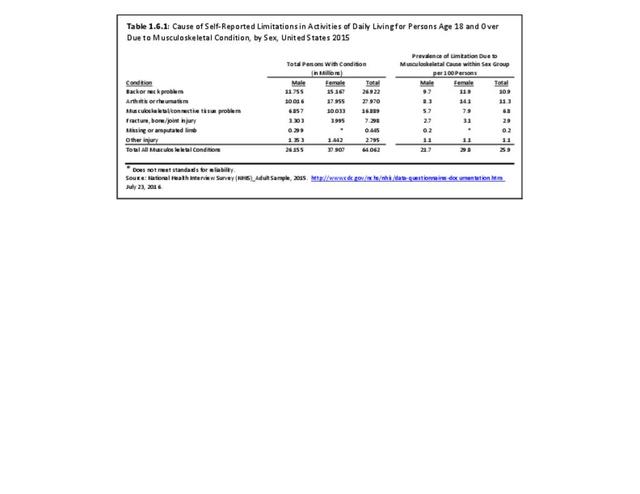
Sex
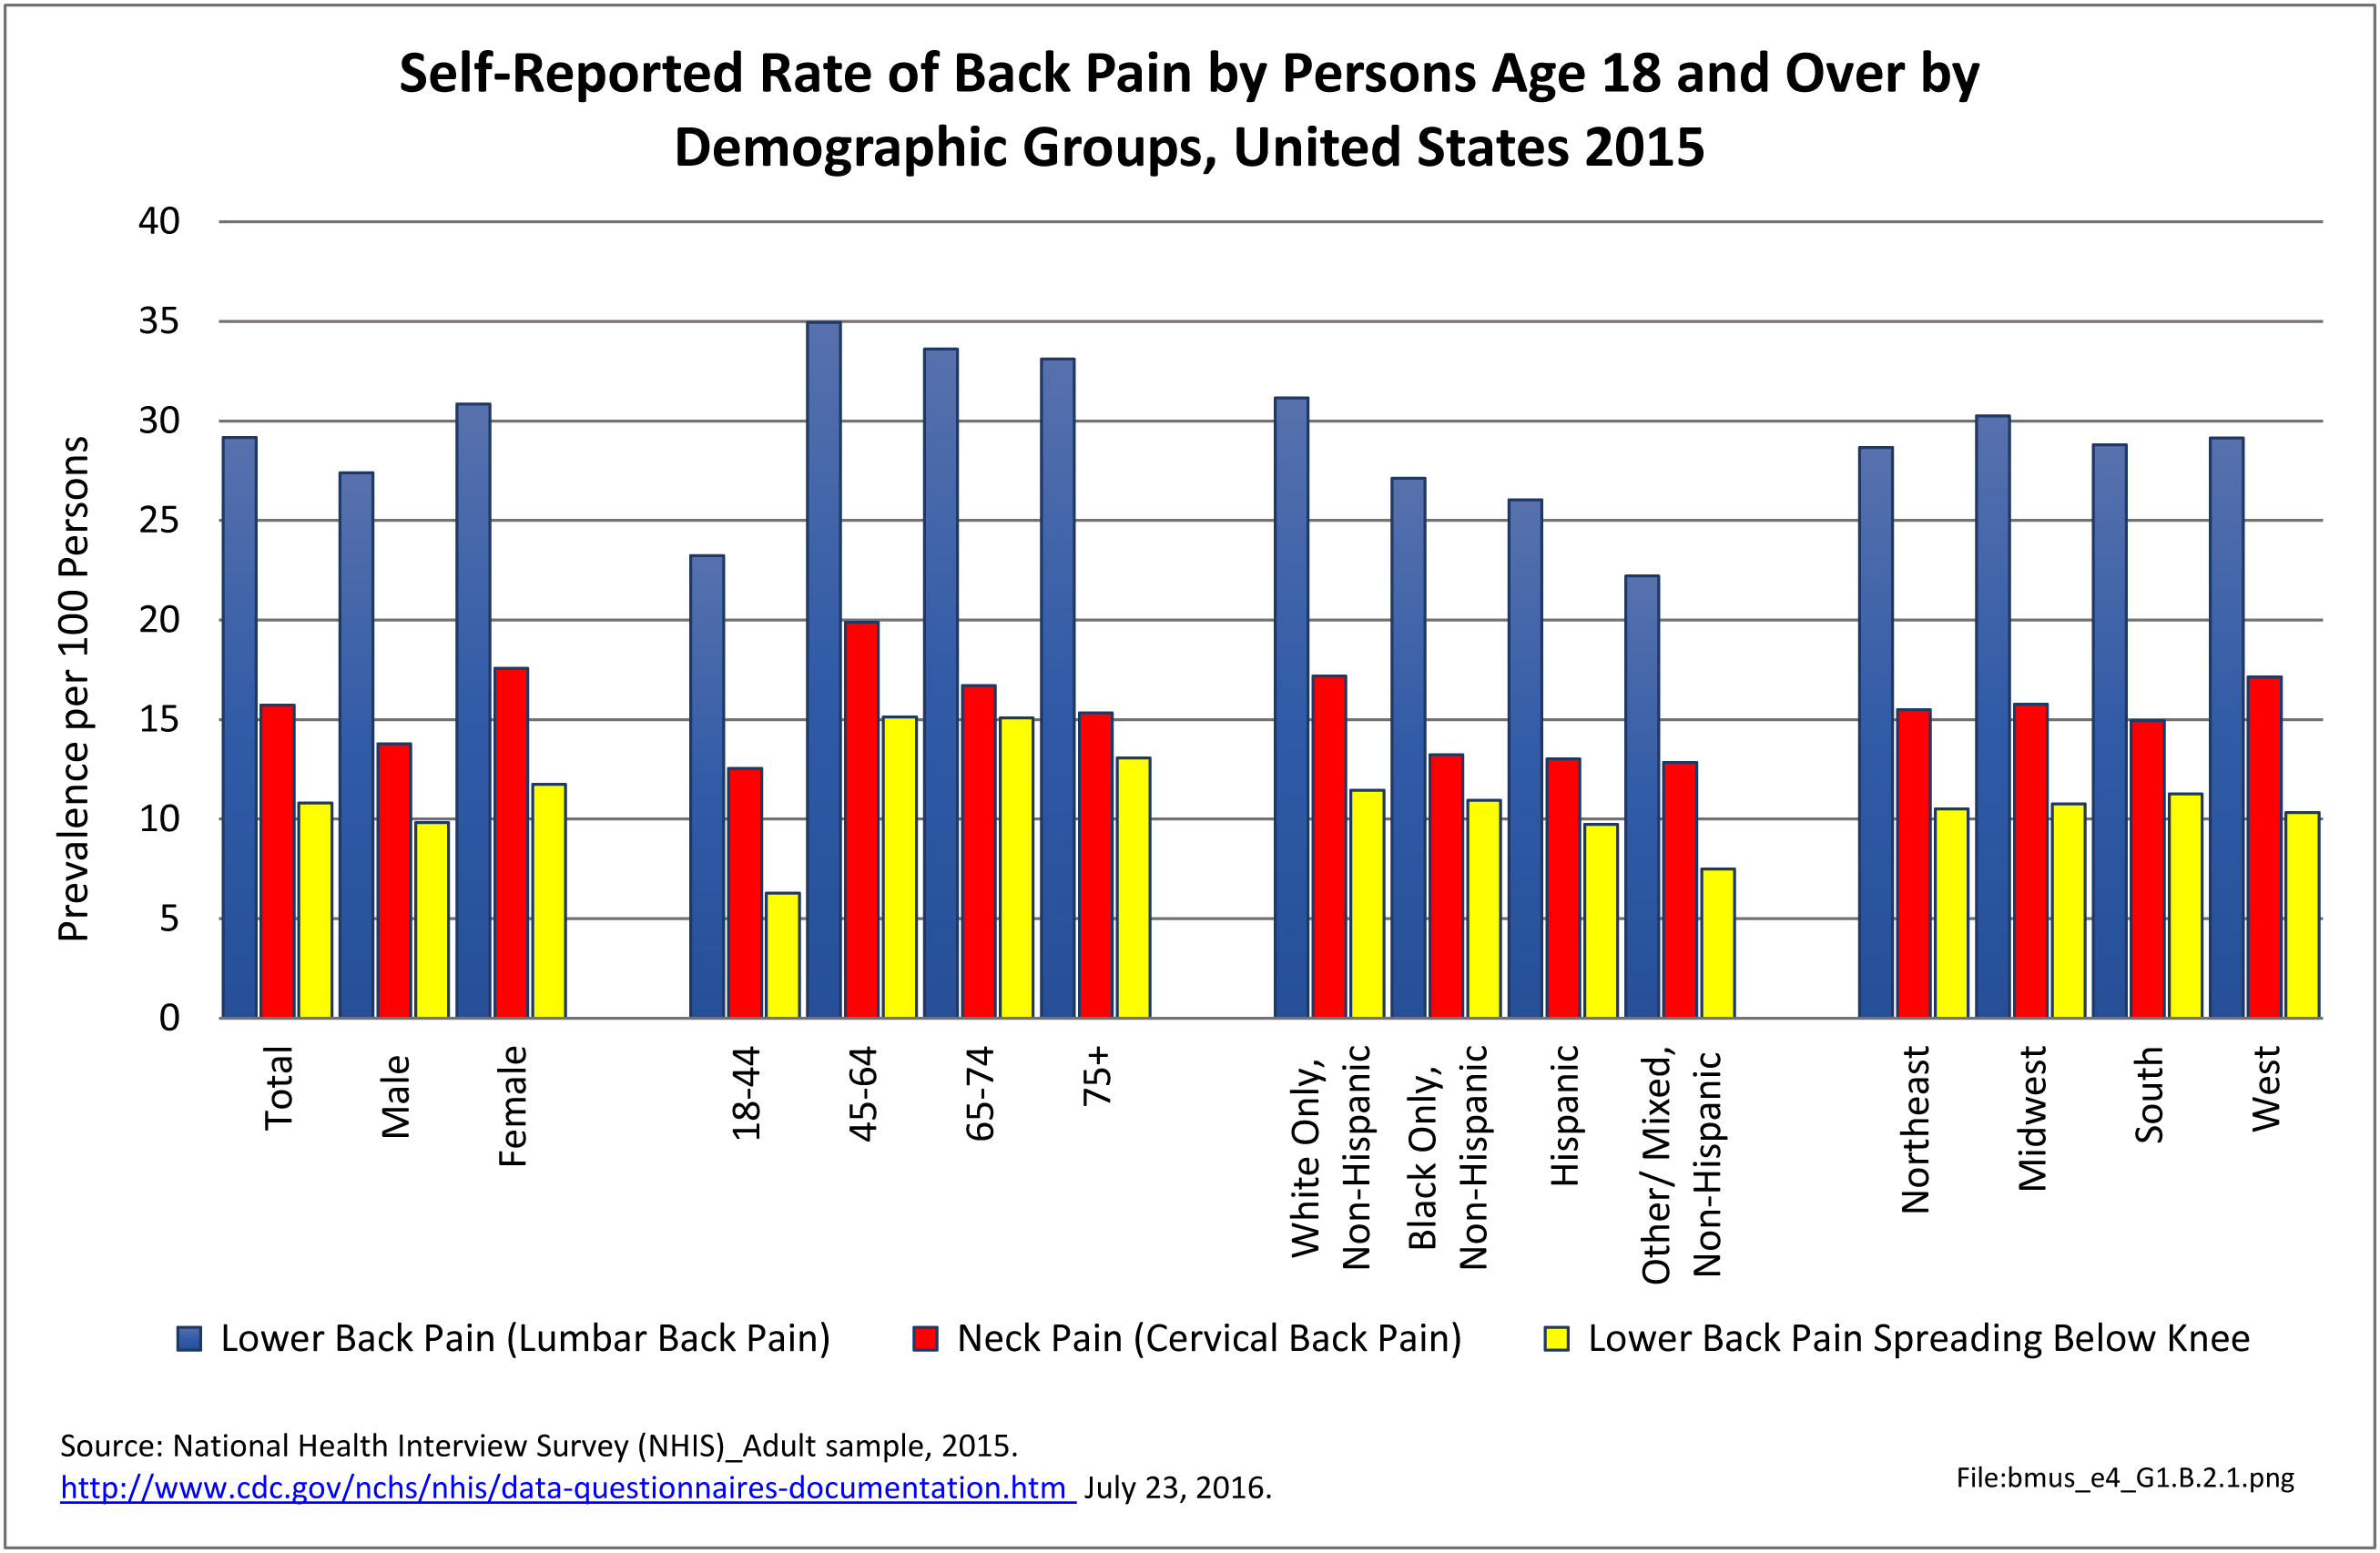
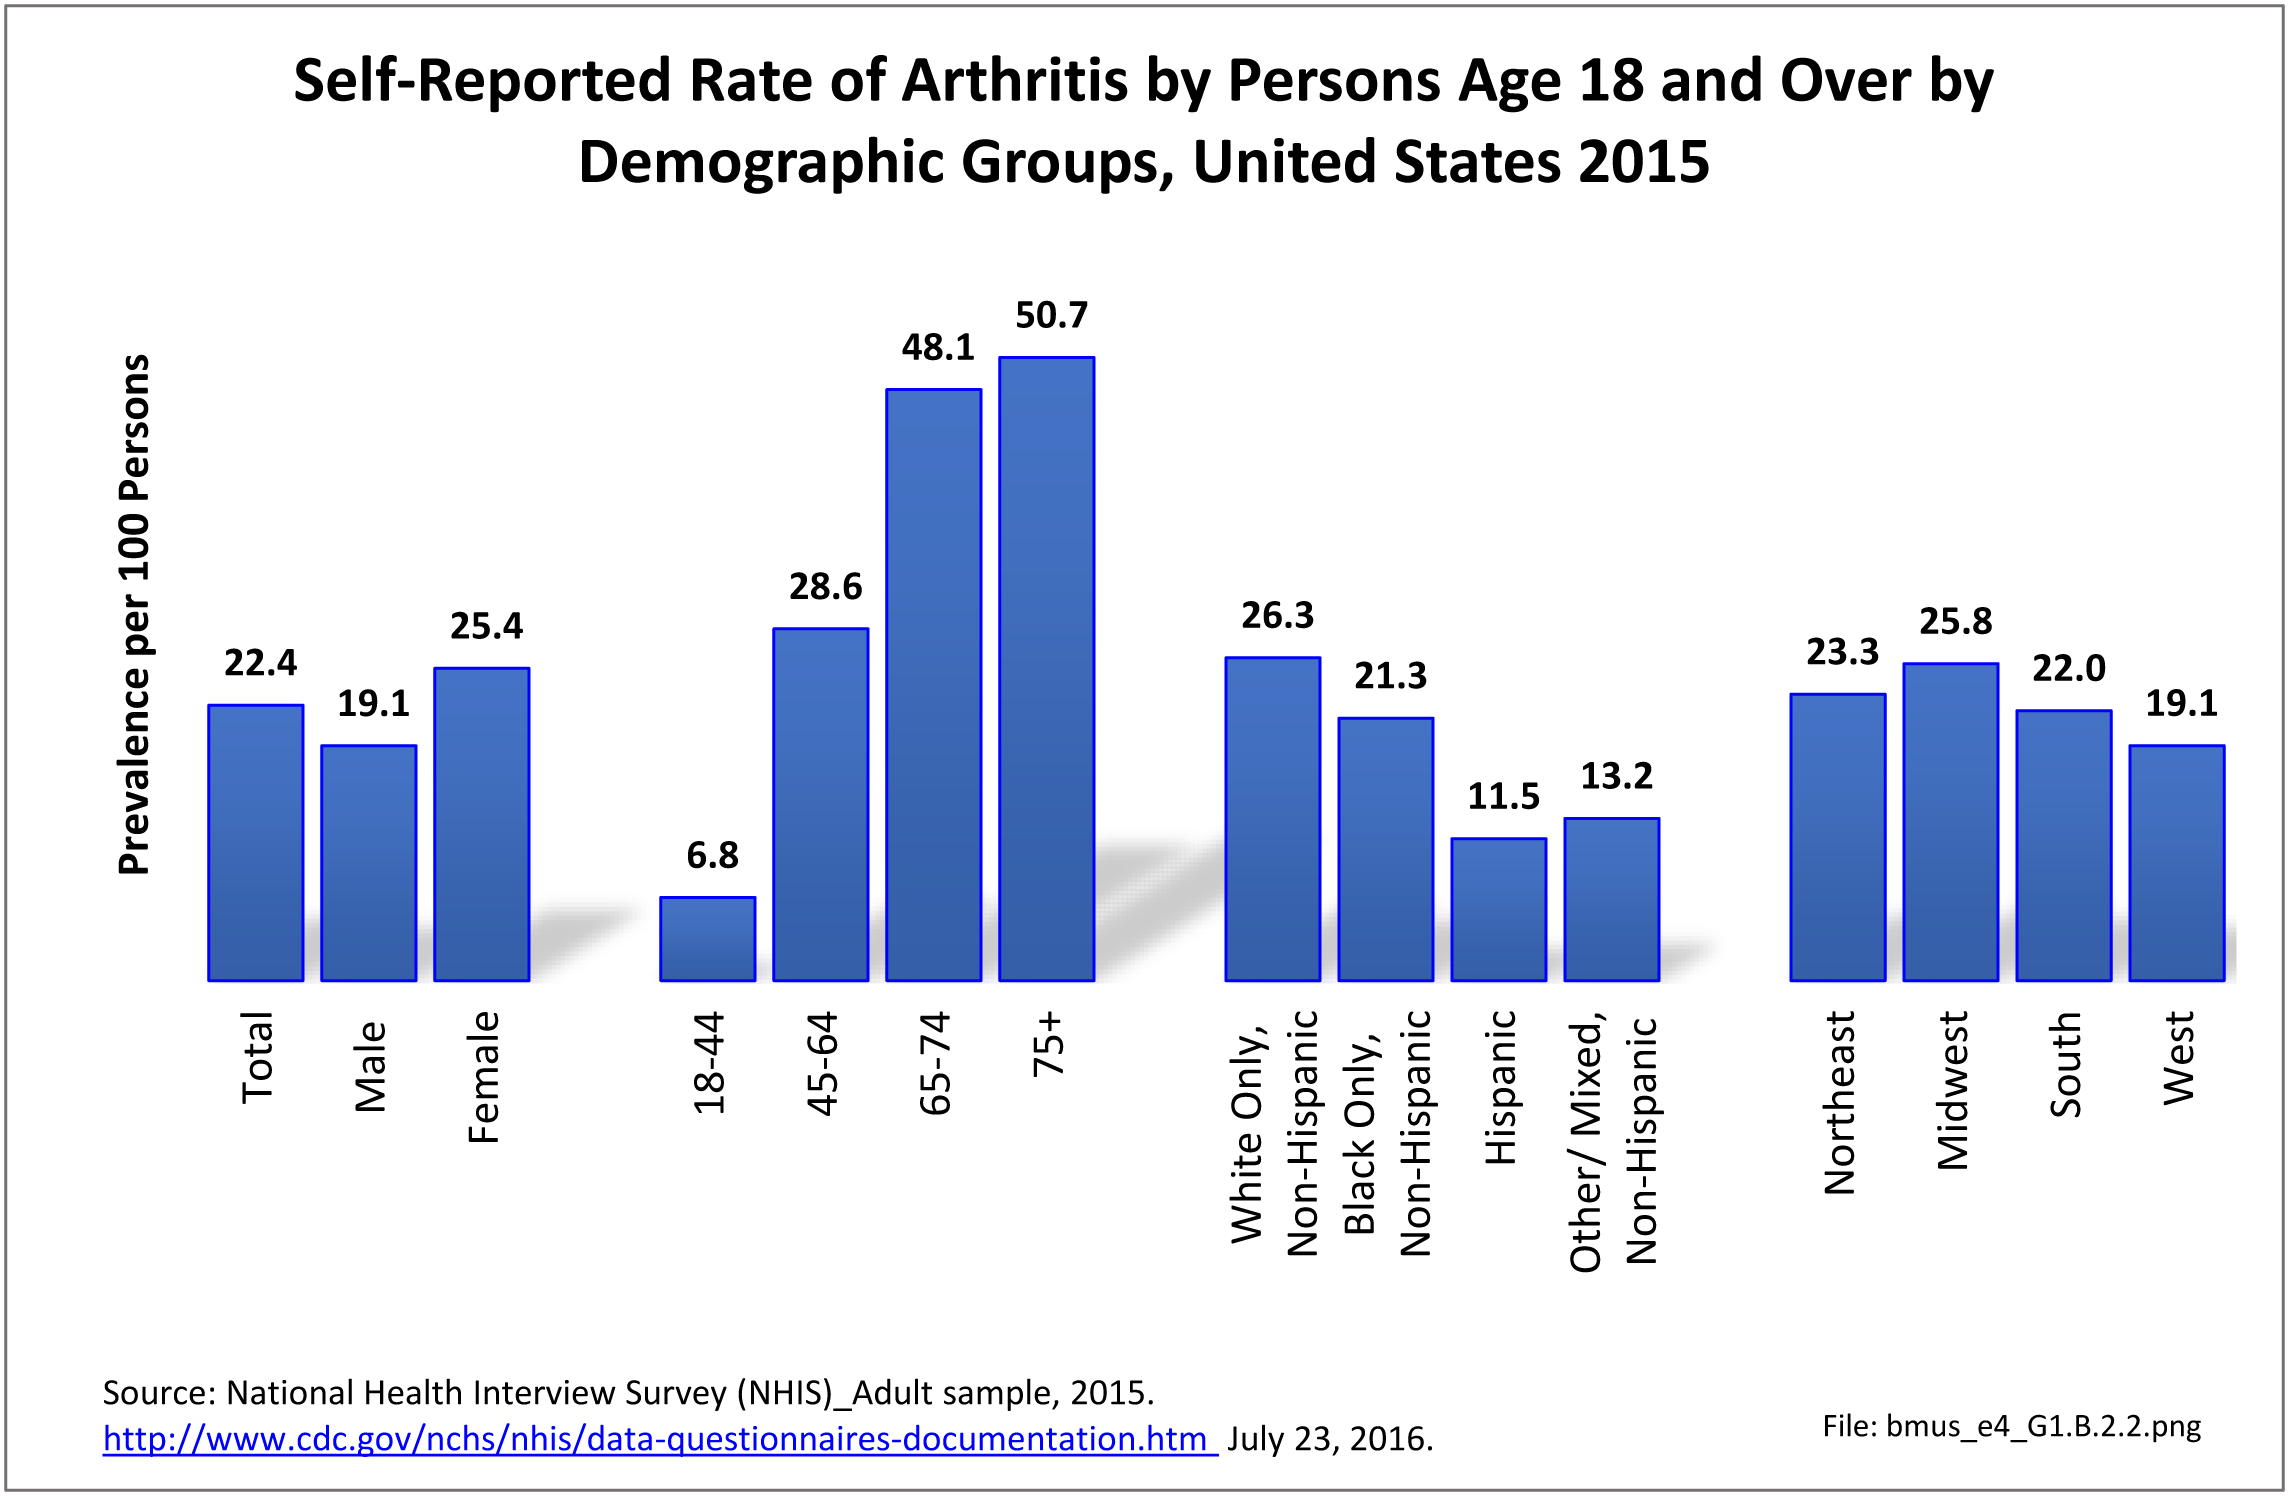
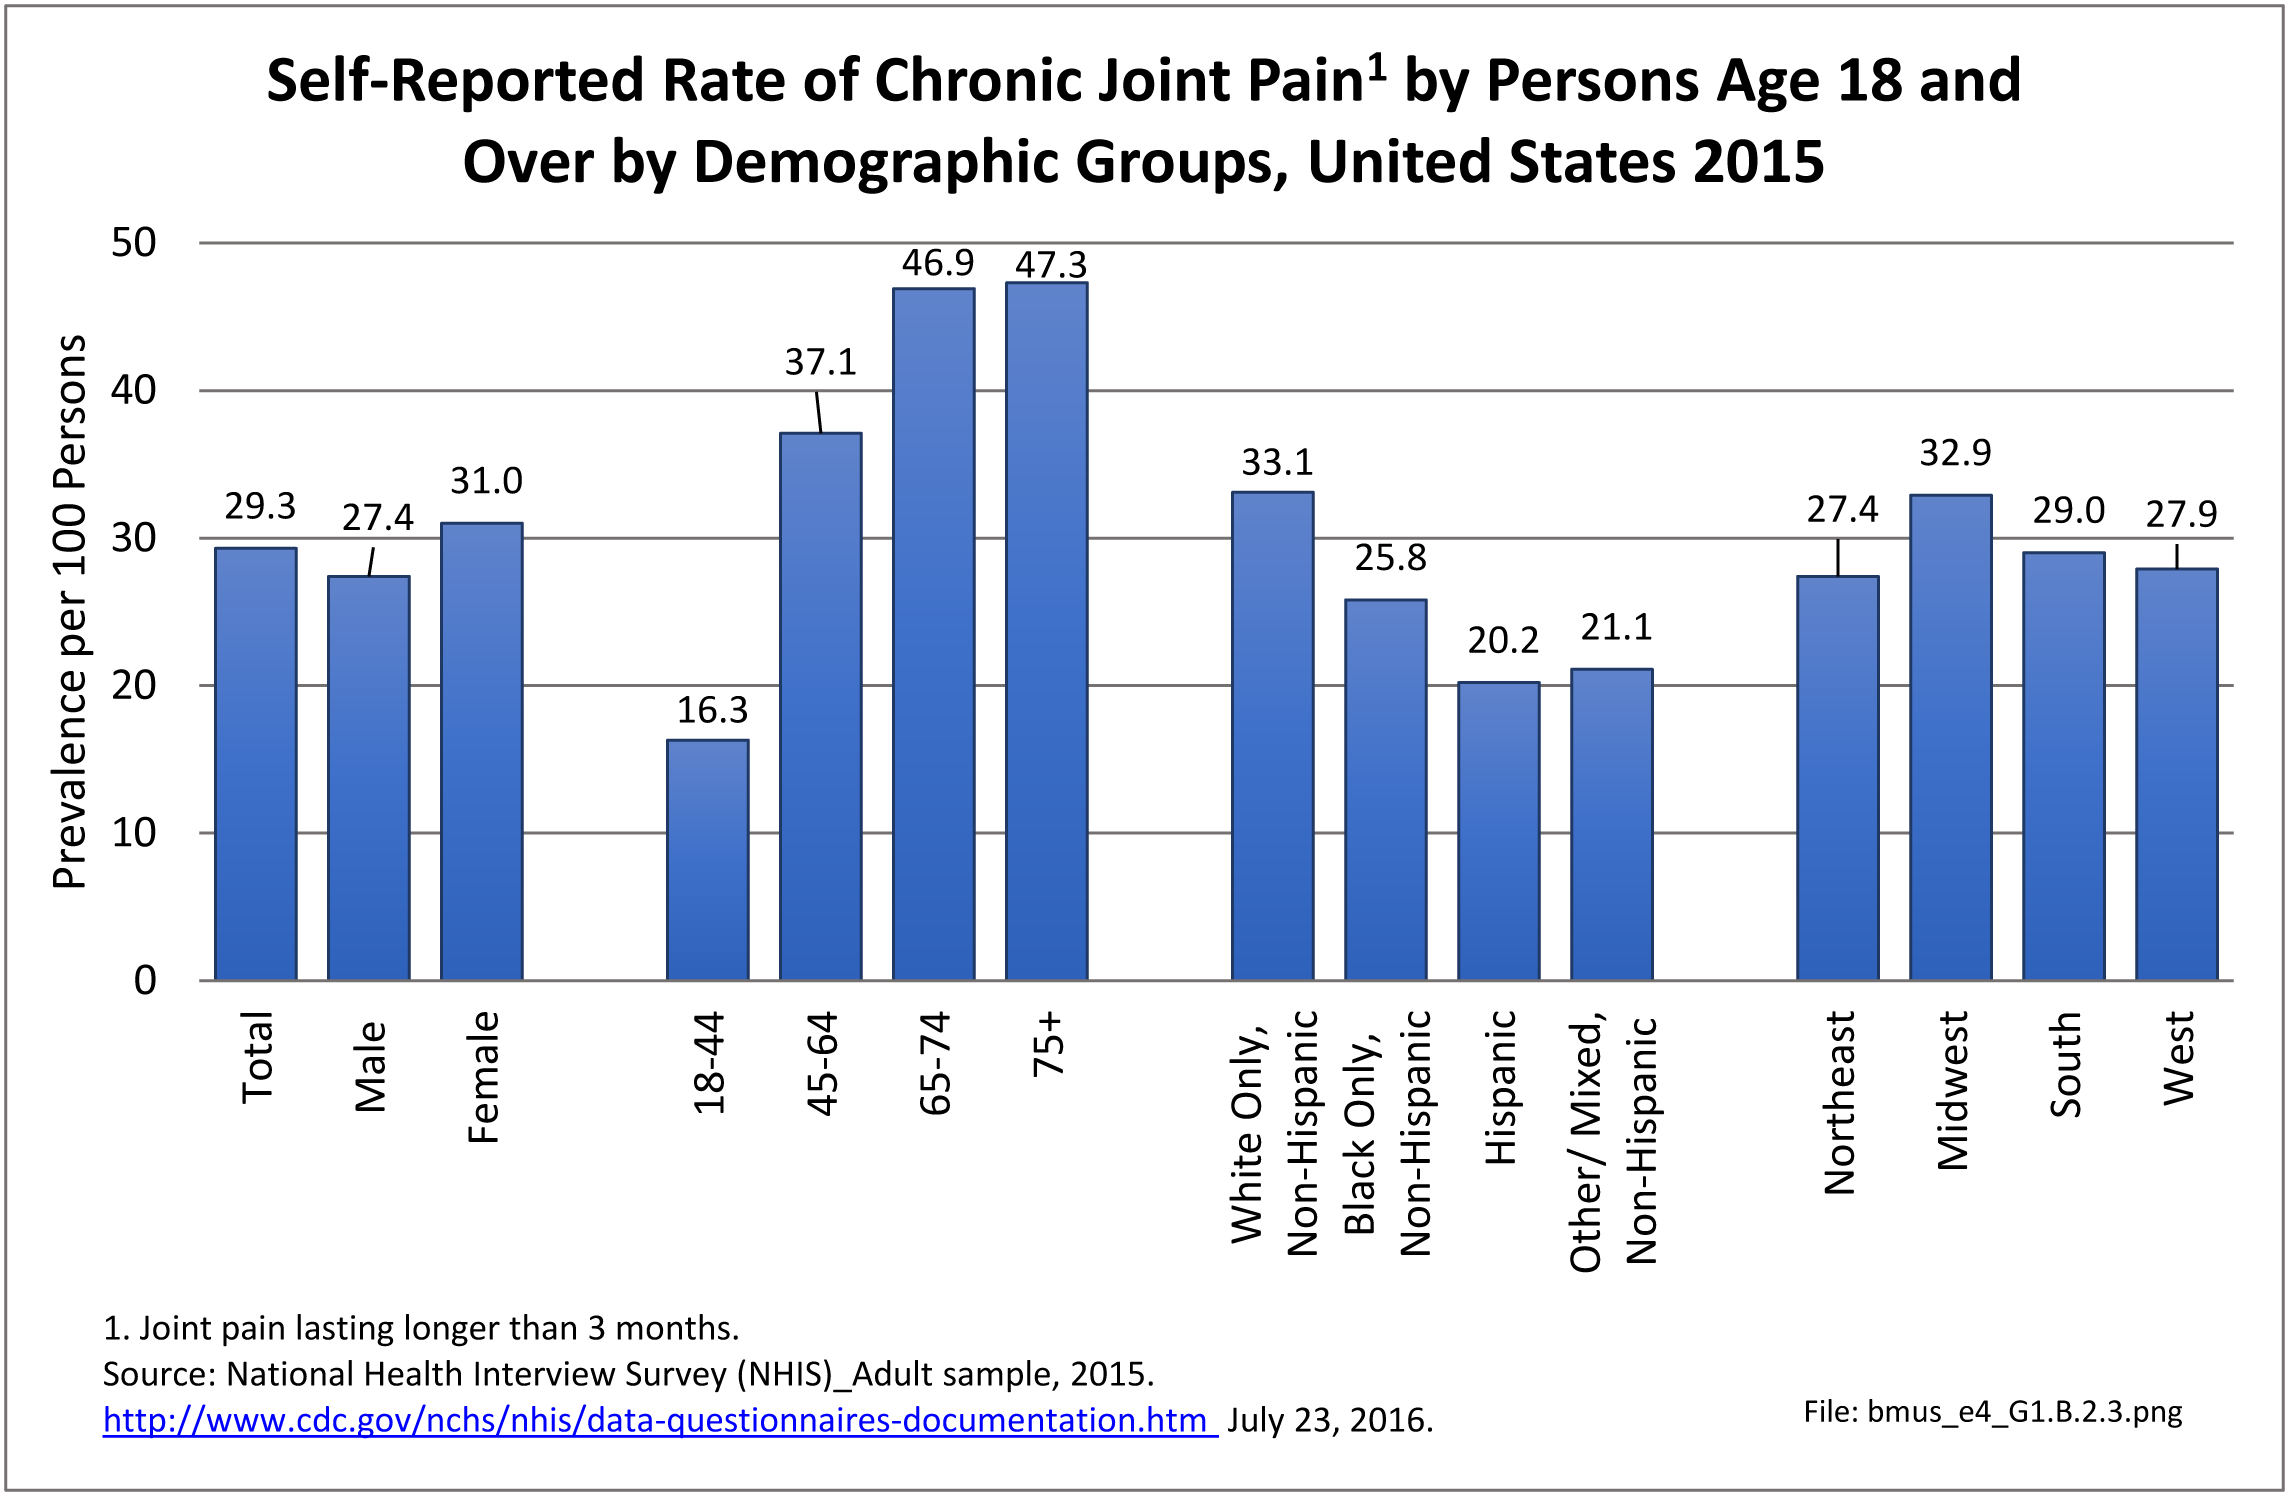
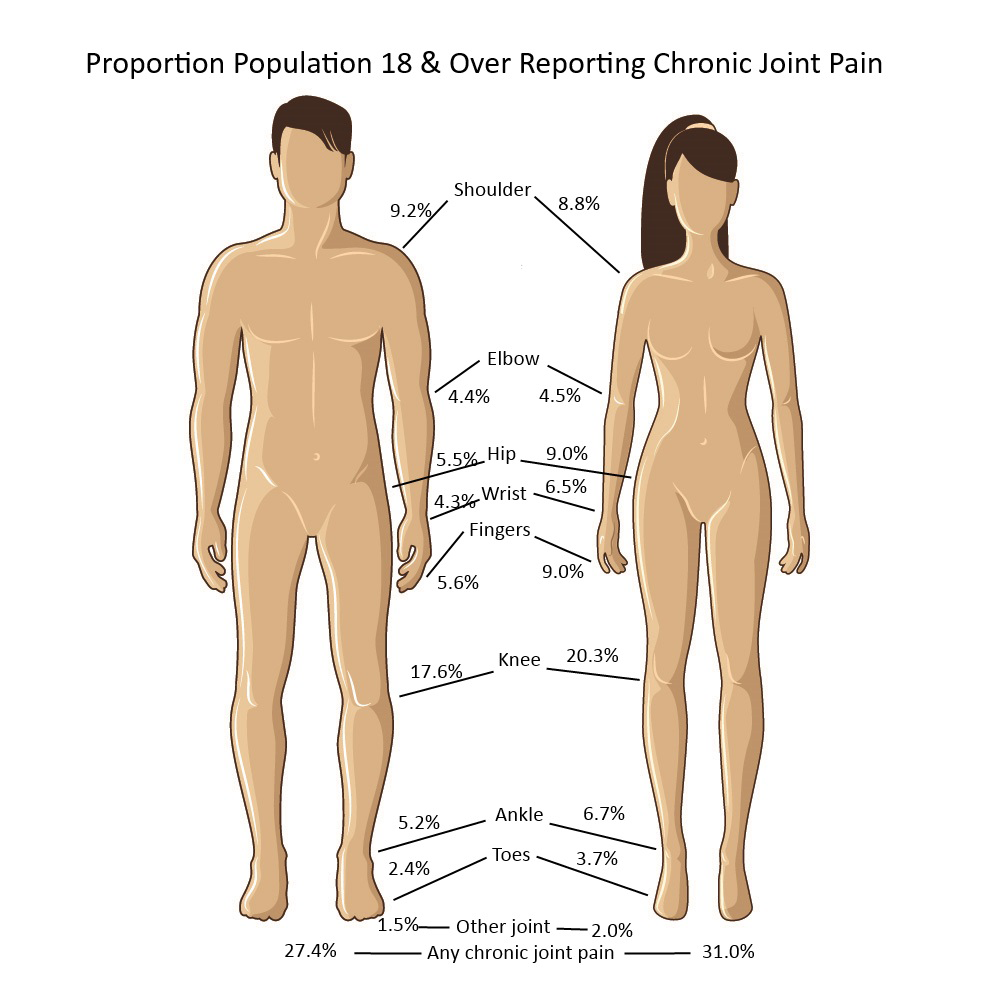
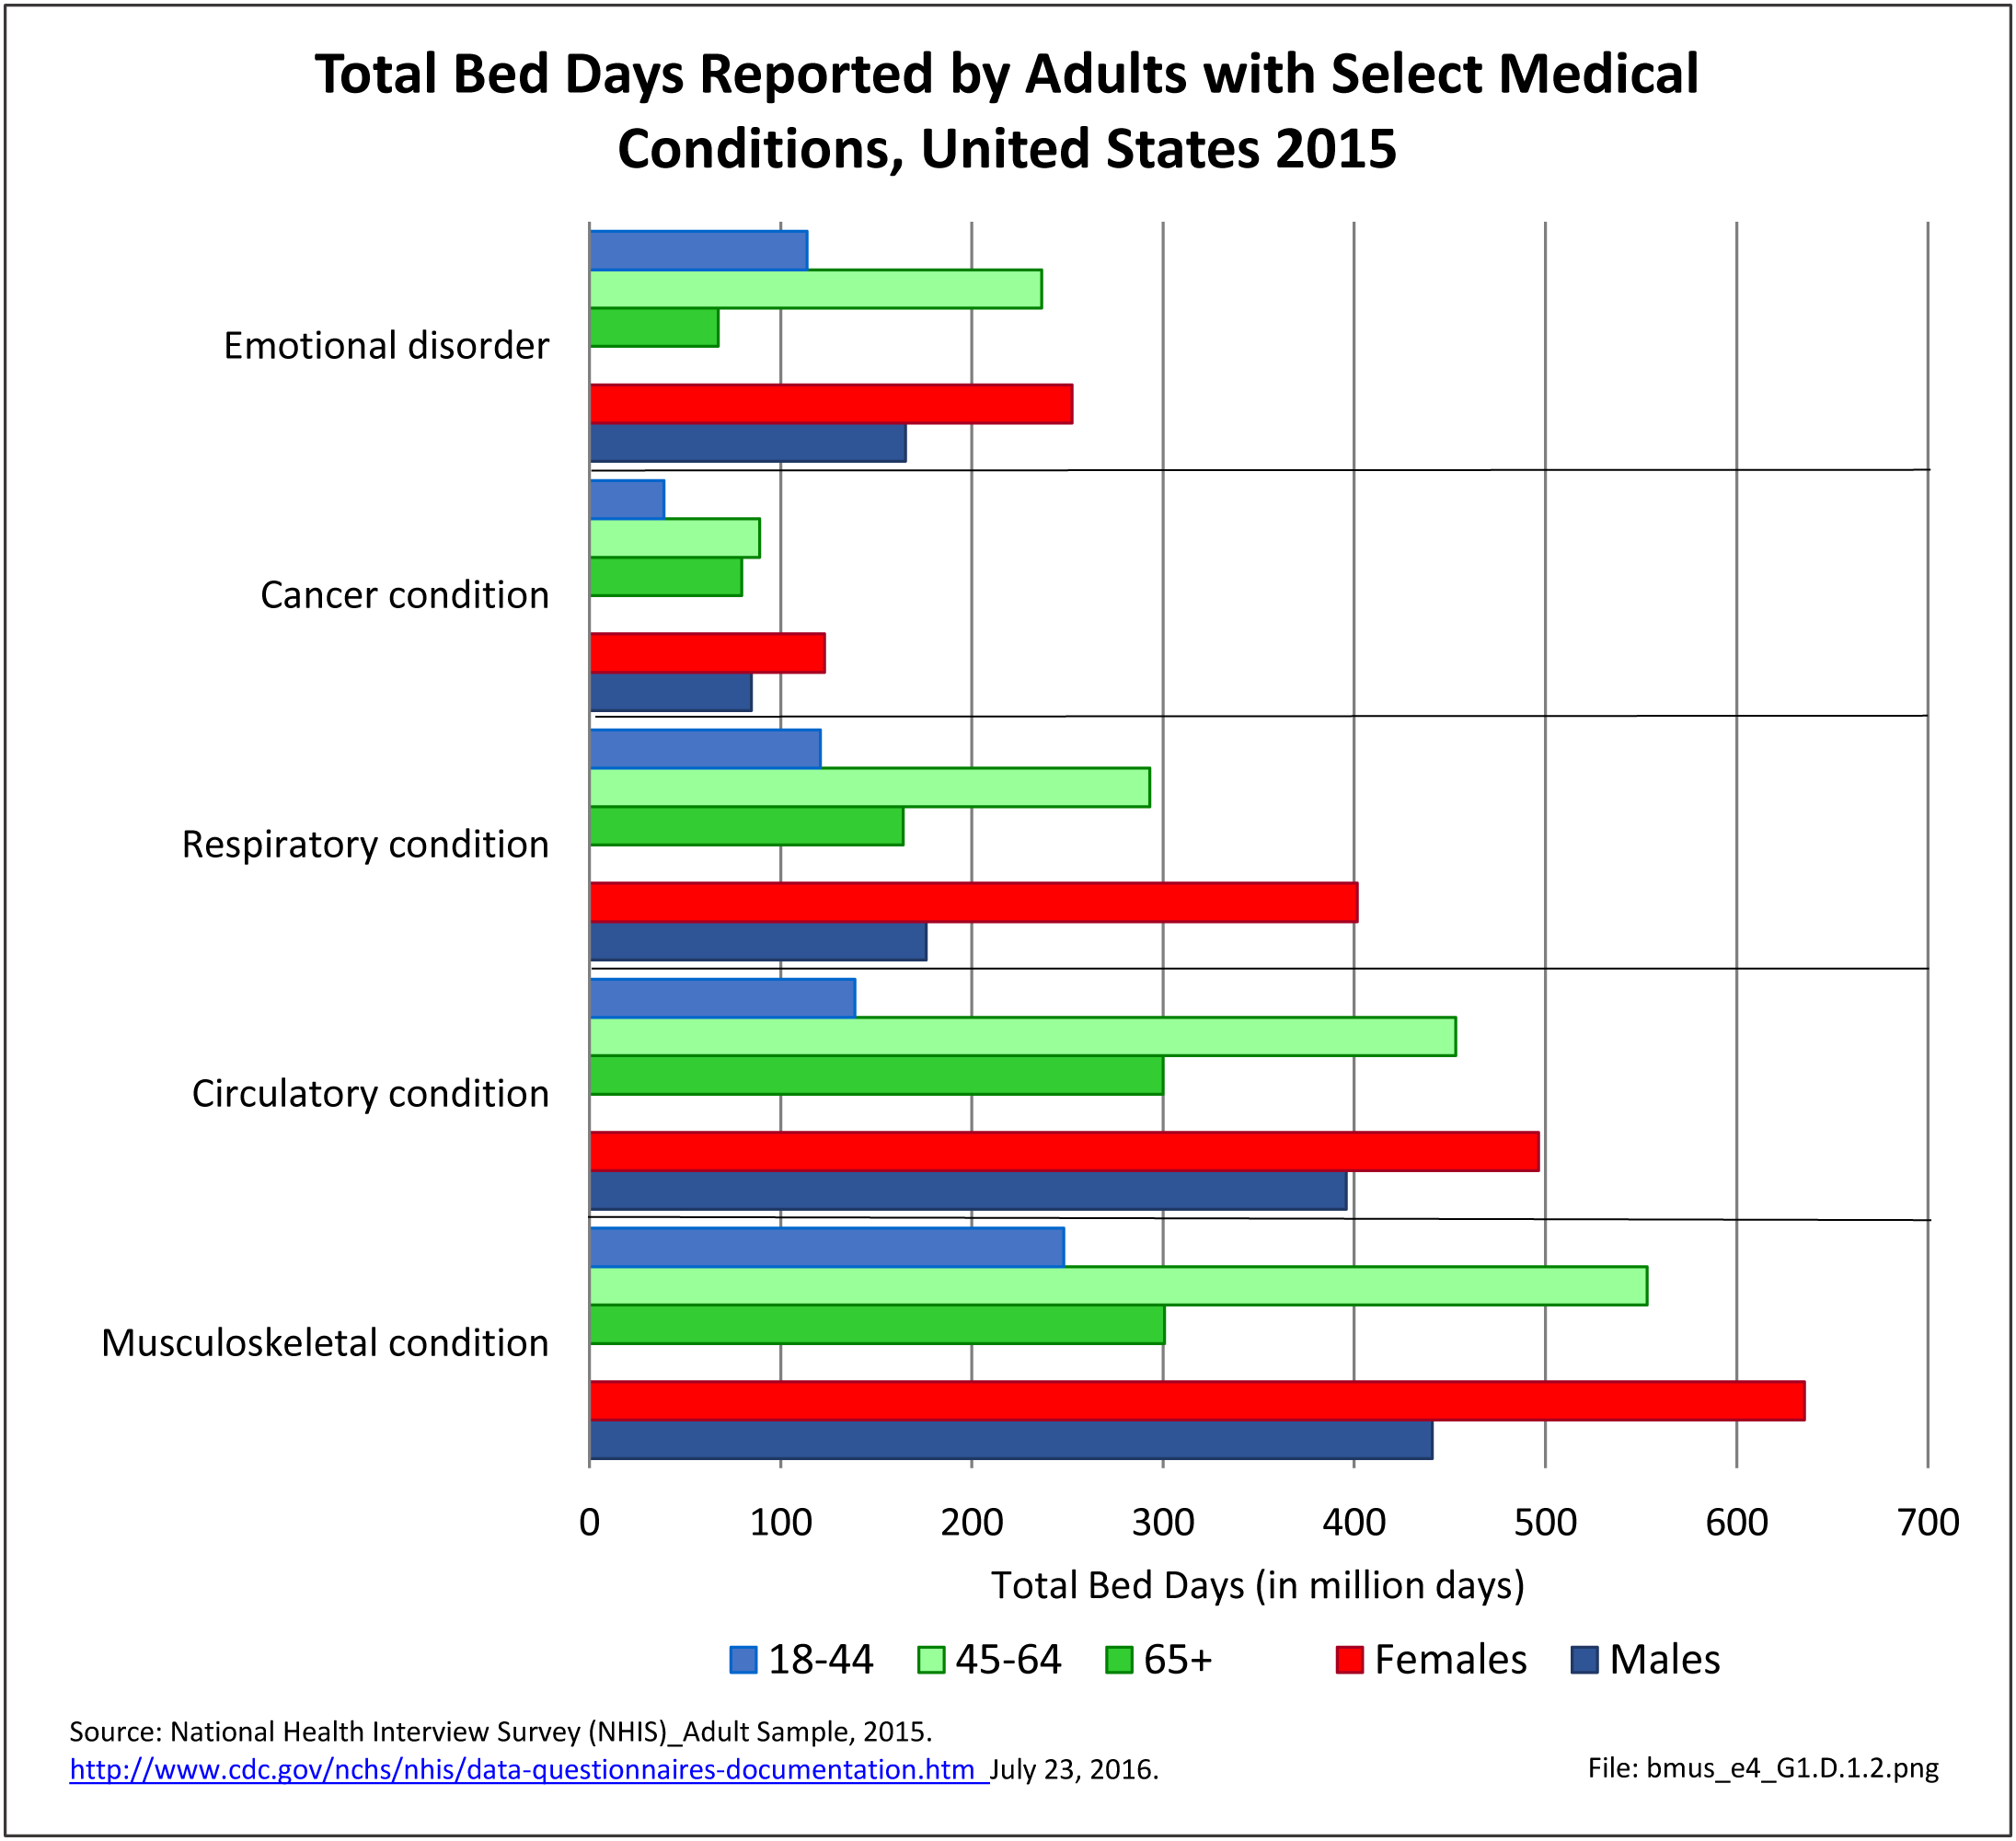
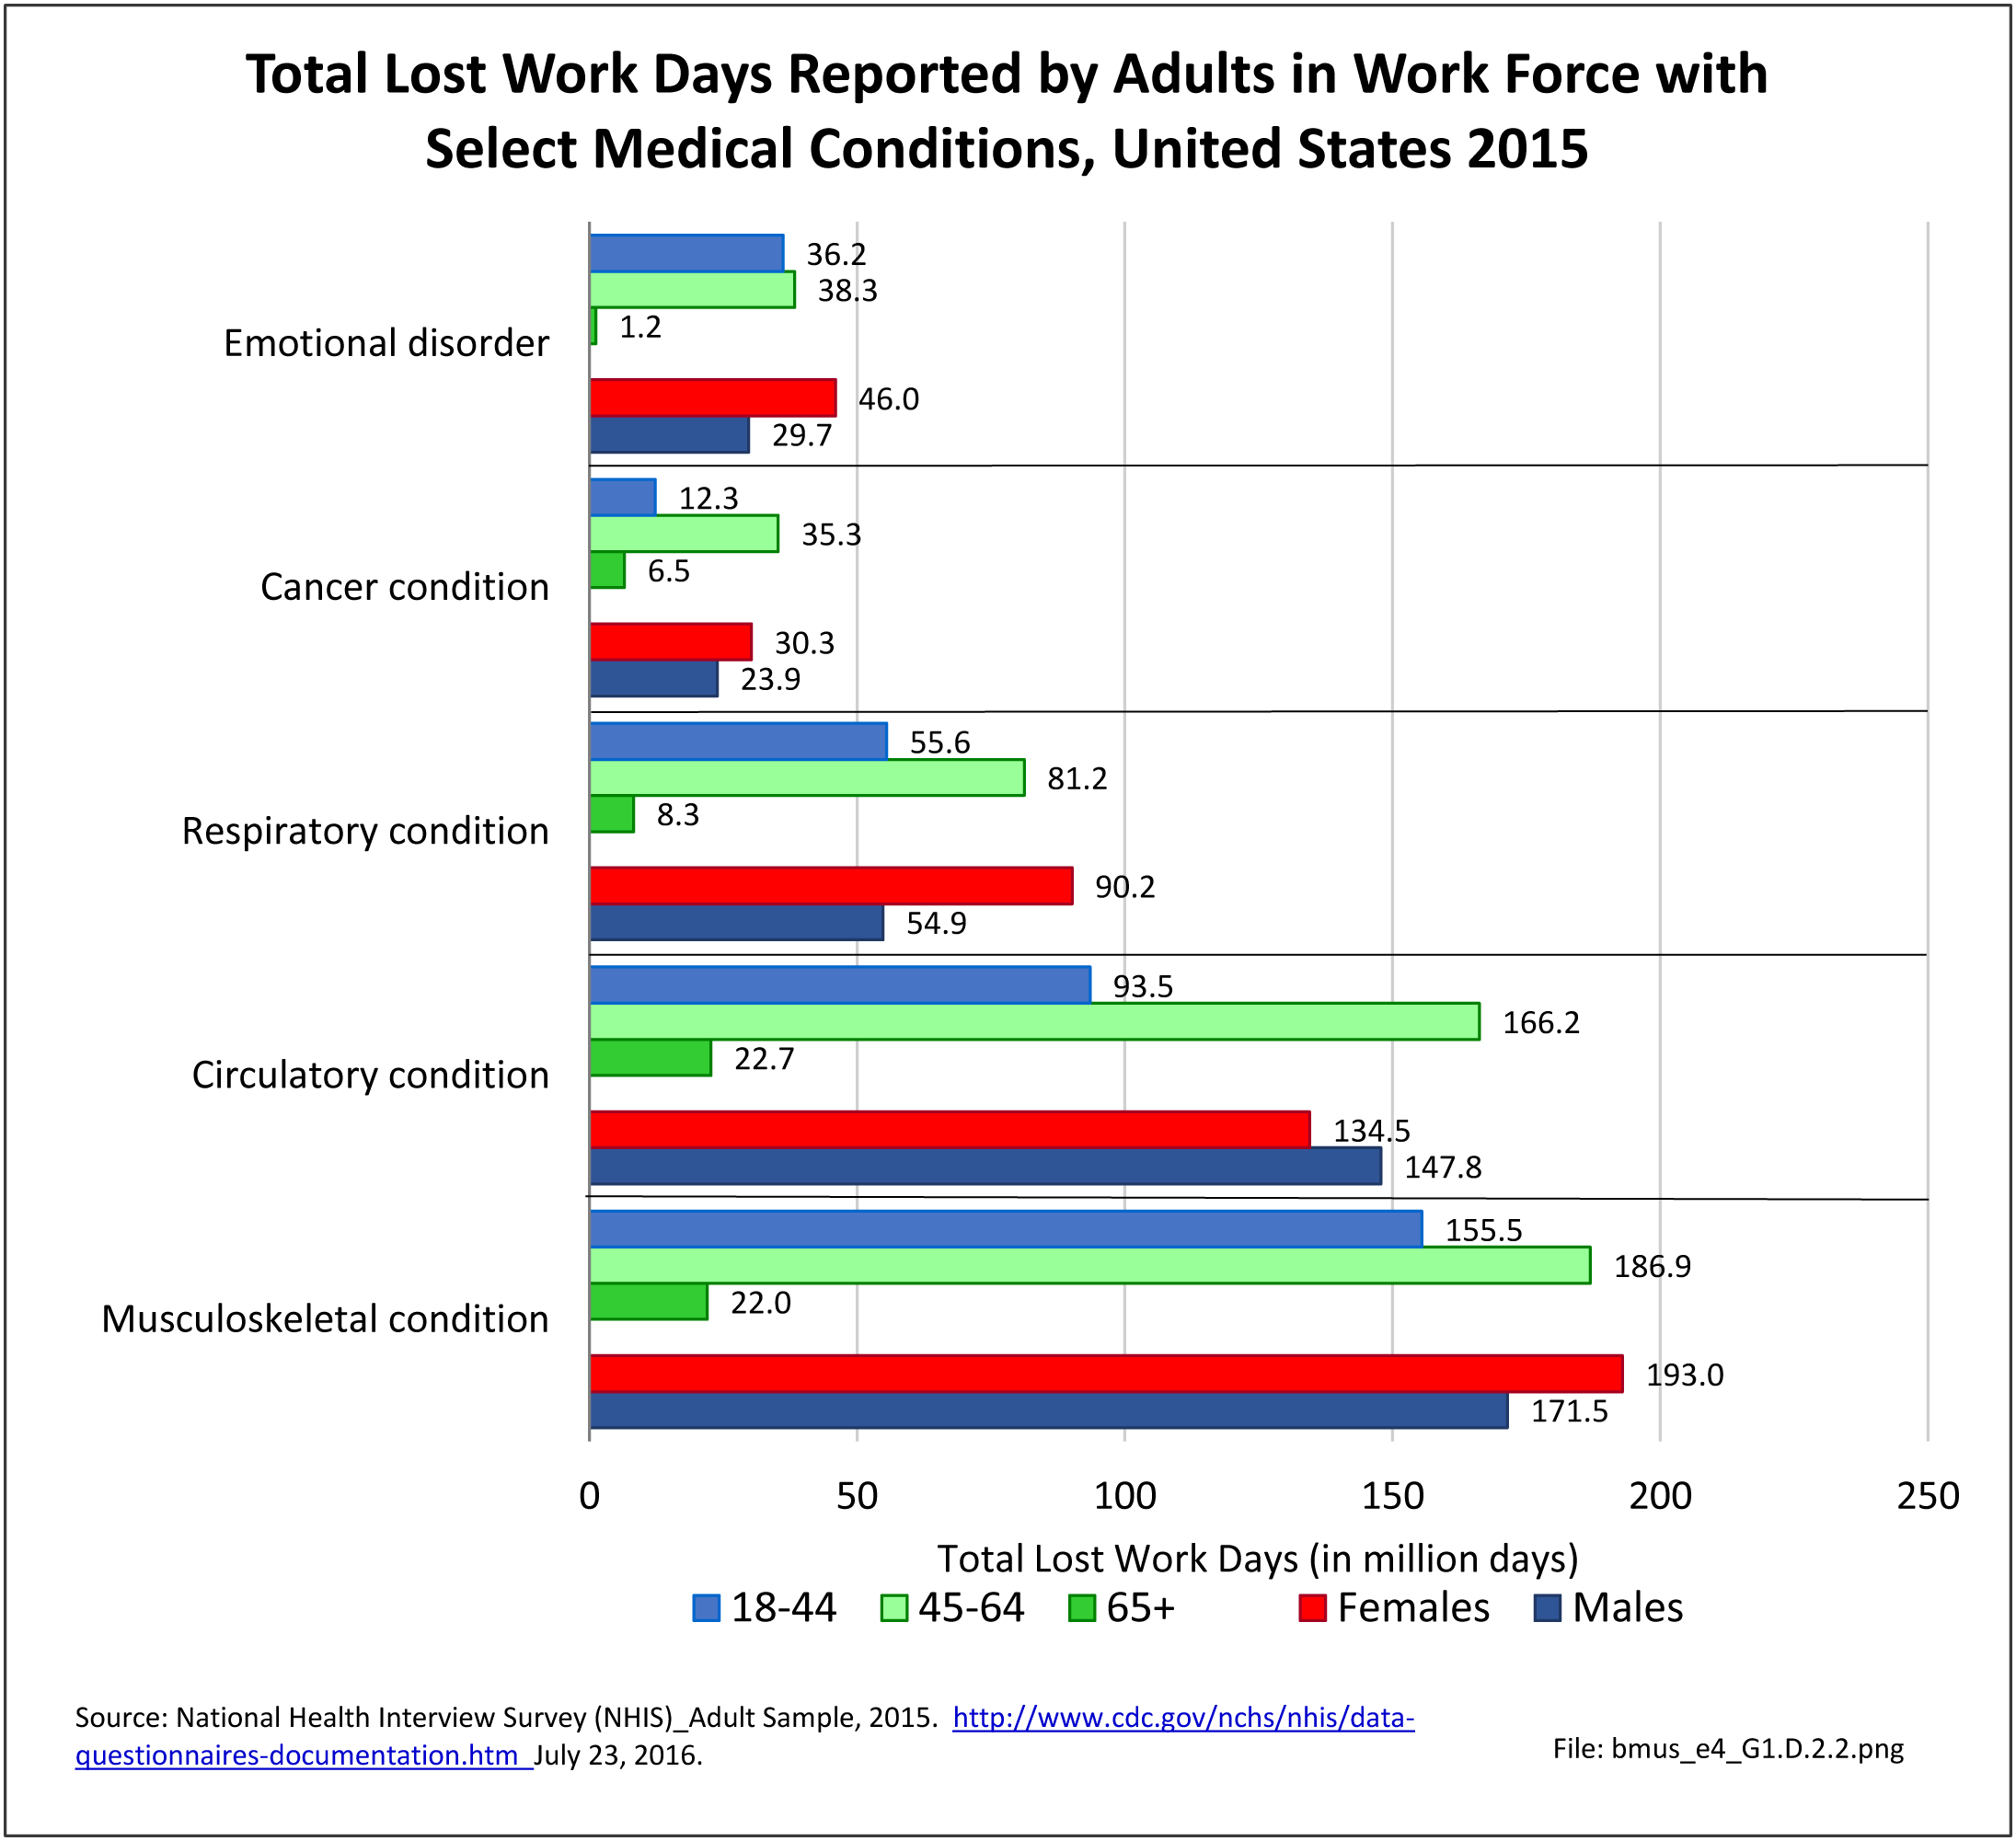
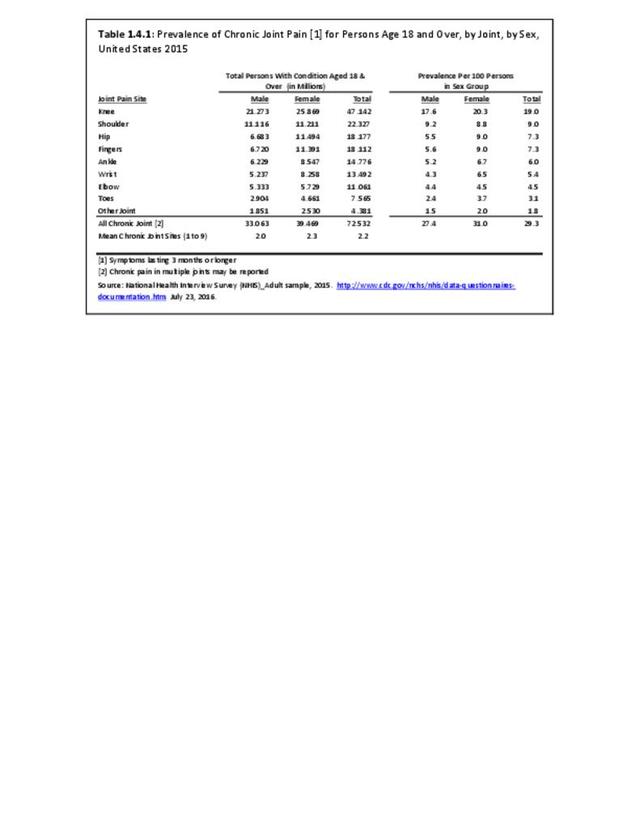
Females report higher levels of most major non-fatal health conditions than do males. The rate of musculoskeletal conditions in females was 52.7, while males reported musculoskeletal conditions at a rate of 47.3 per 100 persons. (Reference Tables 1.2.1 PDF CSV)

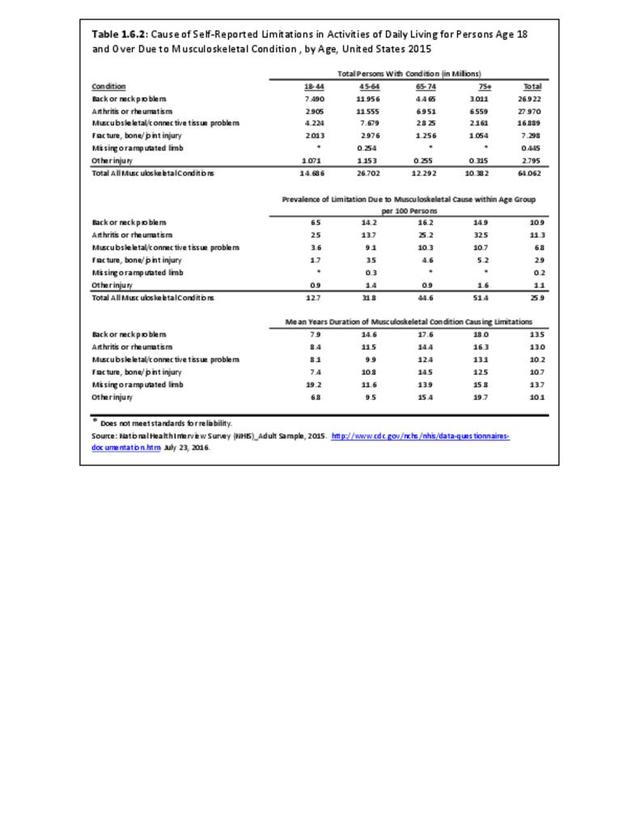
Age
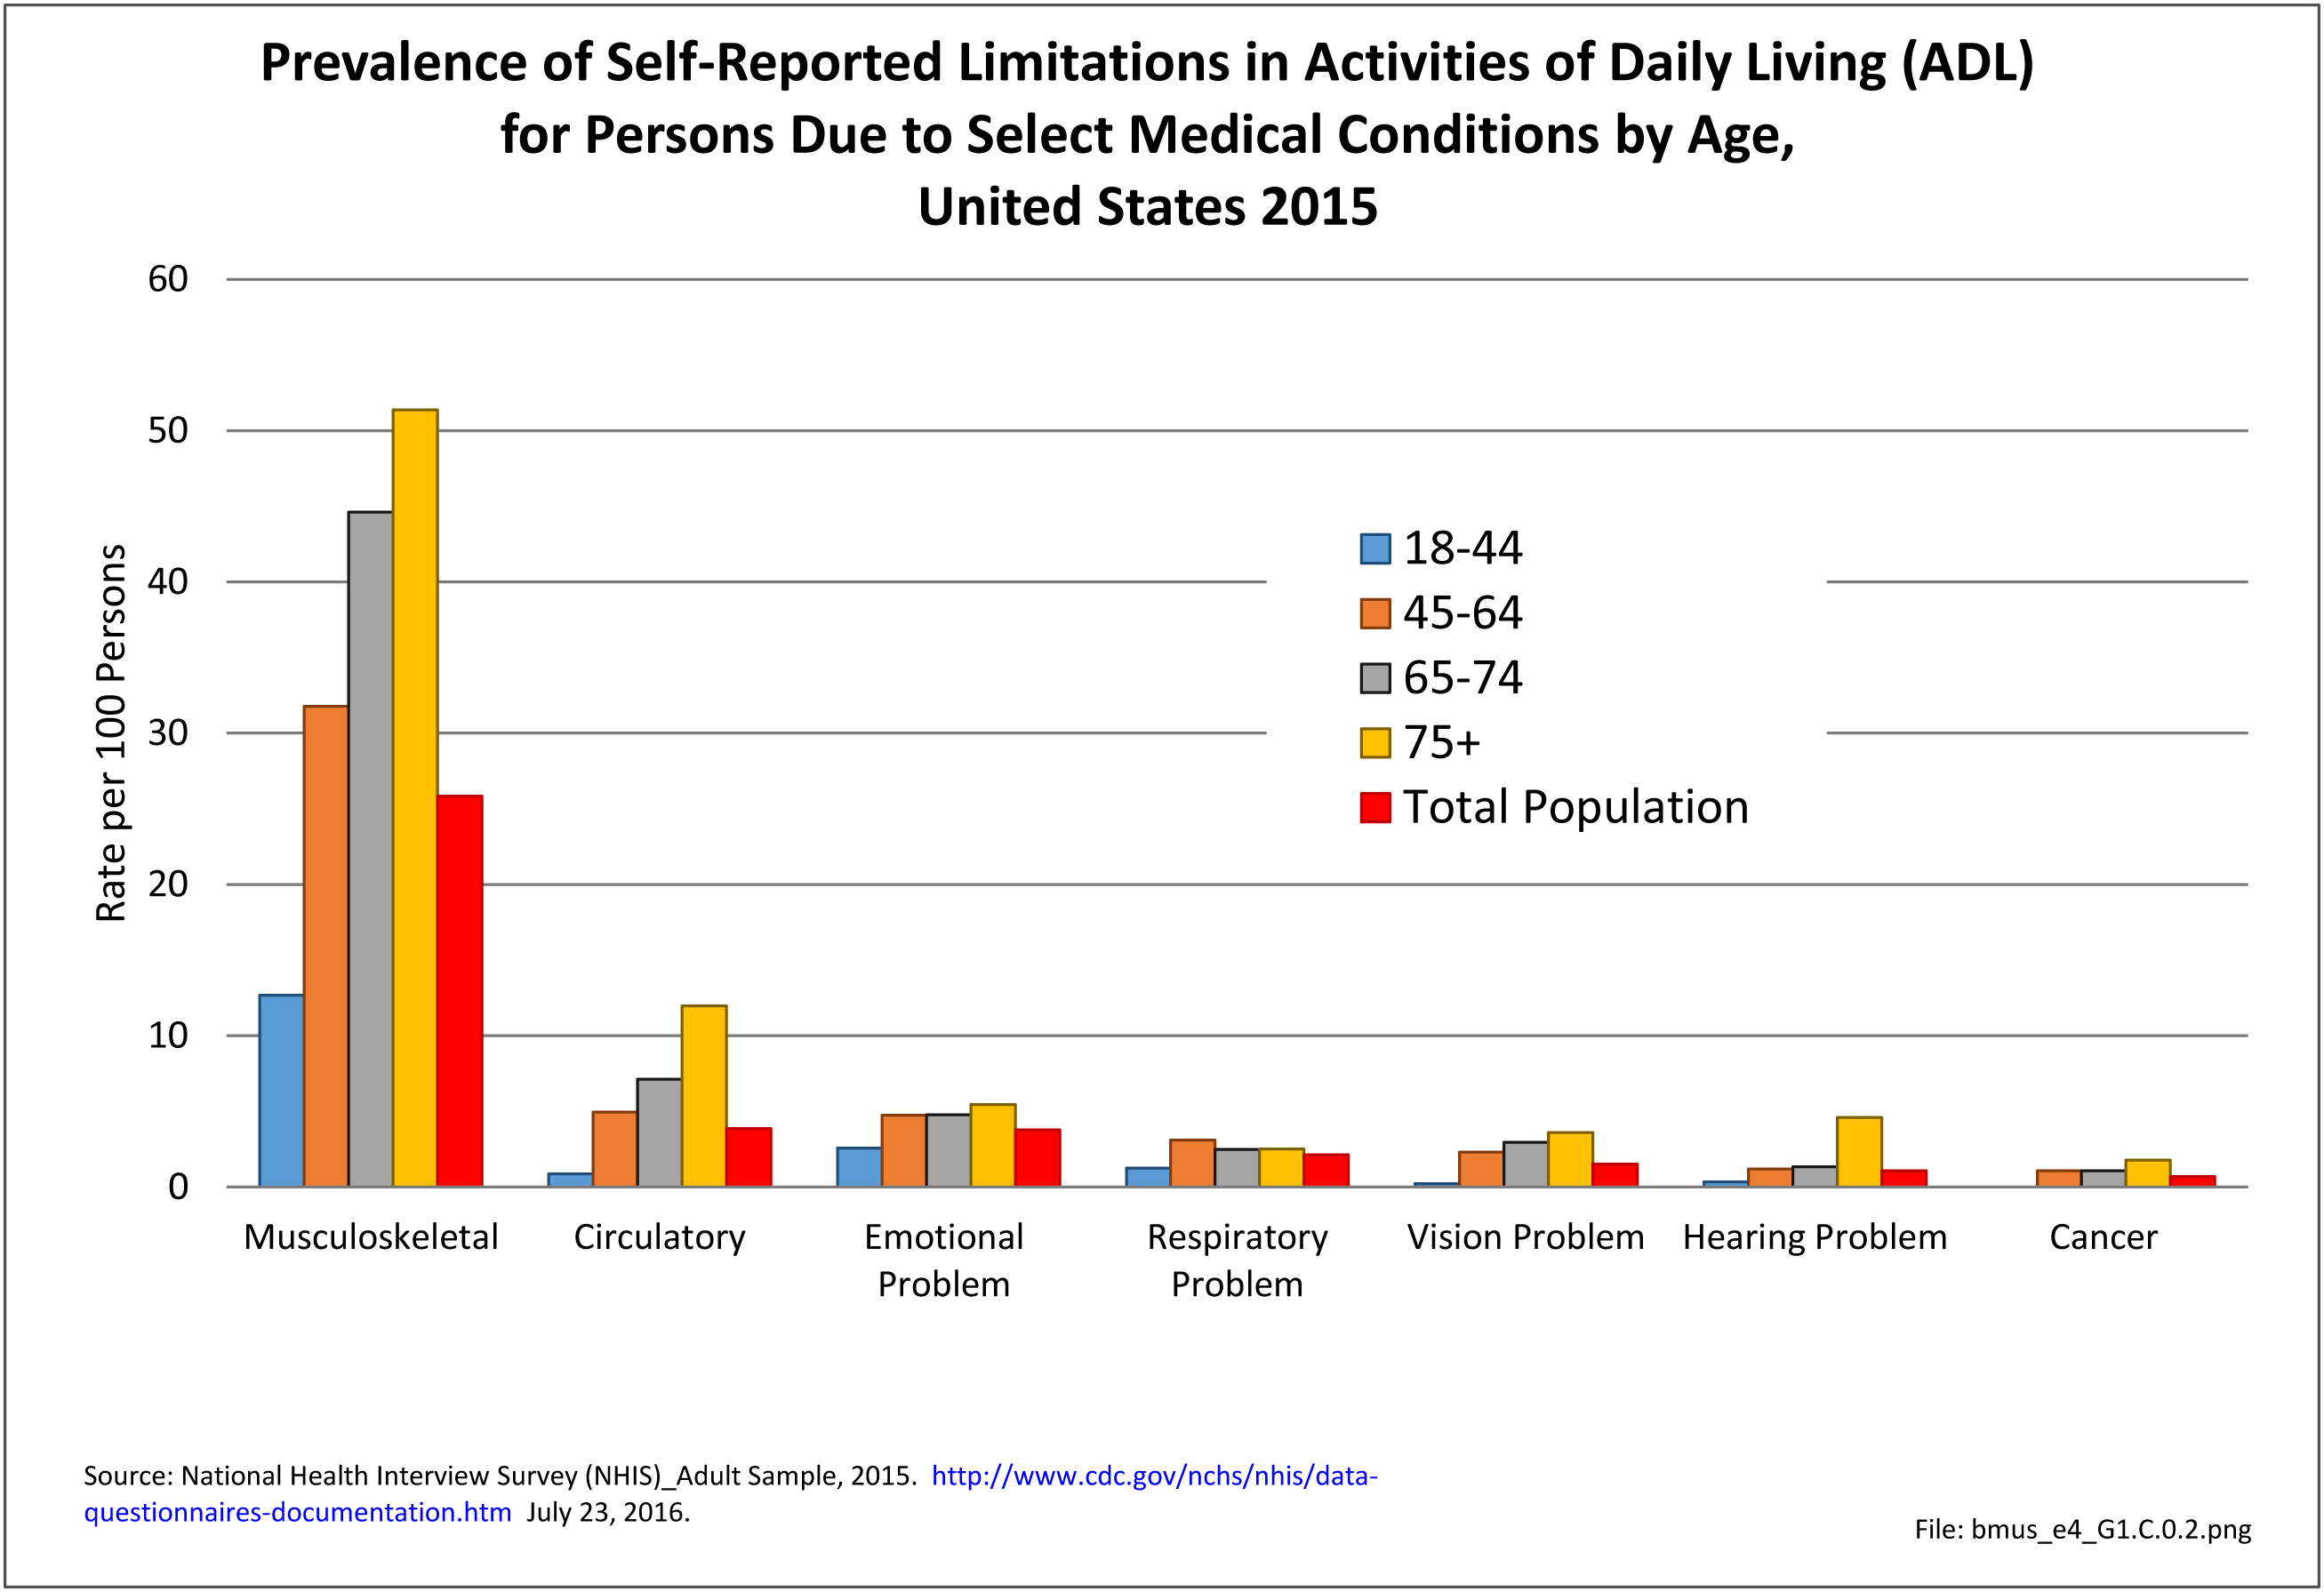
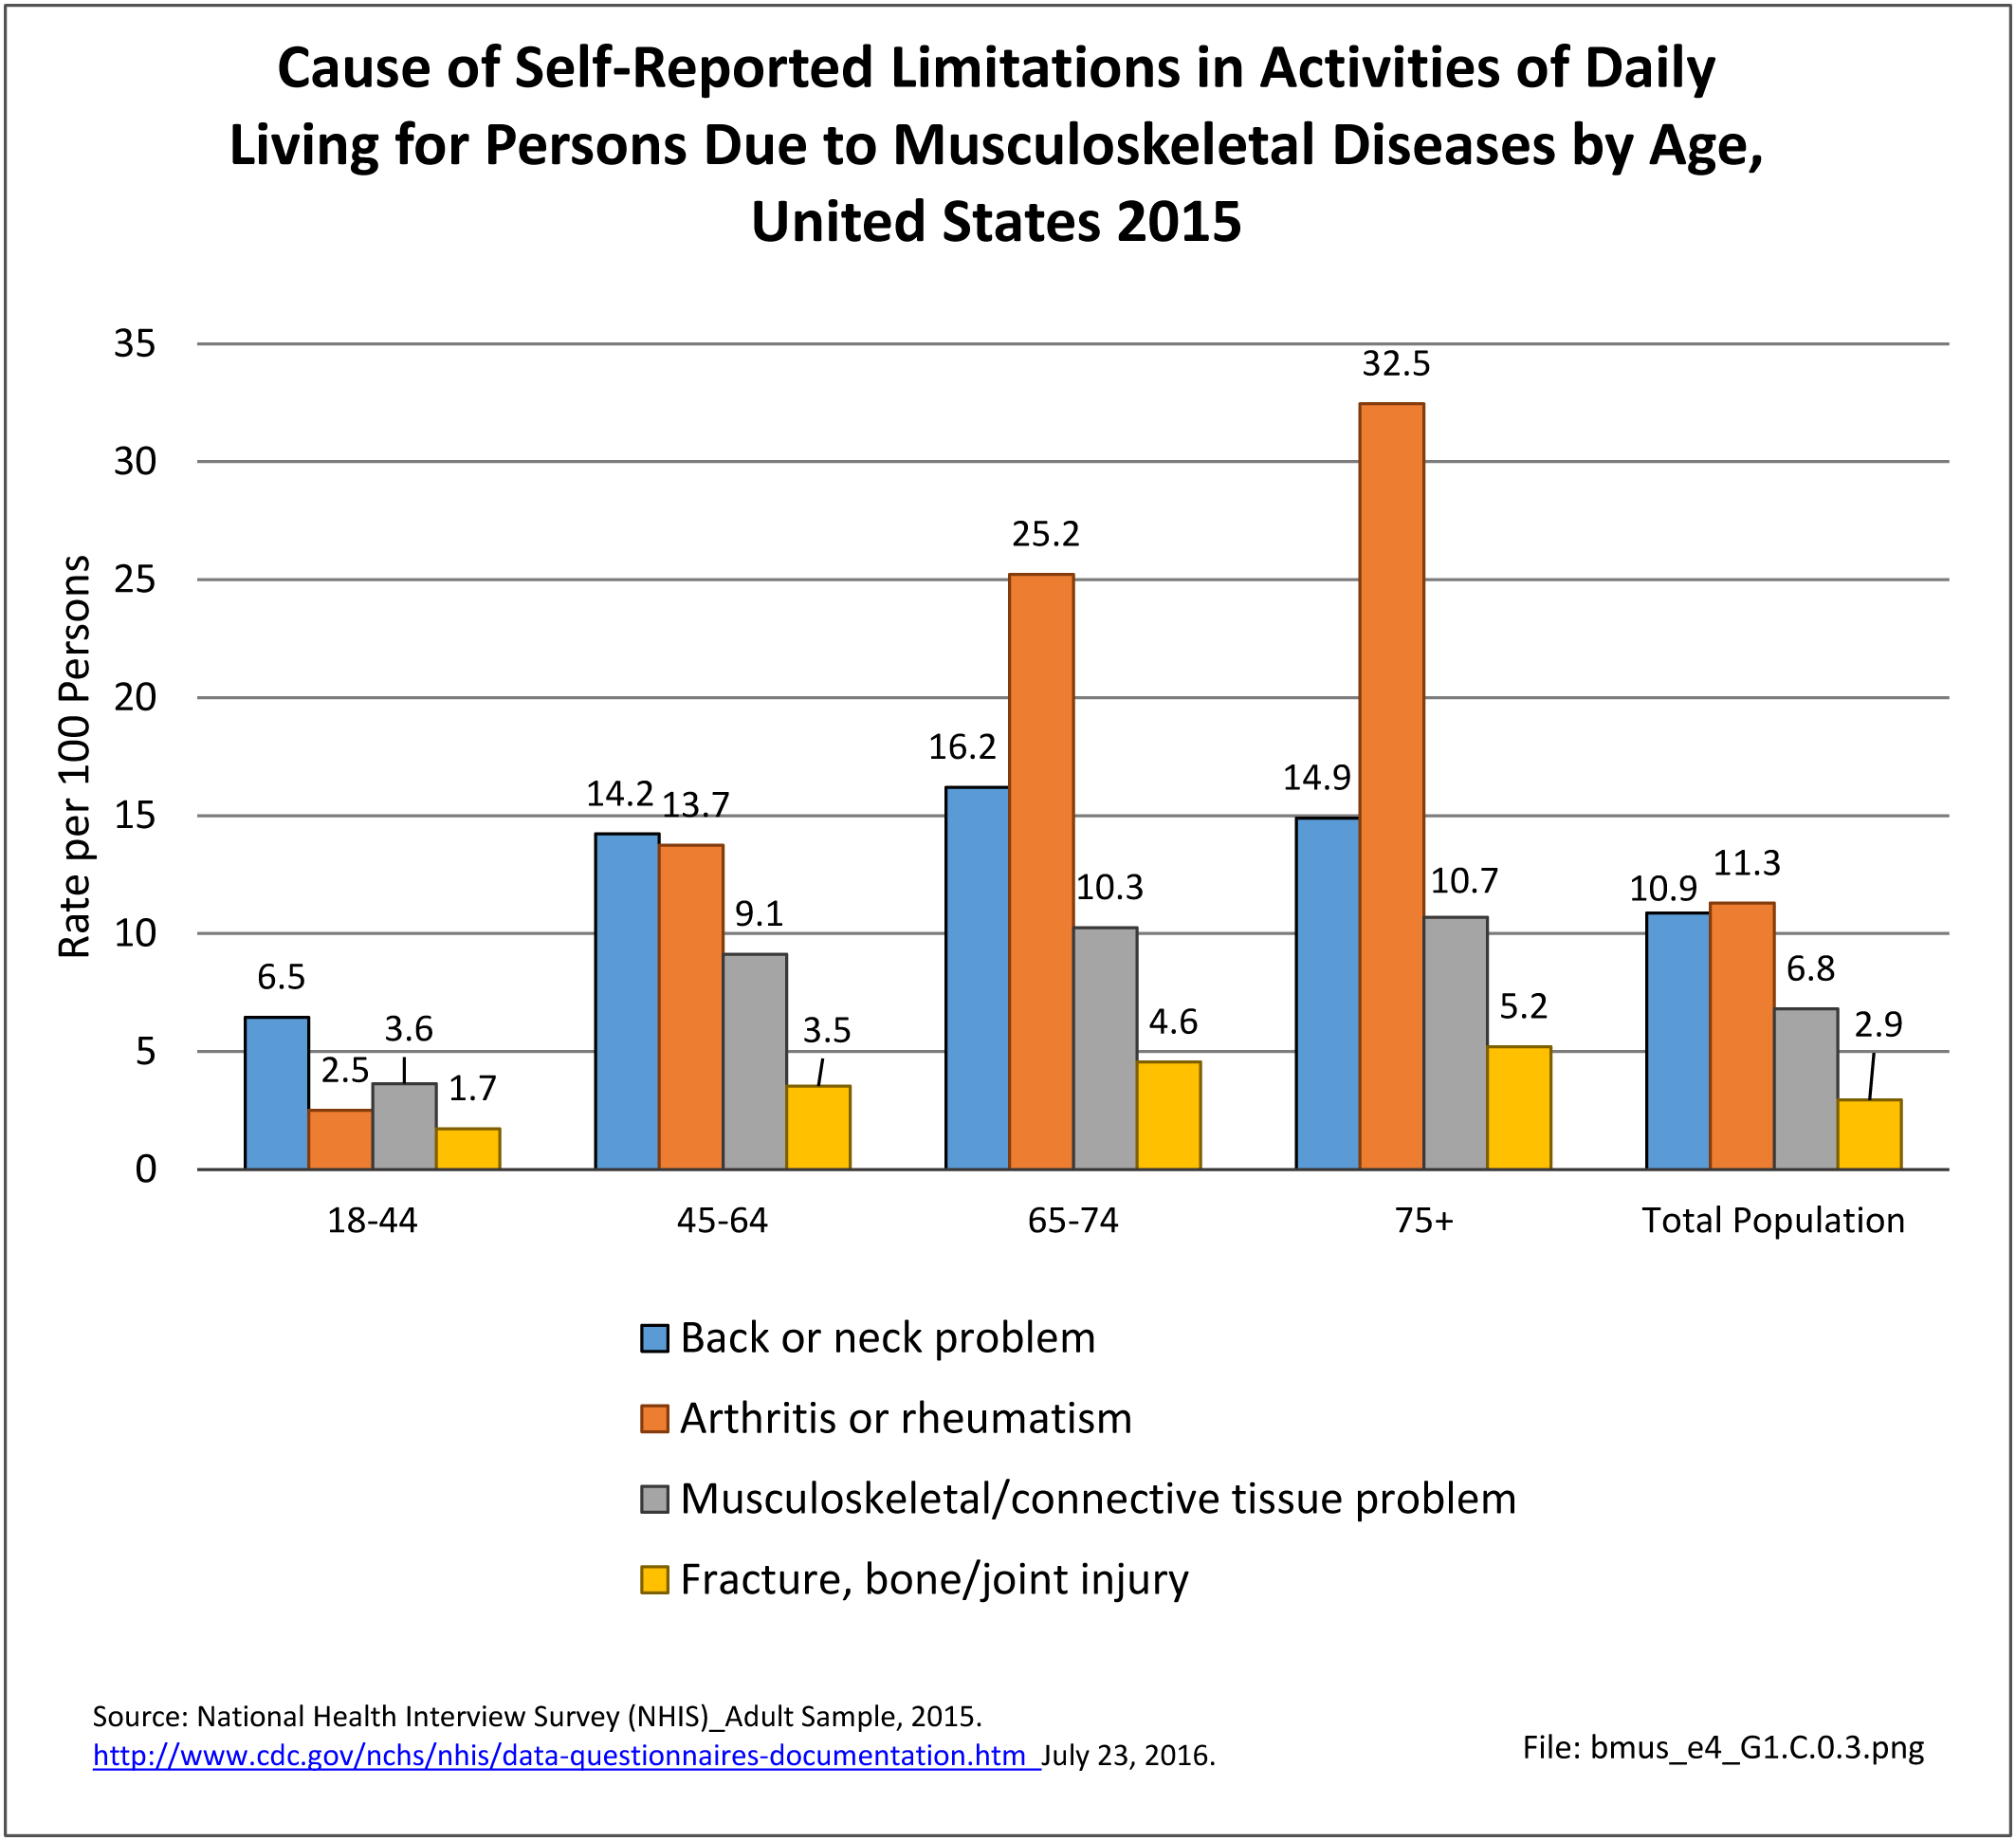
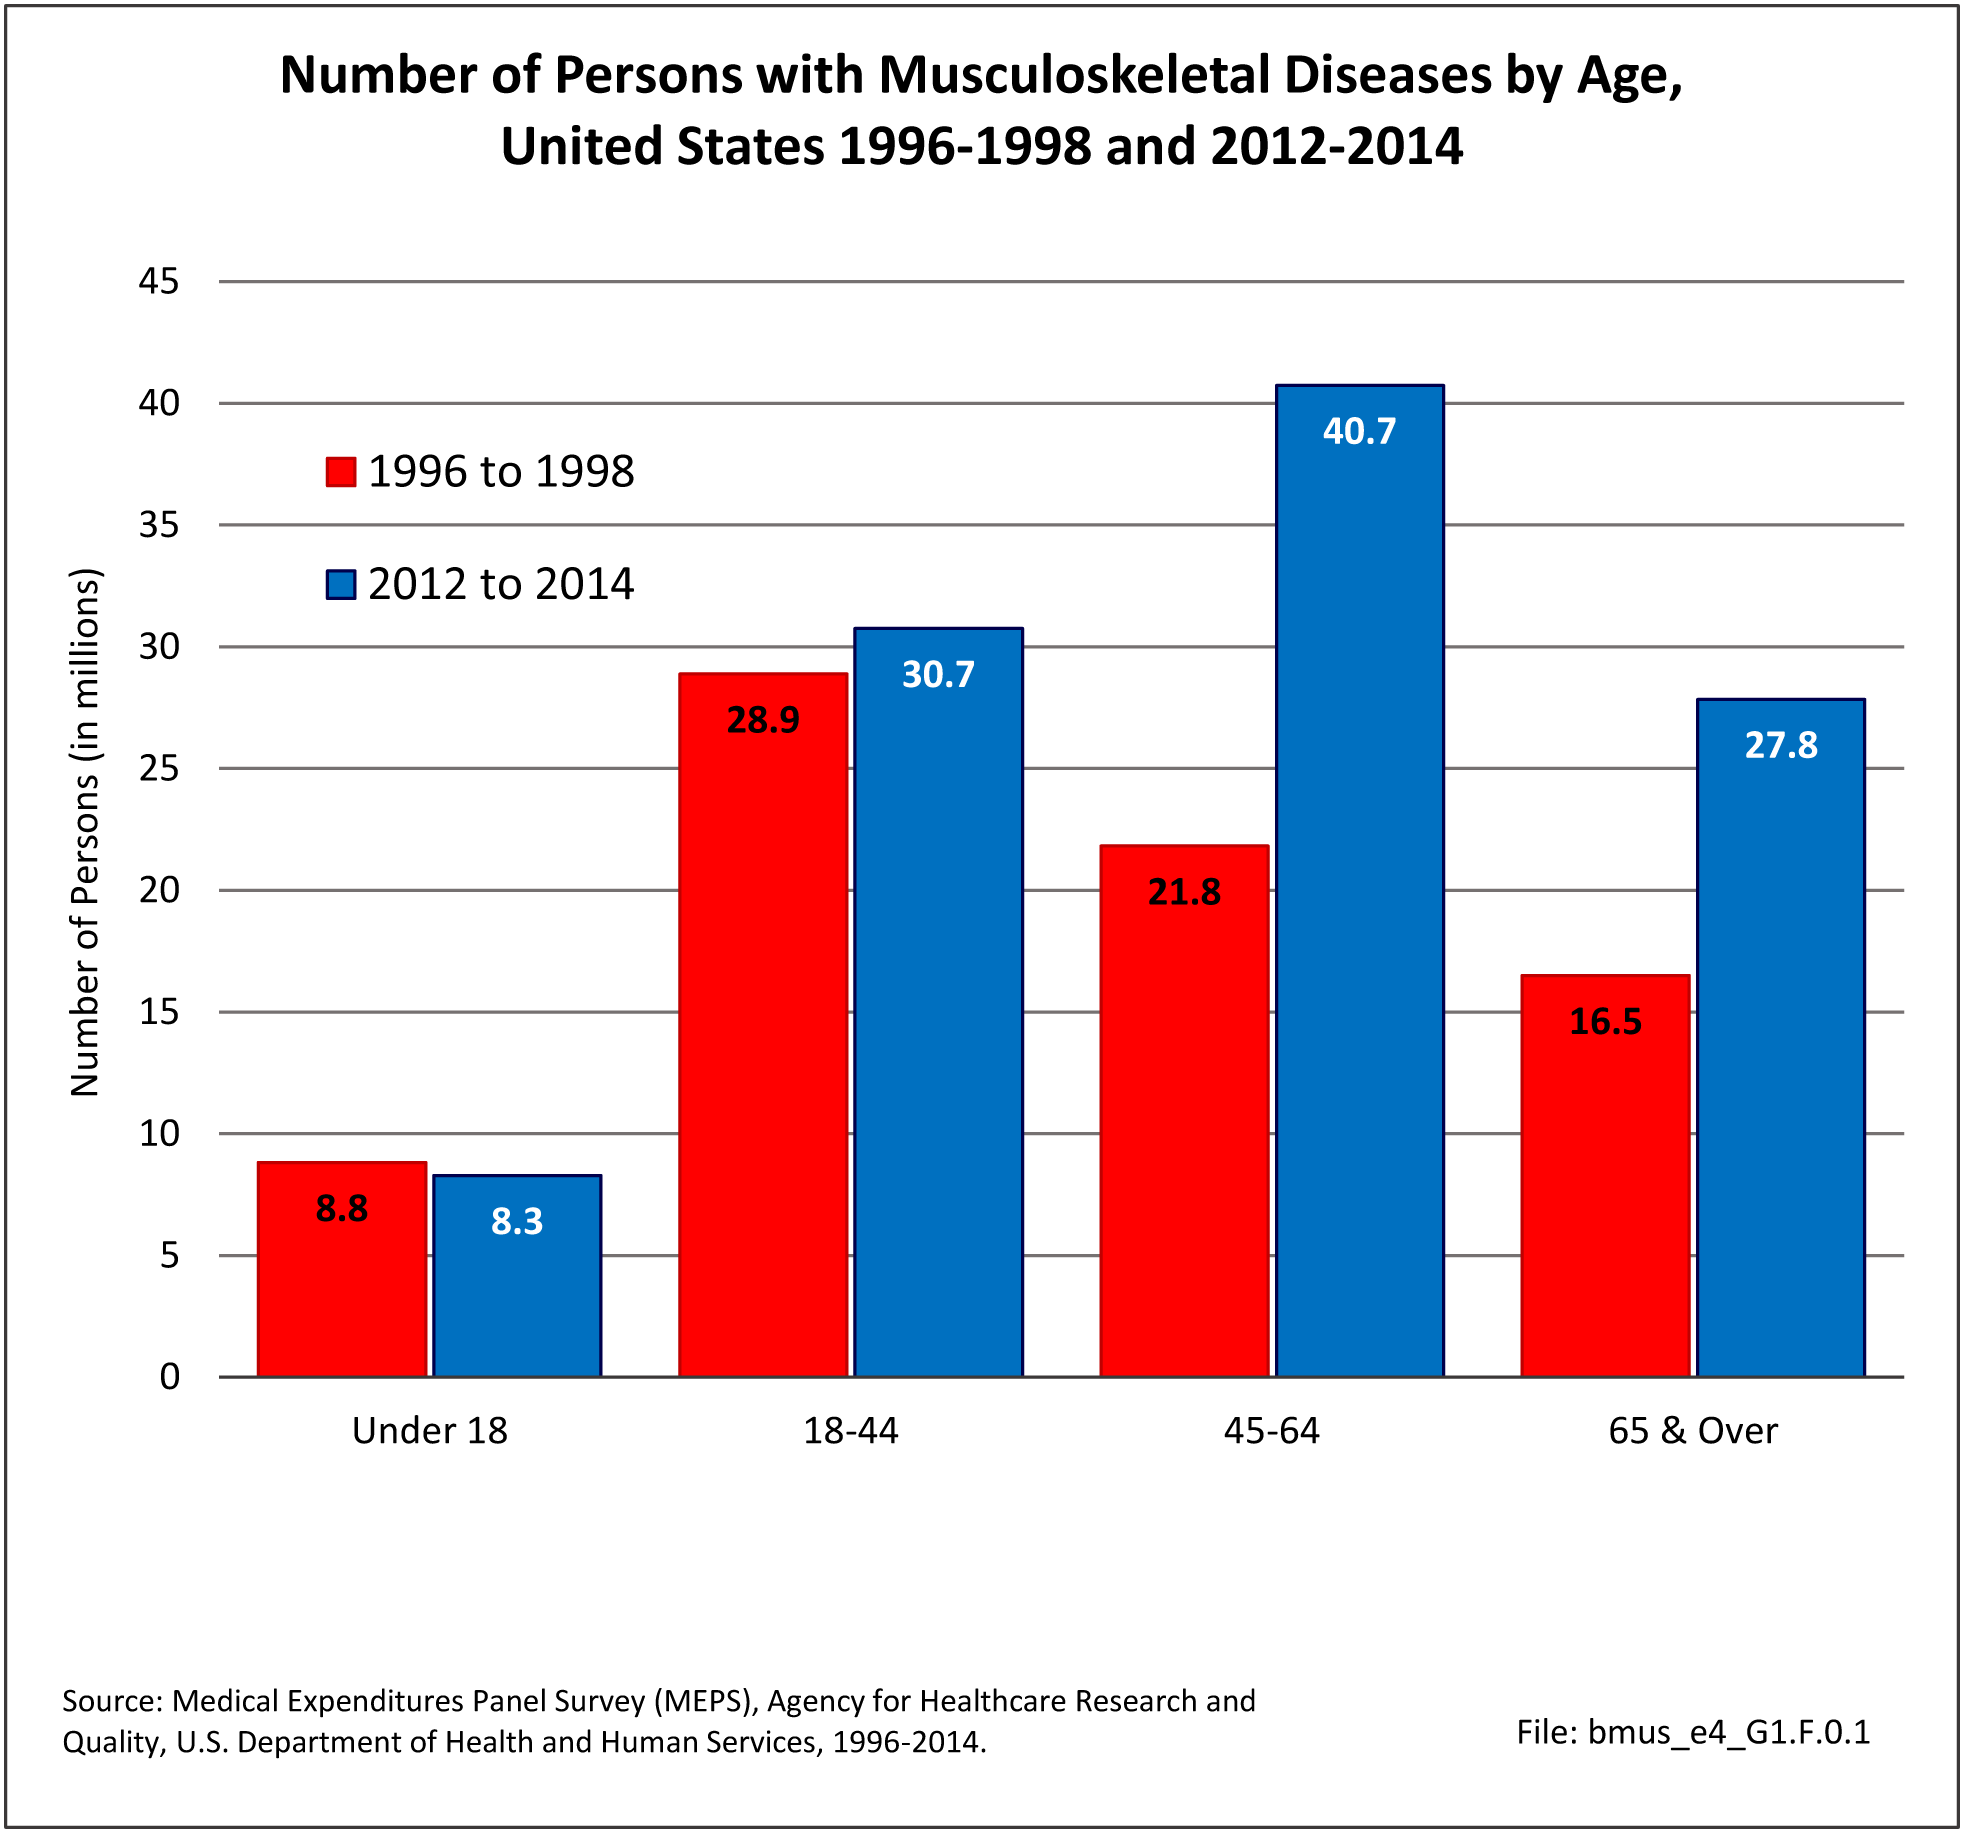
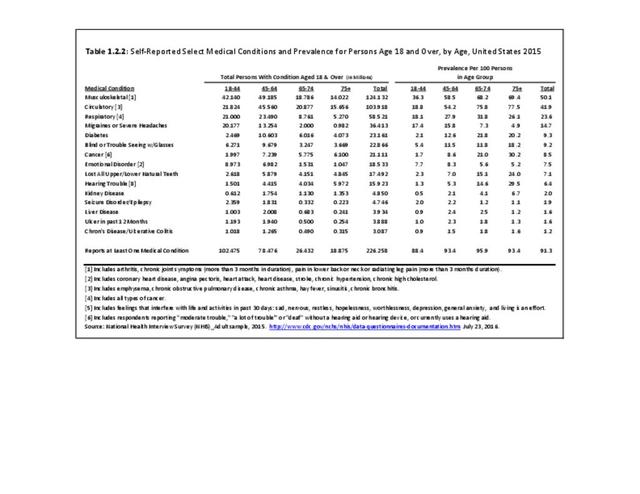
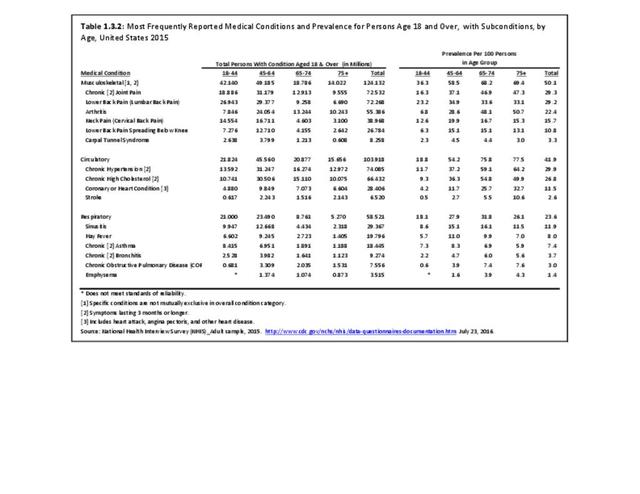
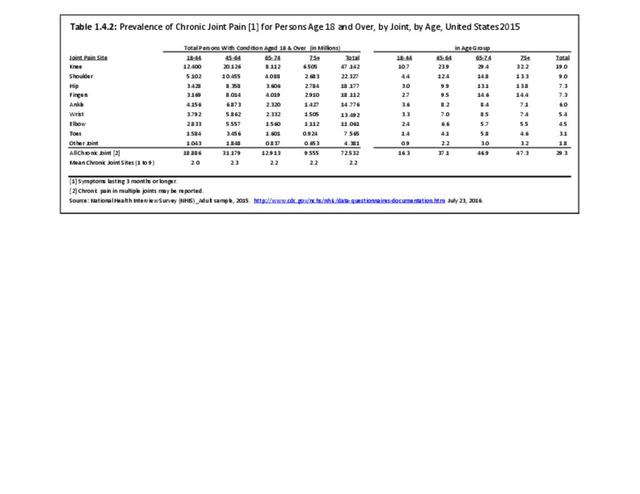
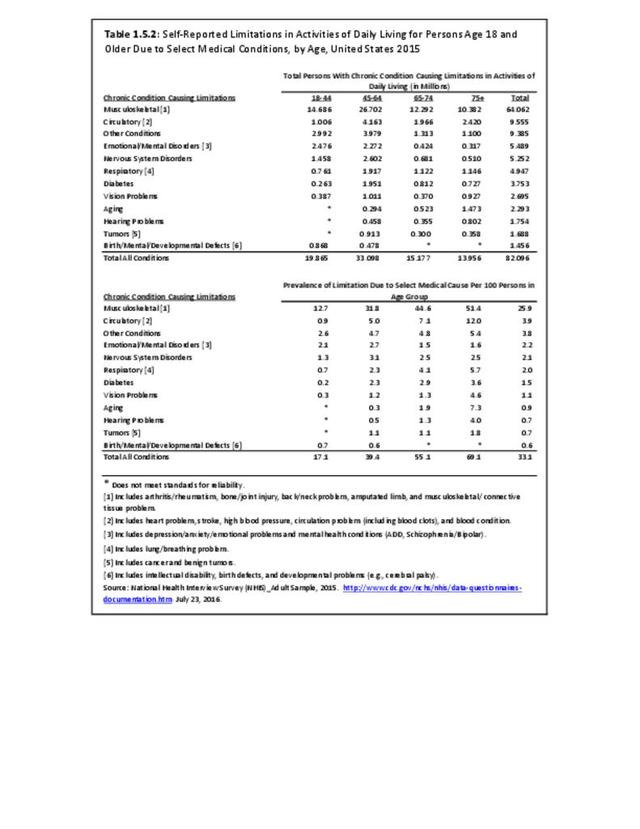
Age is a factor in many major health conditions, particularly those affecting the ability to function in daily living activities. The lower prevalence of some conditions in older age groups may be due to mortality caused by the condition in earlier age groups. By age 65, circulatory problems surpass musculoskeletal conditions slightly as hypertension, high cholesterol, and heart conditions all become more common in persons who have reached the age of 75. Respiratory conditions often have lower prevalence among older individuals, while cancer, hearing problems, and dental issues all increase after age 75. The prevalence of musculoskeletal conditions rises in the middle ages of 45 to 64, and tends to level off around age 65, creating a long period of time over which the pain and disability associated with musculoskeletal diseases impacts quality of life. (Reference Table 1.2.2 PDF CSV)

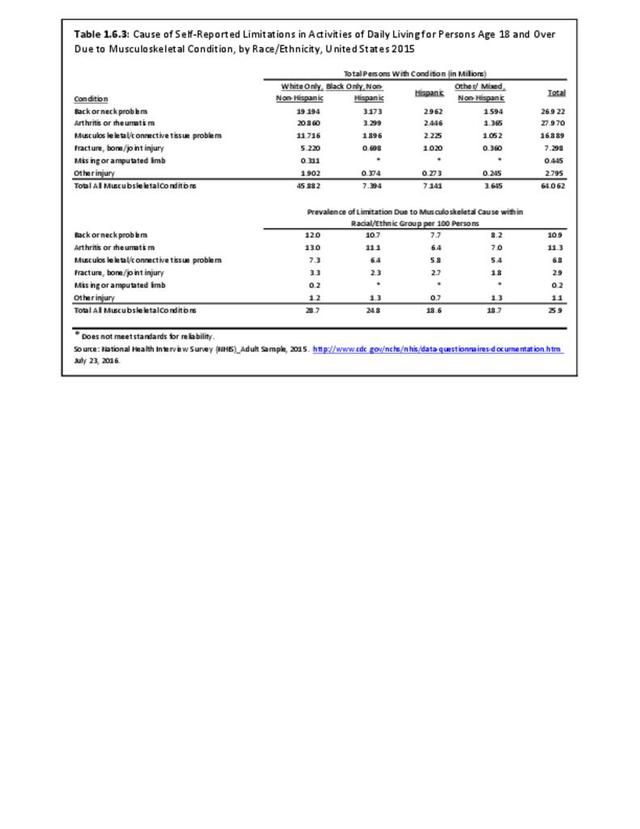
Race/Ethnicity
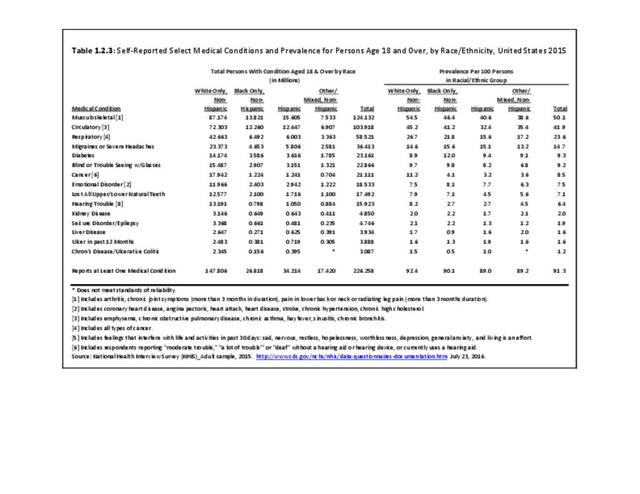
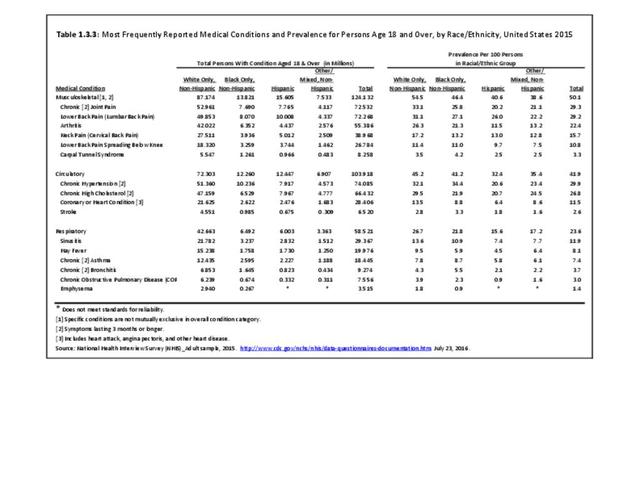
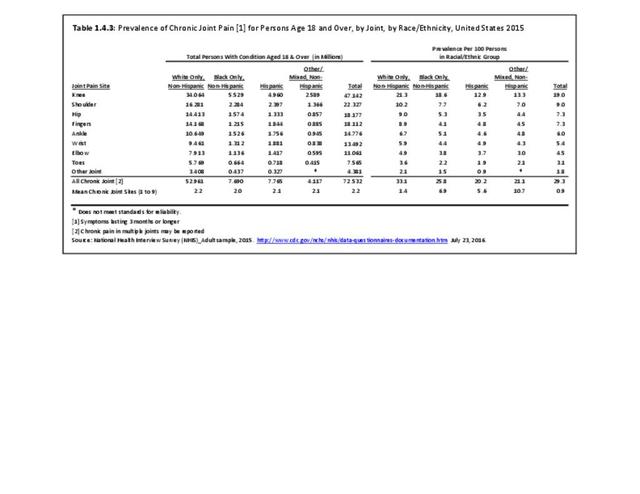
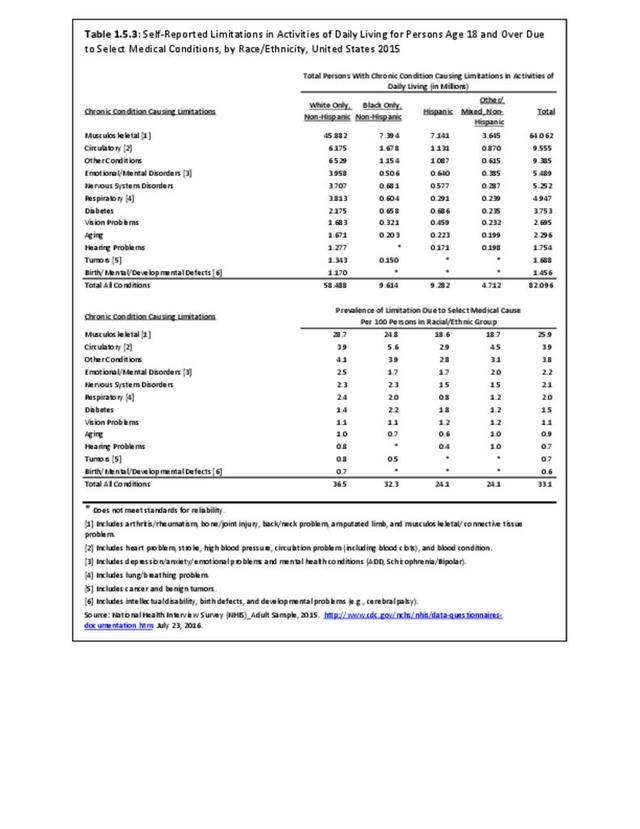
Non-Hispanic Whites have the highest prevalence of several major health disease conditions, including musculoskeletal conditions. A major exception to this rule is diabetes, a common condition; prevalence rates of diabetes are highest among non-Hispanic blacks. (Reference Table 1.2.3 PDF CSV)

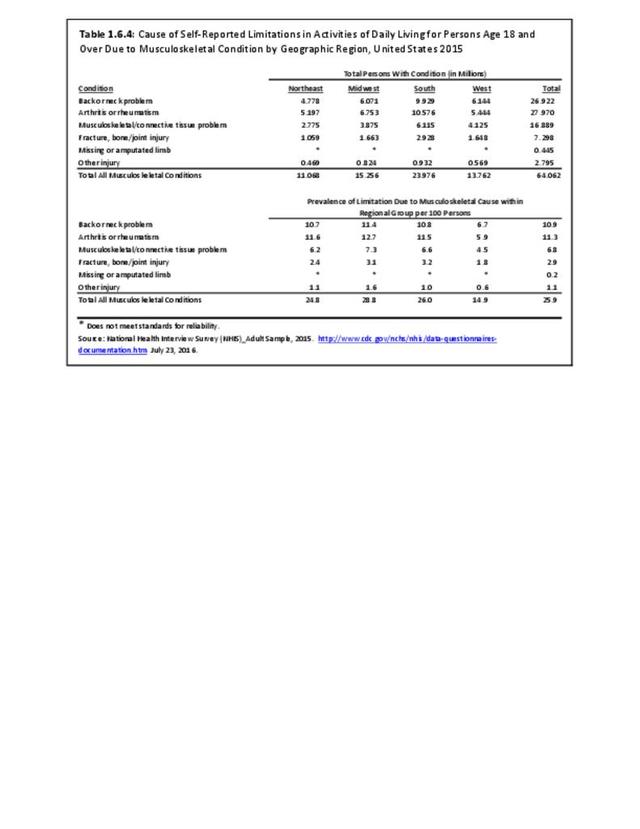
Geographic Differences
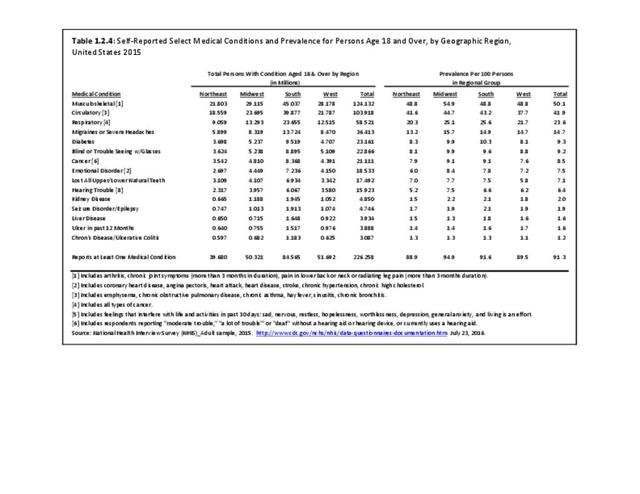
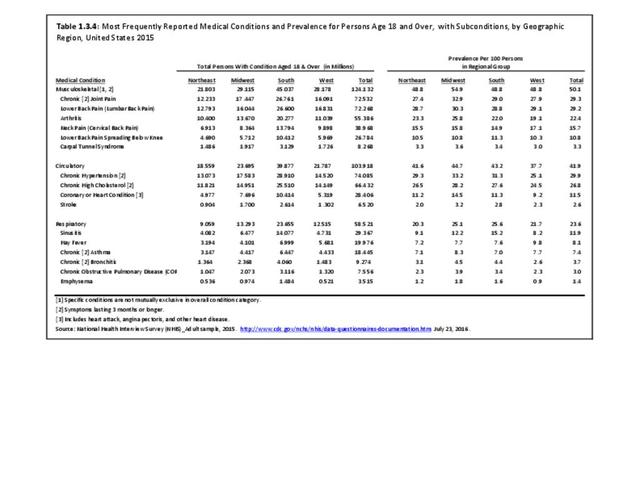
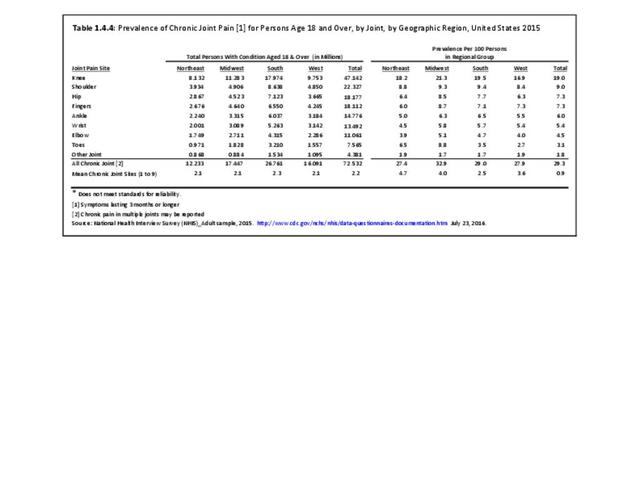
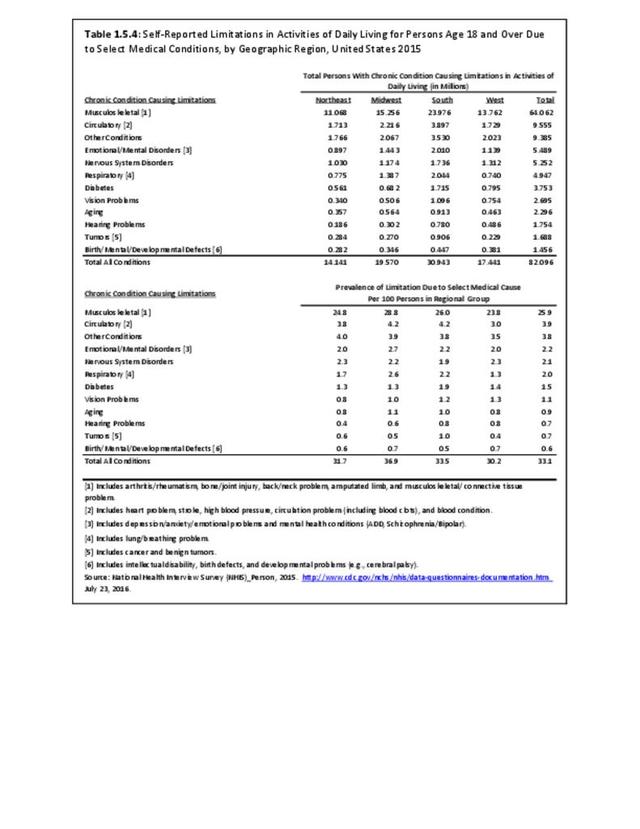
In general, residents of the Midwest region report slightly higher rates of most major health conditions while residents in the West report the lowest prevalence. Musculoskeletal conditions are reported by 54.9% of Midwest residents, and a consistent 48.8% across all other regions. The reasons why this occurs are not known, but the median age of the population is older than the West and South; however, median age is oldest in the Northeast.1 There is also a higher prevalence of musculoskeletal conditions reported in several industries than generally found in other geographical regions. These include construction/extraction, office and administrative support, healthcare practitioners and technicians, and building and grounds cleaning/maintenance industries. (Reference Table 1.2.4 PDF CSV)

Trends
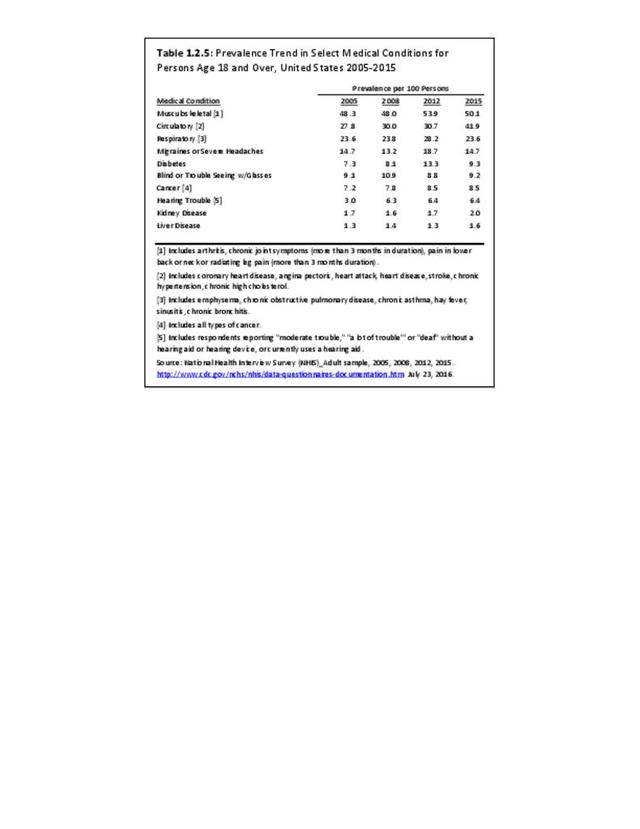
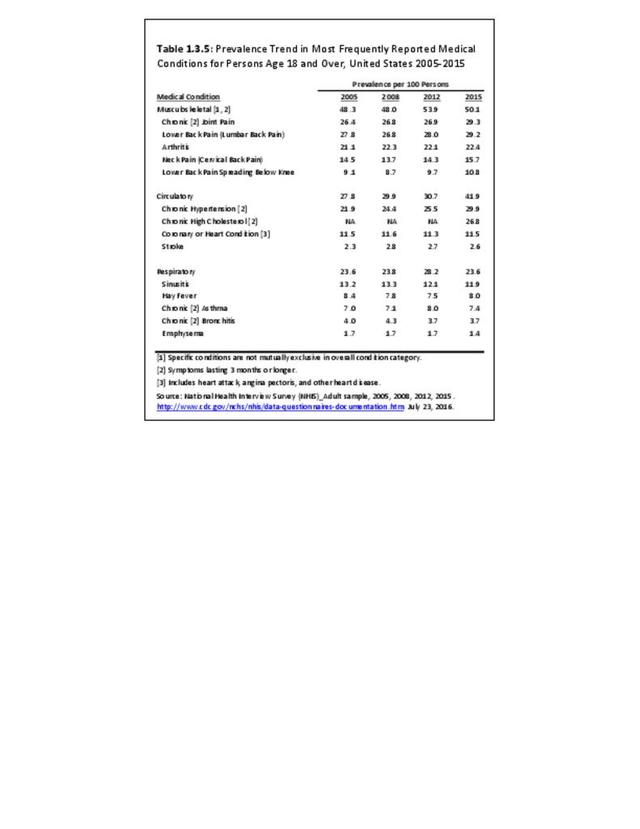
Over the past decade, the reported prevalence of the most common health diseases has not changed. Reported prevalence in 2012 for several conditions was greater than in 2015, but additional years of data will be needed to determine if this is an actual slowing of these conditions. Circulatory related conditions increased significantly between 20112 and 2015, but this was primarily related to the increase in chronic hypertension, and the addition of chronic high cholesterol to the category. Musculoskeletal diseases continue to lead all medical conditions in prevalence. (Reference Table 1.2.5 PDF CSV)
- 1. United States Census Bureau. American Fact Finder. ACS Demographic and Housing Estimates: 2010-2014 American Community Survey 5-Year Estimates. https://factfinder.census.gov/faces/nav/jsf/pages/index.xhtml Accessed August 15, 2016.
Edition:
- Fourth Edition