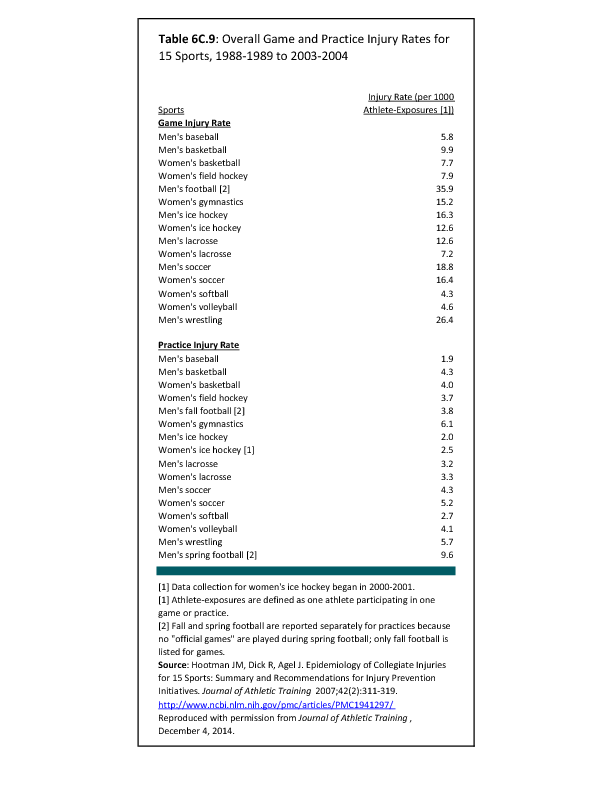
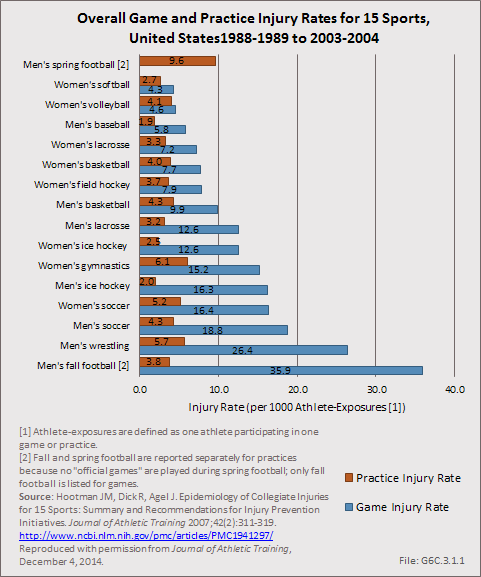
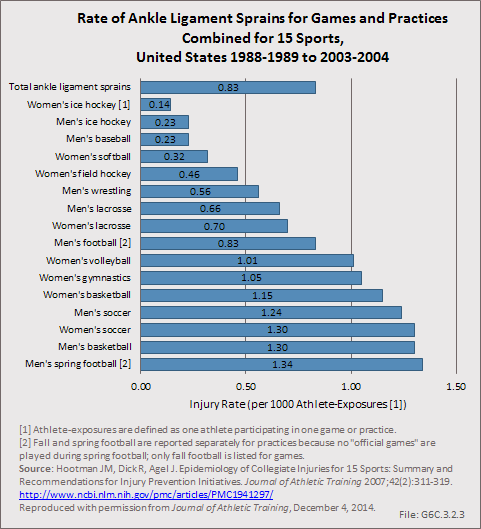
Overall, incidence rates for the 15 sports examined range from a high of 35.9 per 1,000 game athlete exposures for men’s football to a low of 1.9 for men’s practice basketball. Among men, the highest injury rates were observed in football, wrestling, soccer, and ice hockey. Among women, the highest injury rates were experienced in soccer, gymnastics, ice hockey, and field hockey. (Reference Table 6C.9 PDF CSV)
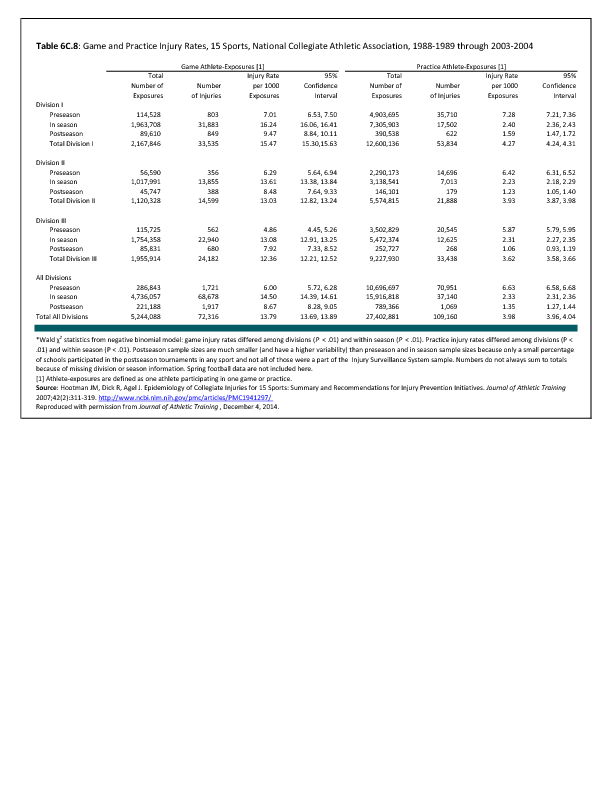
When data for all 15 sports are combined, injury rates are significantly higher in games (13.8 injuries per 1,000 athlete exposures) when compared to practice (4.0 injuries per 1,000 athlete exposures). Pre-season practice injury rates were significantly higher when compared to in-season or post-season training sessions. (Reference Table 6C.8 PDF CSV)
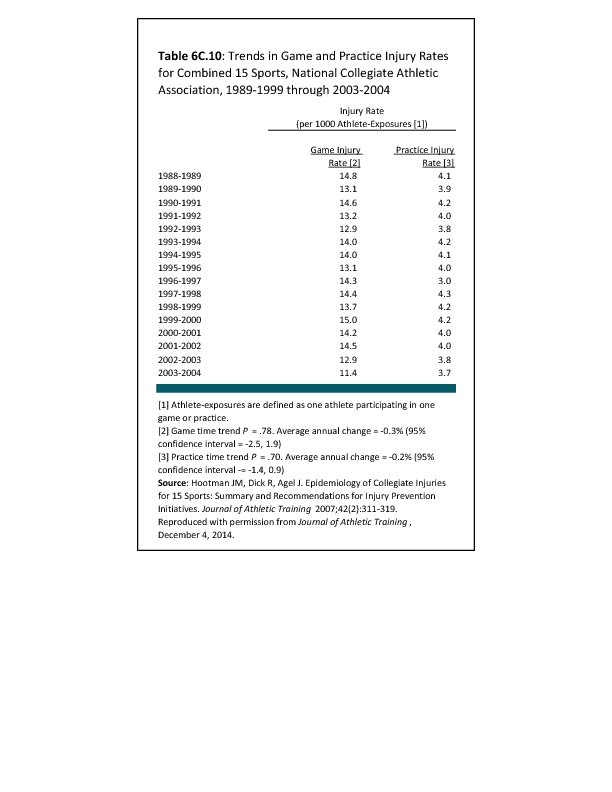
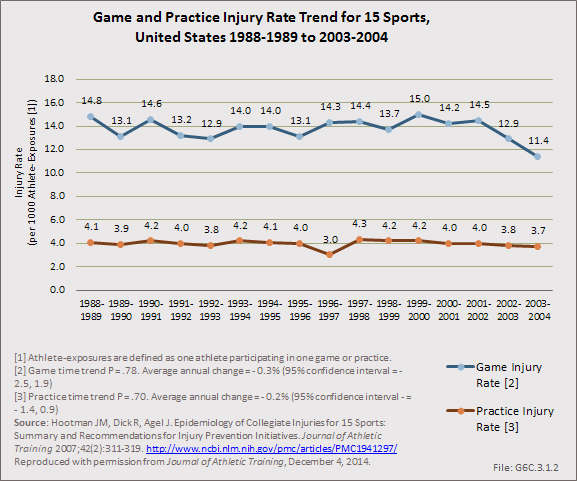
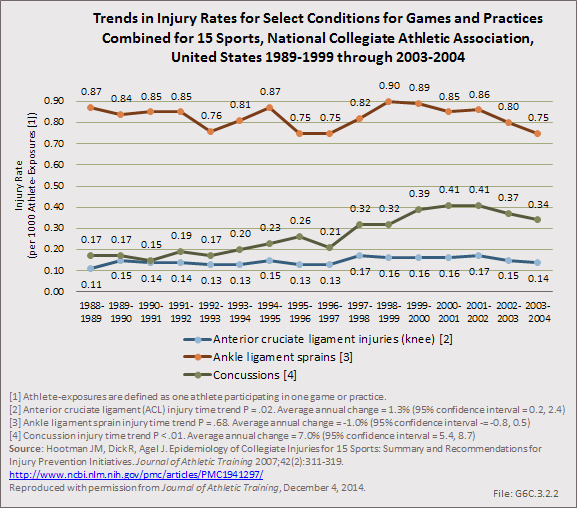
Combined injury rates for all 15 NCAA sports studied remained relatively stable over time. No significant changes were observed in injury rates during games or practices over the 16-year study period. (Reference Table 6C.10 PDF CSV)
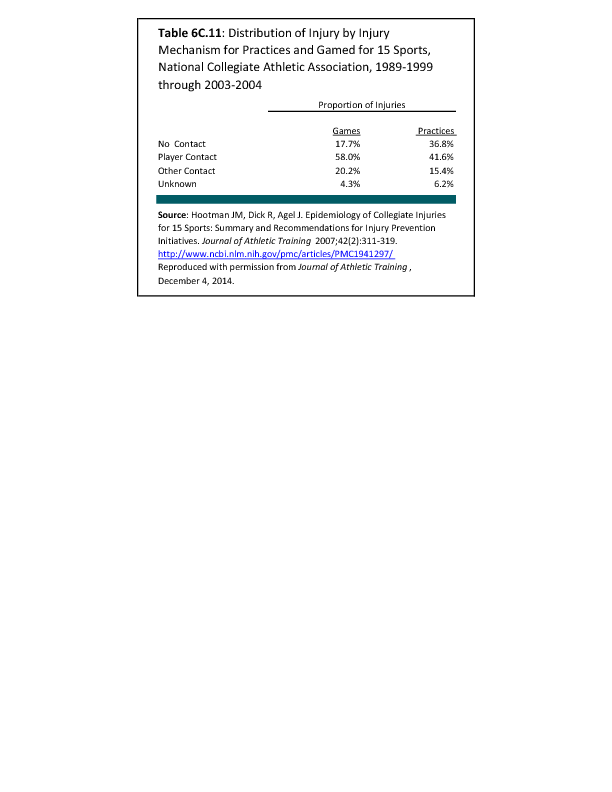
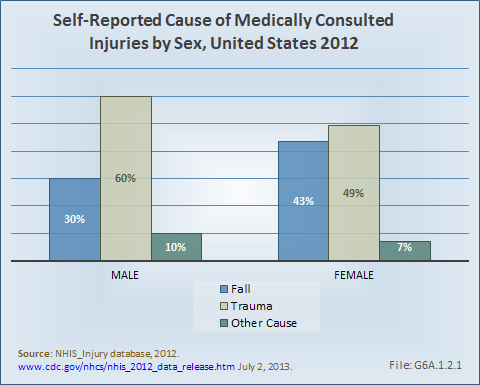
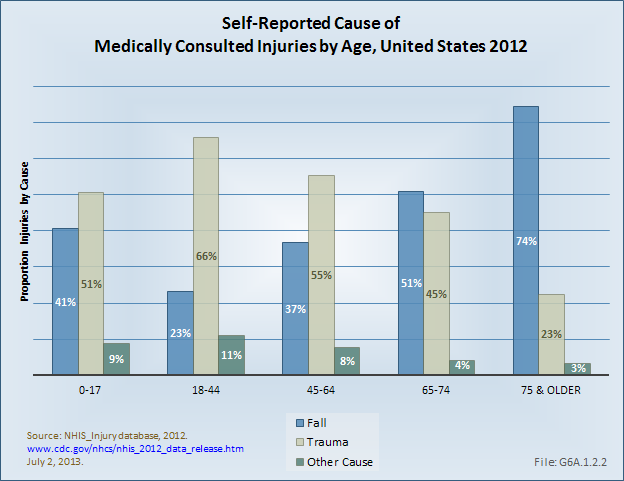
The majority of injuries resulted from contact with another player, regardless of whether or not injuries were sustained in practices or games. (Reference Table 6C.11 PDF CSV)
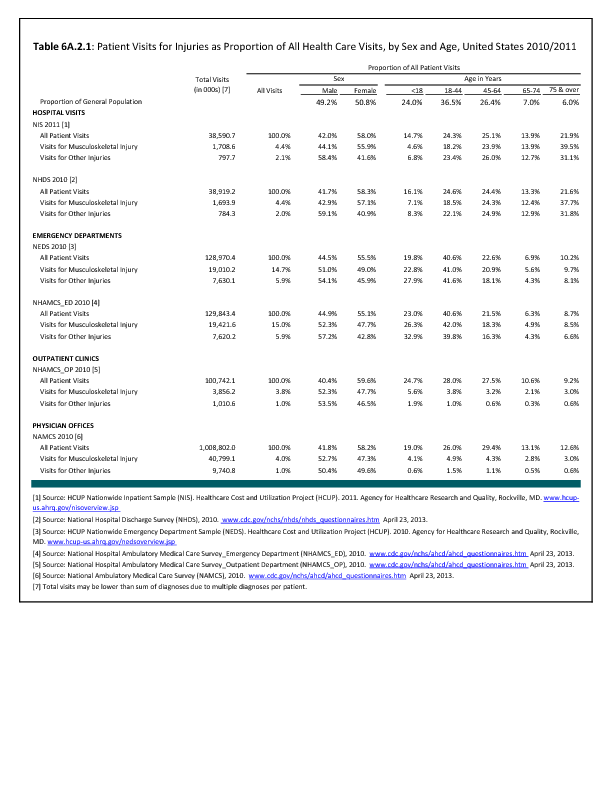
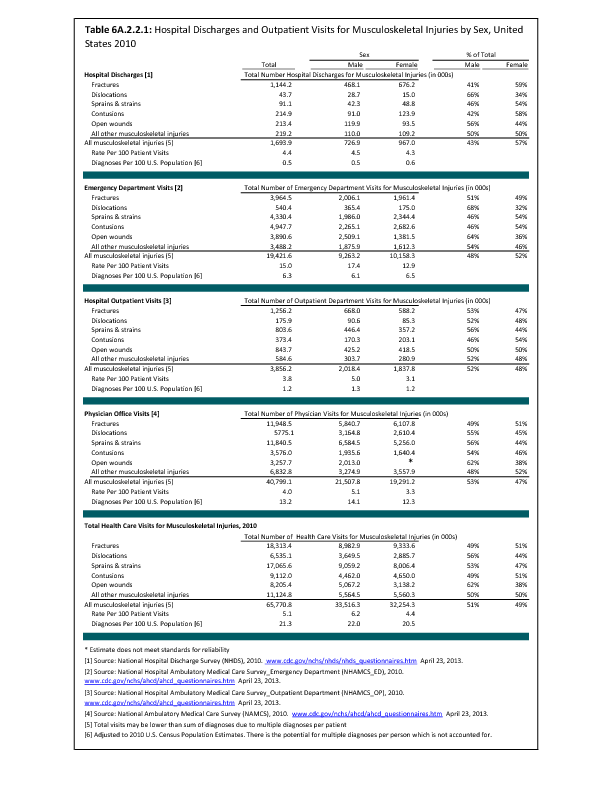
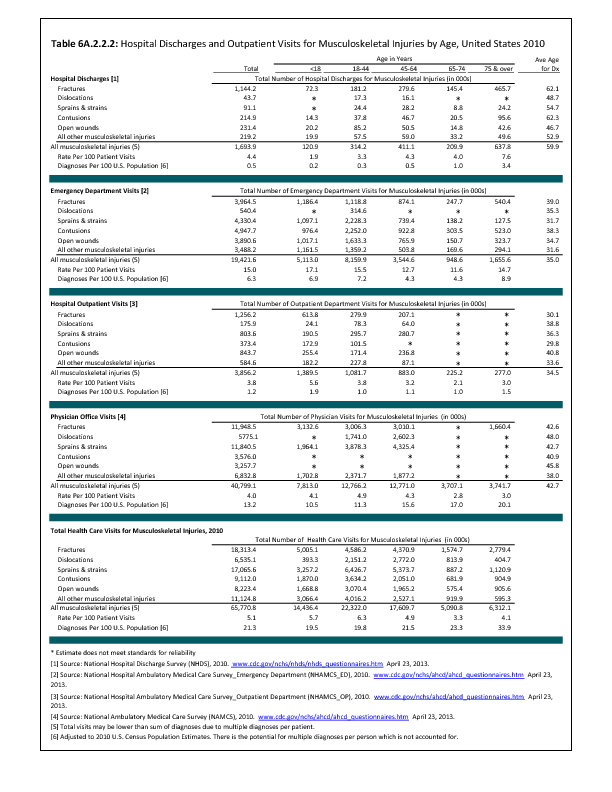
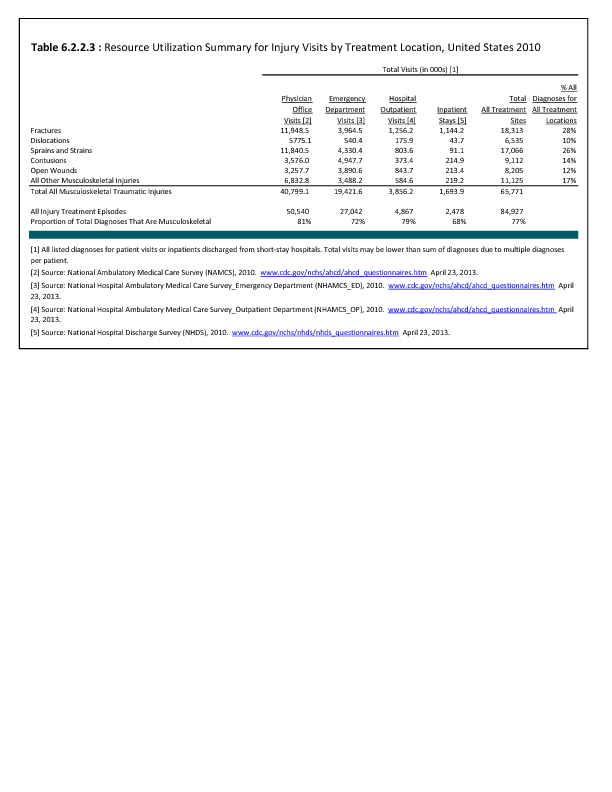
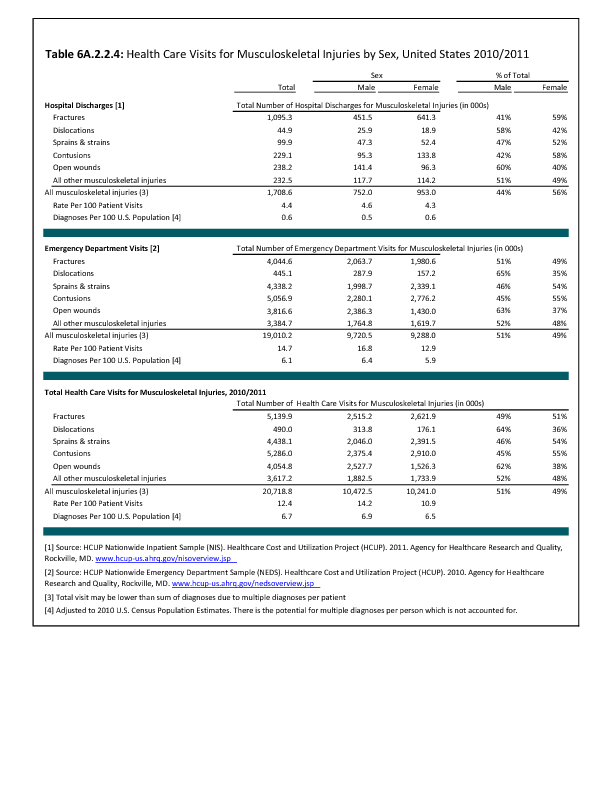
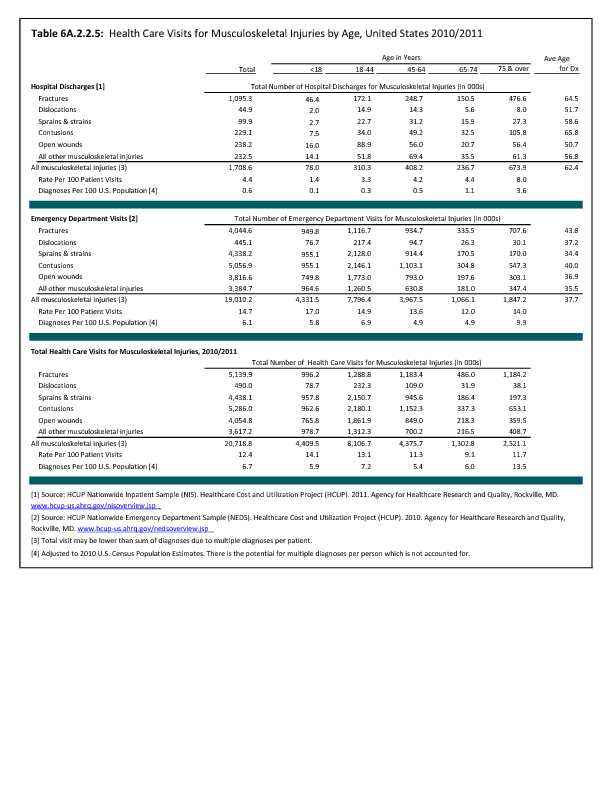
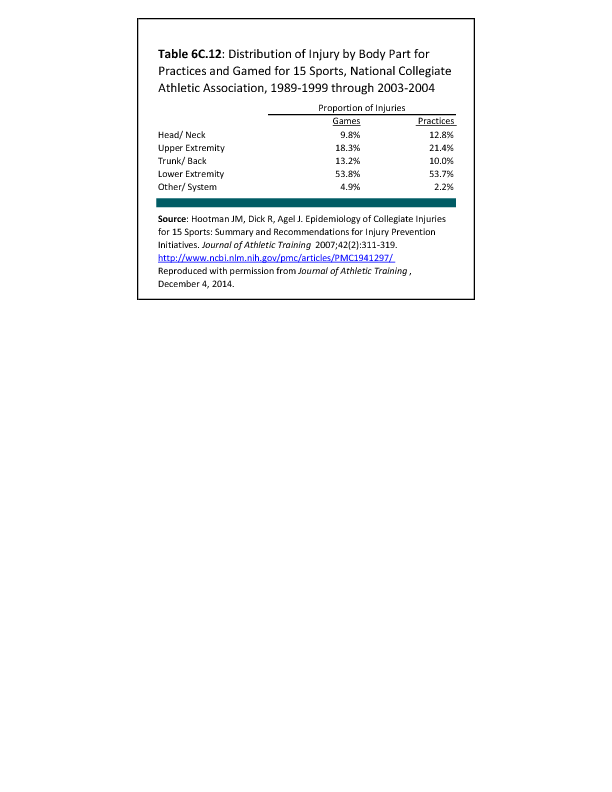
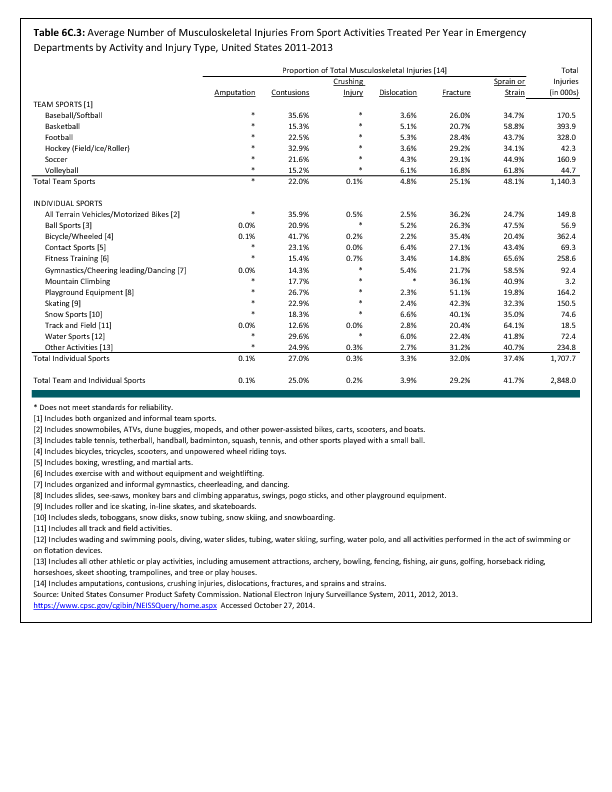
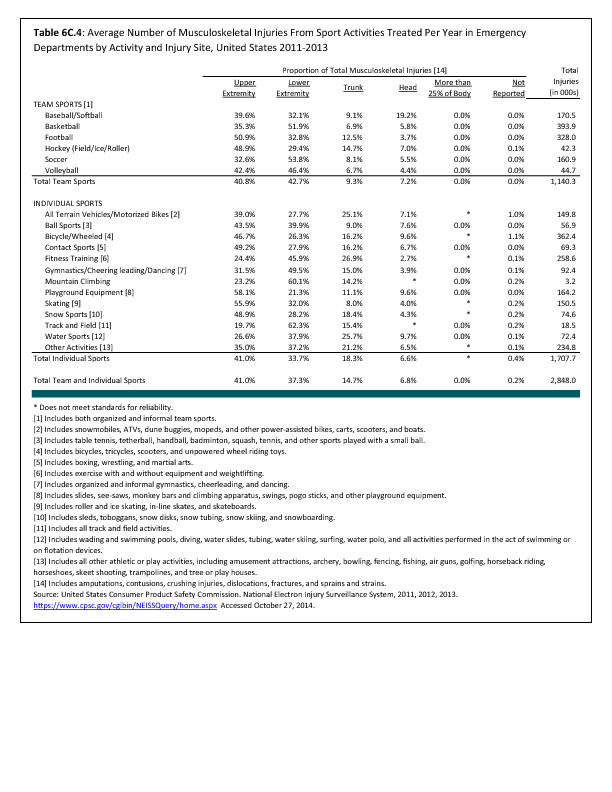
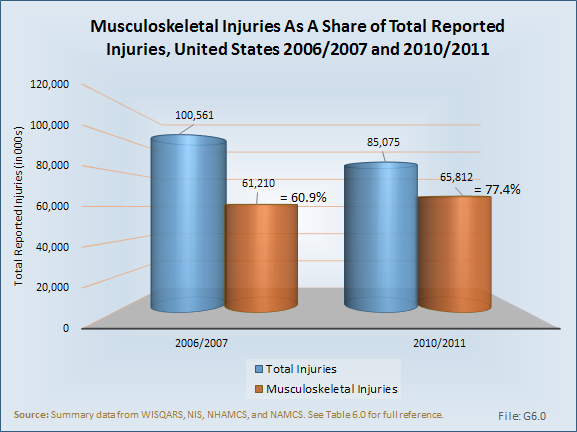
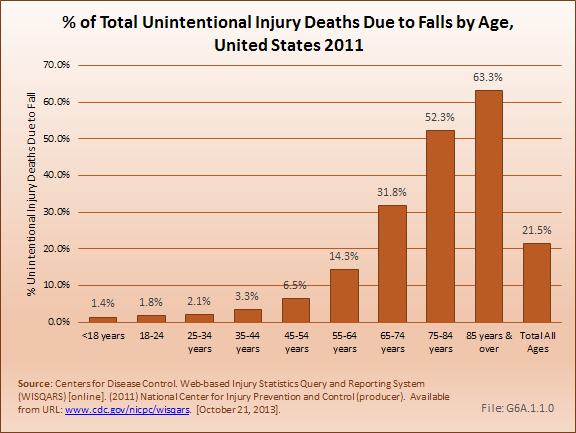
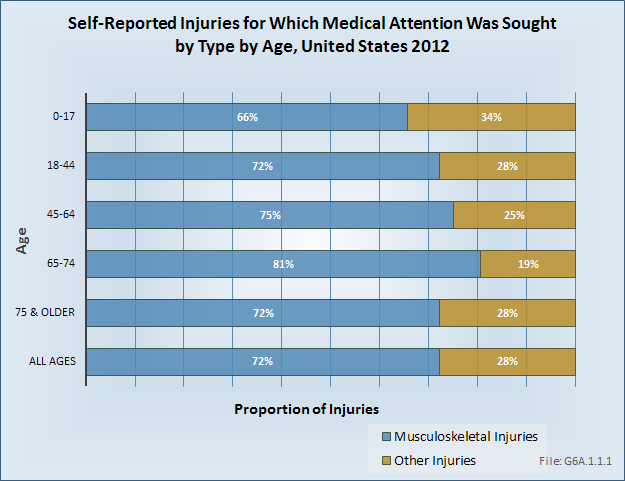
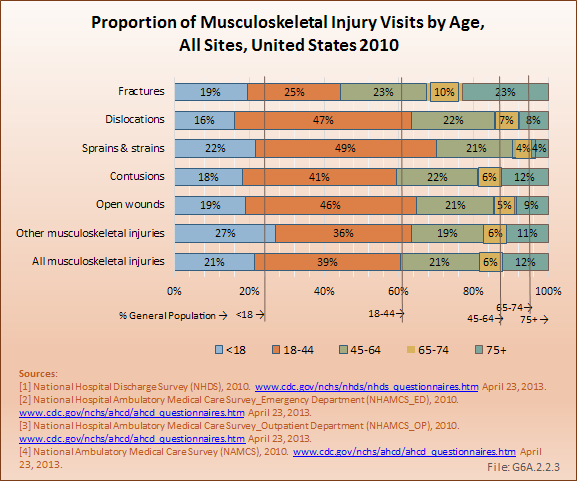
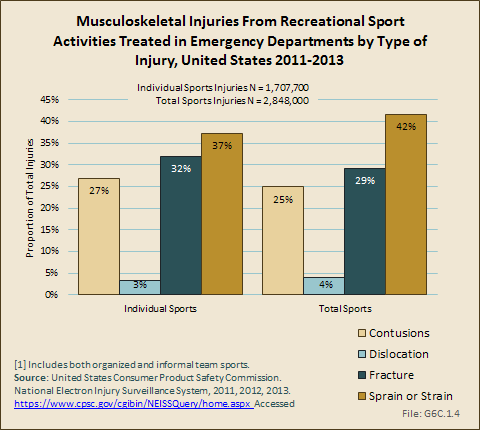
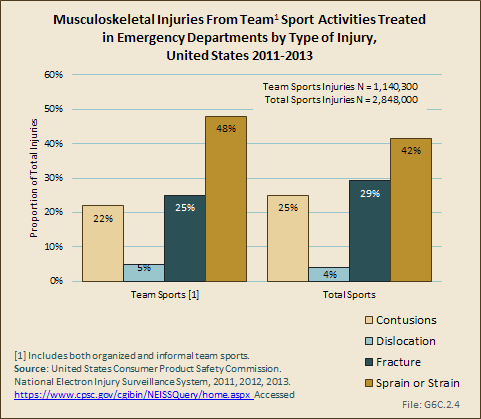
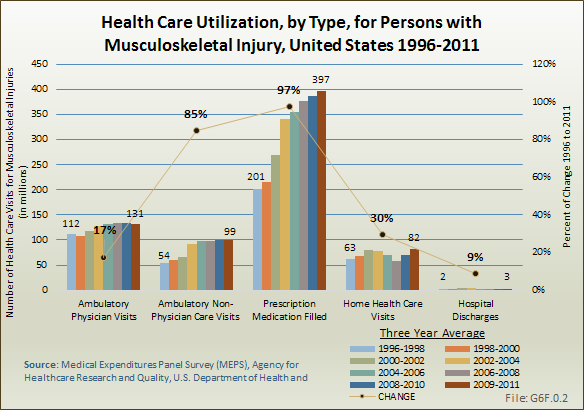
The majority of injuries documented during the study period affected the musculoskeletal system, with 72% of all injuries in games and 75% of all injuries in practices affecting the extremities. Regardless of whether injuries occurred in practices or games, more than one-half of all injuries reported across the 15 sports examined during the study period were to the lower extremity. (Reference Table 6C.12 PDF CSV)
Edition:
- 2014


 Download as CSV