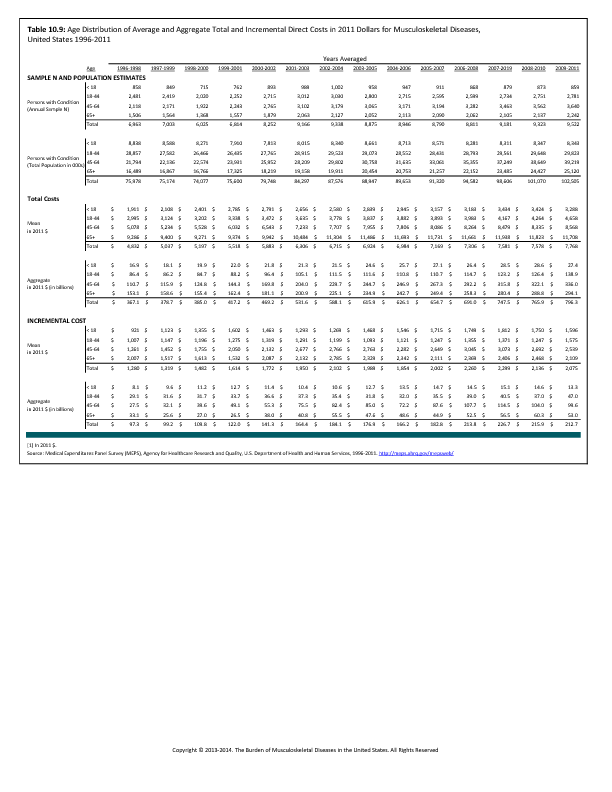
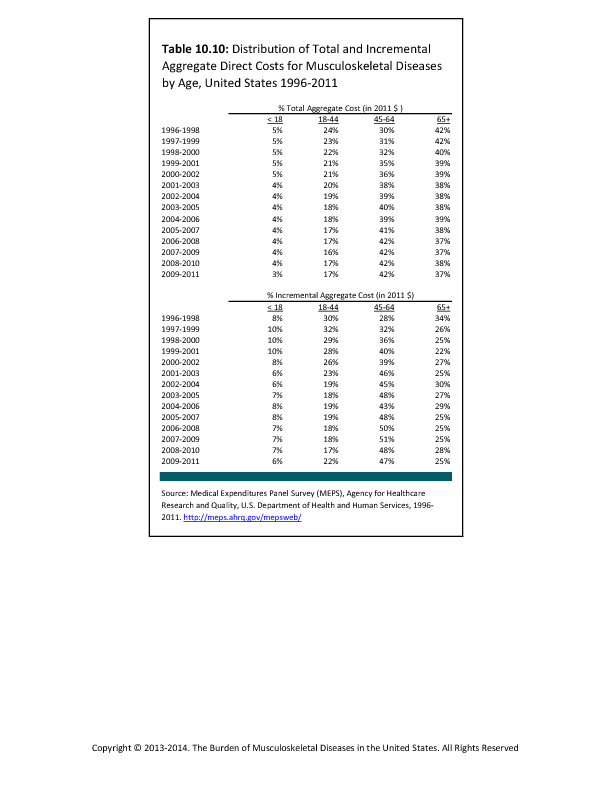
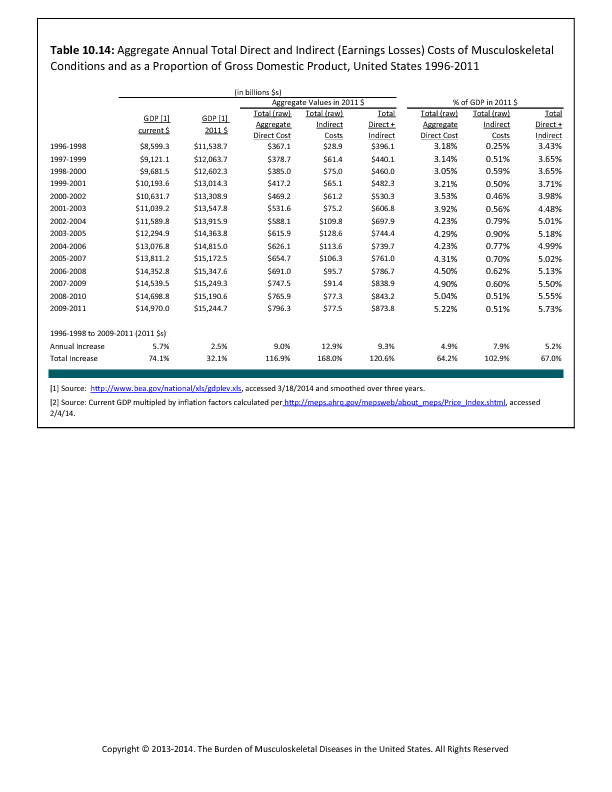
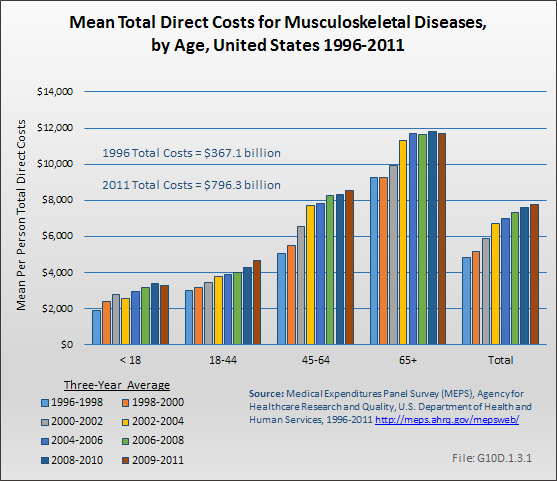
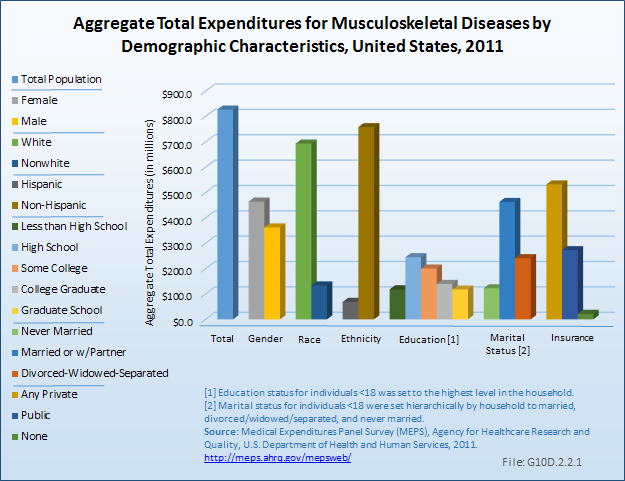
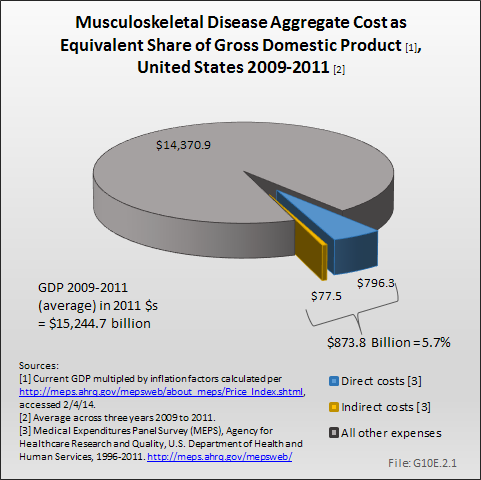
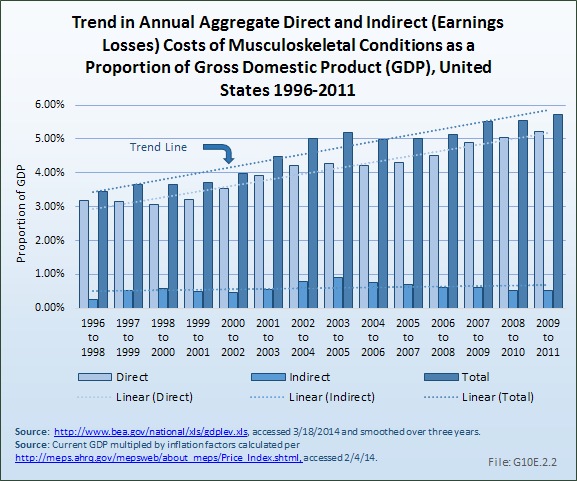
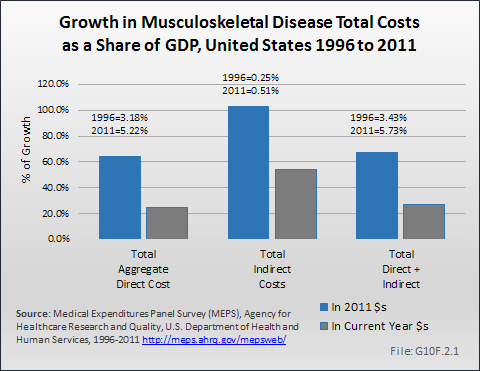
Aggregate total expenditures increased from $367.1 billion to $796.3 billion, in 2011 dollars, during this time frame, or more than doubling. In 1996 to 1998, aggregate total expenditures for persons with a musculoskeletal disease, whether for musculoskeletal disease or other conditions, represented 3.2% of the GDP in 2011 dollars. By 2009 to 2011, the proportion had grown to 5.2% of the GDP.
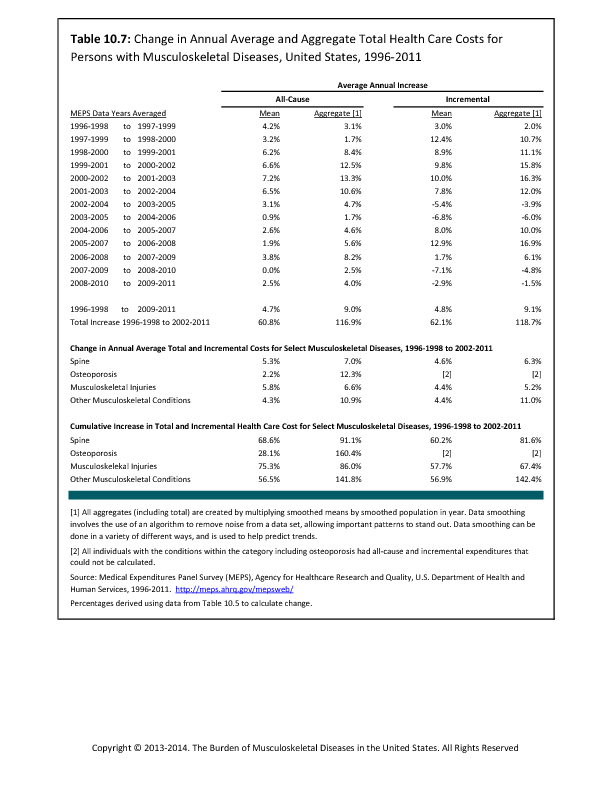
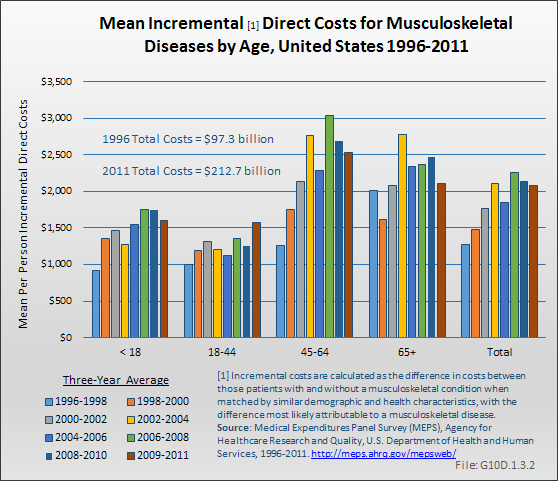
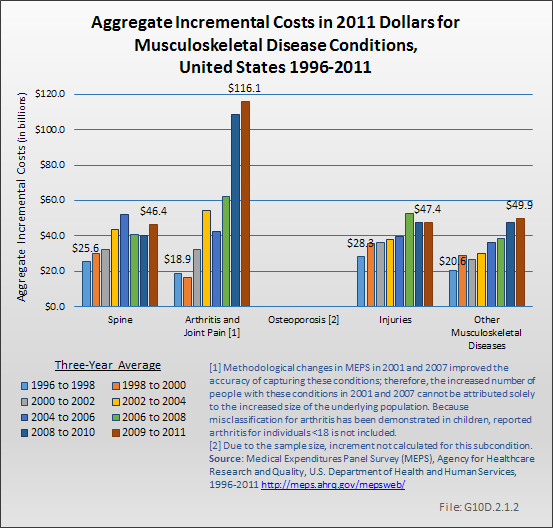
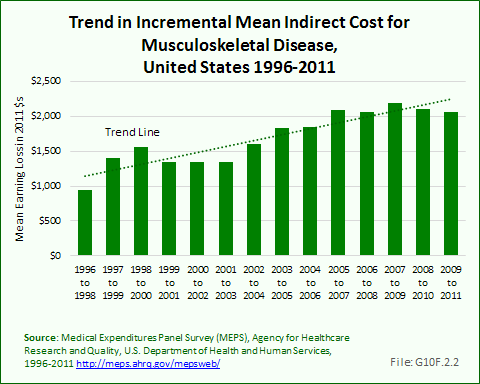
Aggregate incremental expenditures, due to the higher number of persons with a musculoskeletal condition and the increased incremental expenditures per person, increased from $97.3 billion in 1996-1998 to $212.7 billion, in 2009 to 2011 when expressed in constant (2011) dollars, or by about 119%. Incremental cost associated with a musculoskeletal condition represented the equivalent of 0.25% and 0.5% of the GDP in 2011 dollars, for the respective time frames.
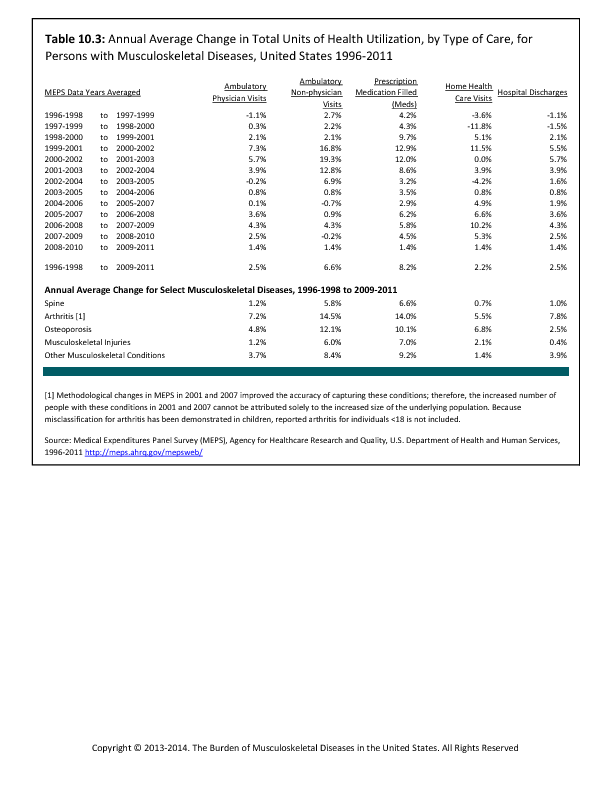
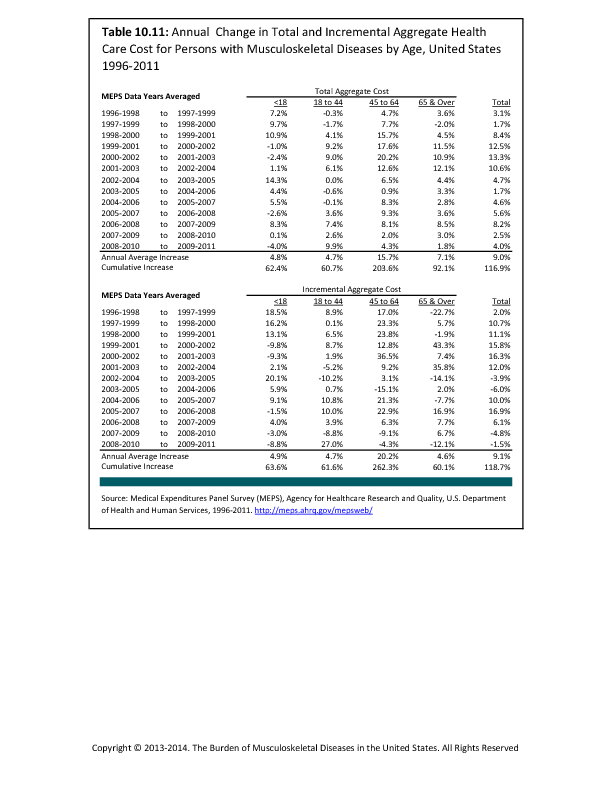
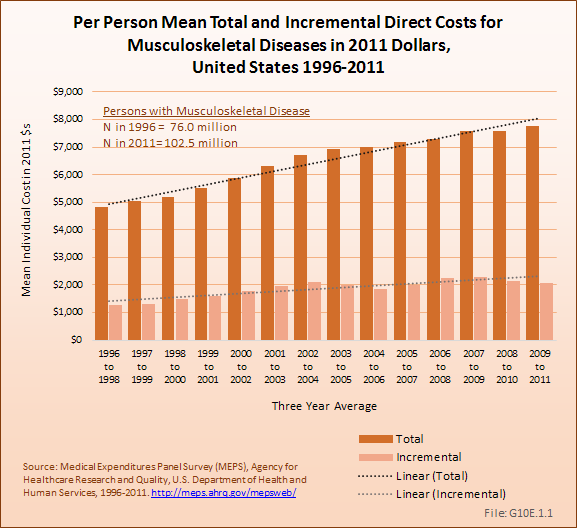
Over the full time range of 1996 to 1999 through 2009 to 2011, the annual average rate of increase in total and incremental costs for musculoskeletal diseases has been 9%. (Reference Table 10.7 PDF CSV; Table 10.9 PDF CSV; Table 10.11 PDF CSV; Table 10.14 PDF CSV)
Edition:
- 2014


 Download as CSV