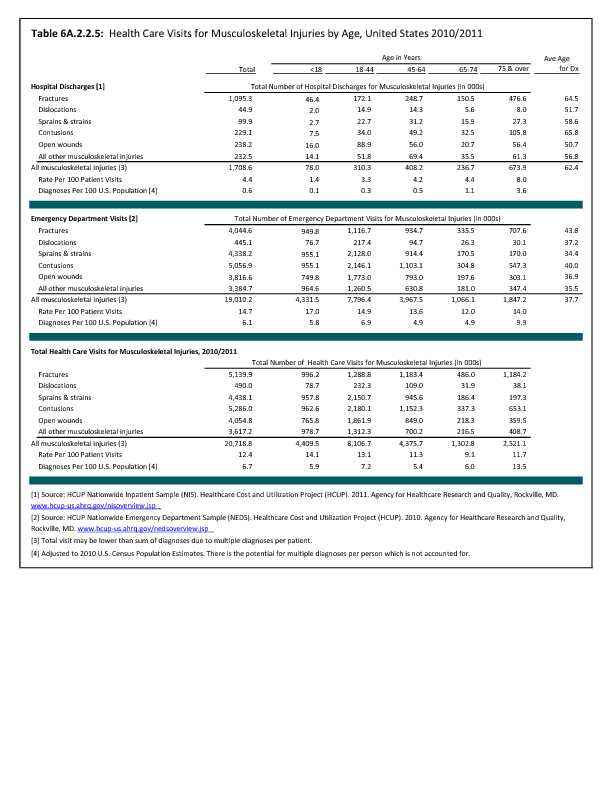
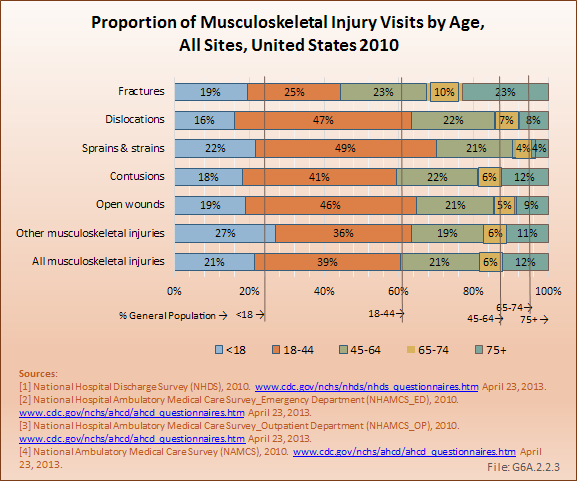
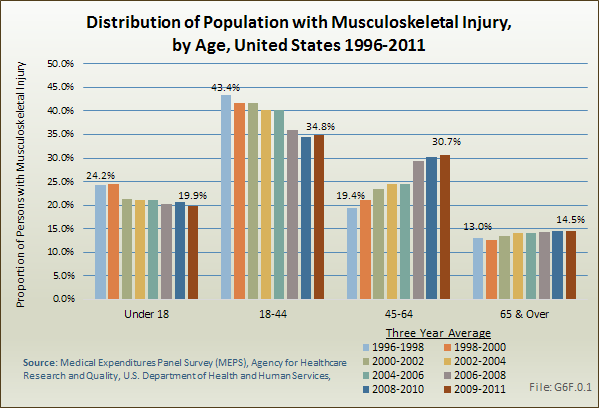
Between the years 1996-1998 and 2009-2011, the number of persons in the population reporting a musculoskeletal injury rose only slightly, from 23.4 million to 24.8 million, resulting in a slight decline in the proportion of the population with a musculoskeletal injury (8.6% to 8.0%). However, the distribution of the population with a musculoskeletal injury, by age group, showed a consistent shift upward as the population ages, reflecting the overall aging of the US population. Persons in the 44- to 64-year age group showed the sharpest increase. (Reference Table 10.1 PDF CSV)
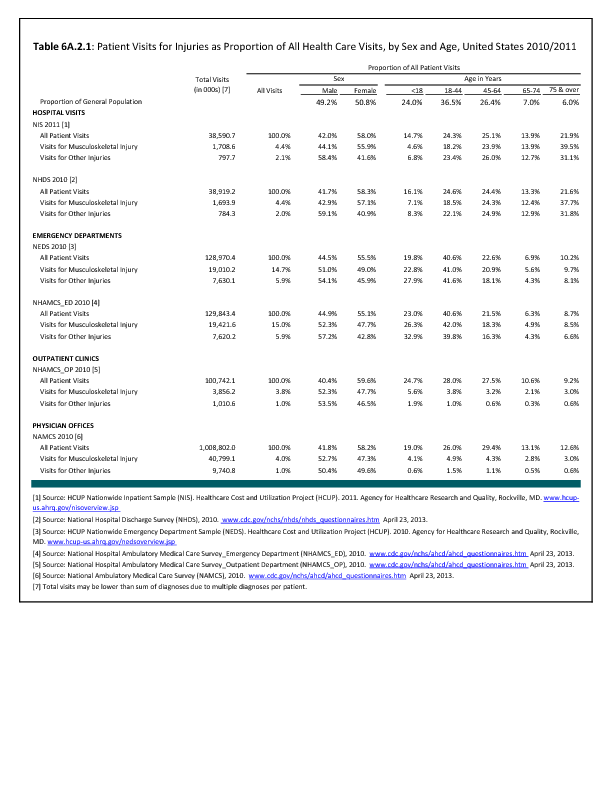
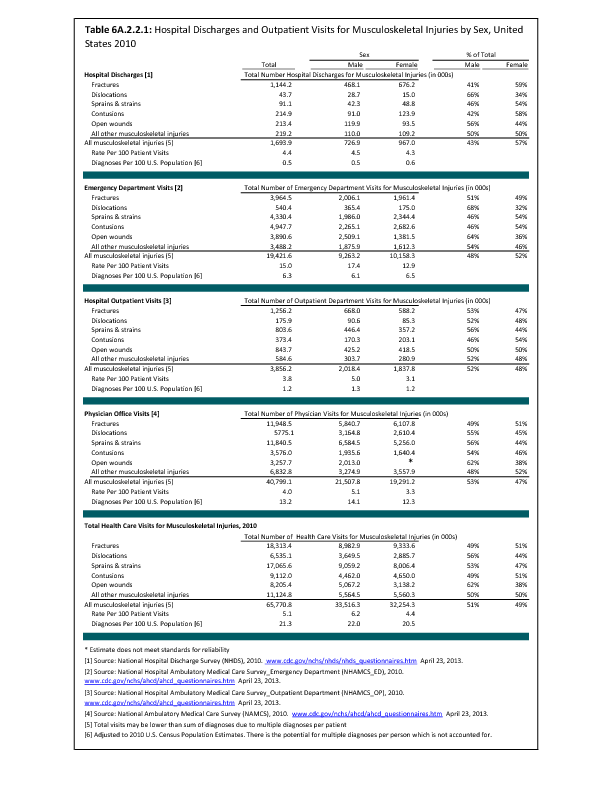
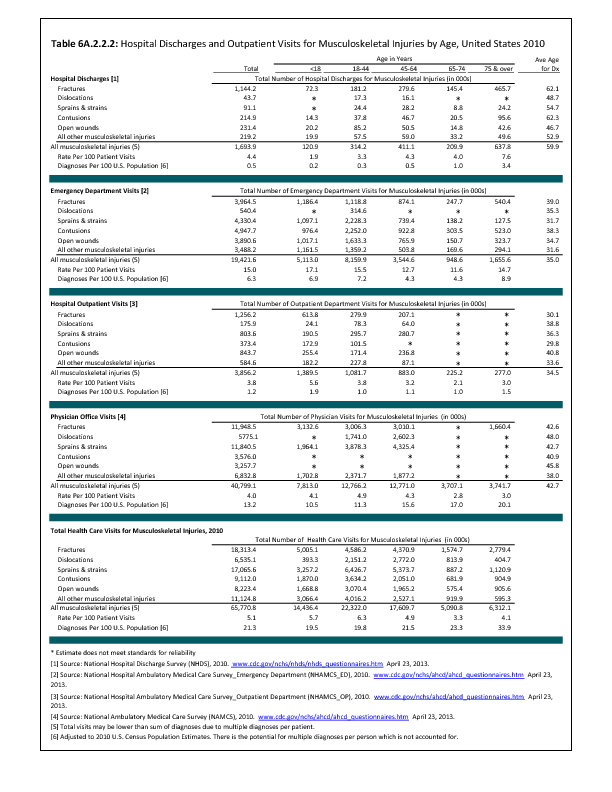
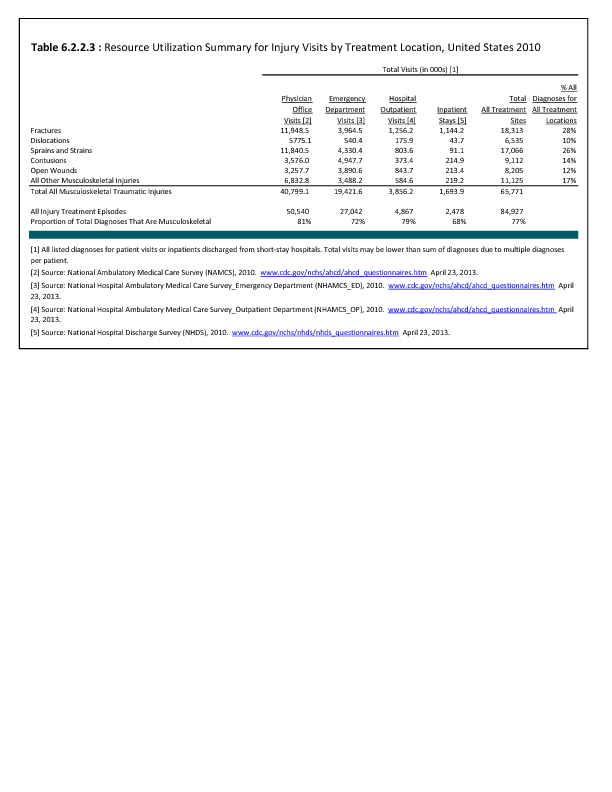
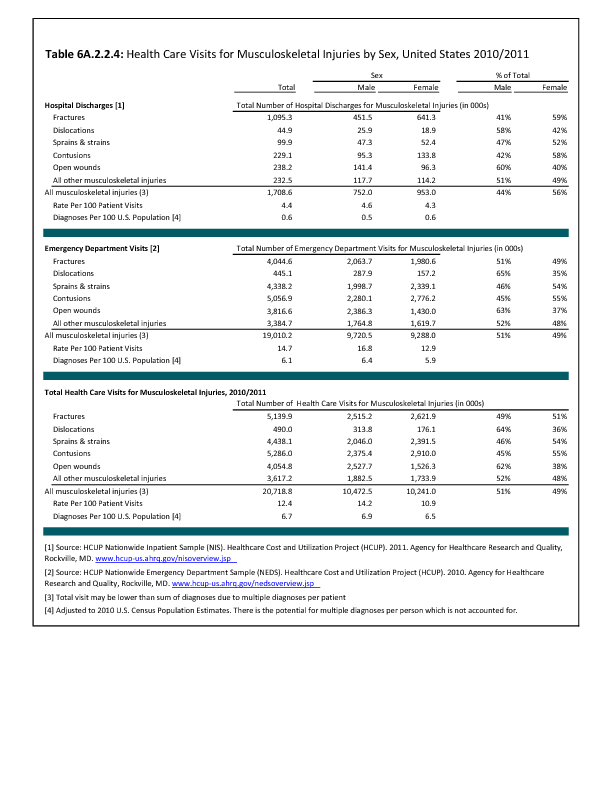
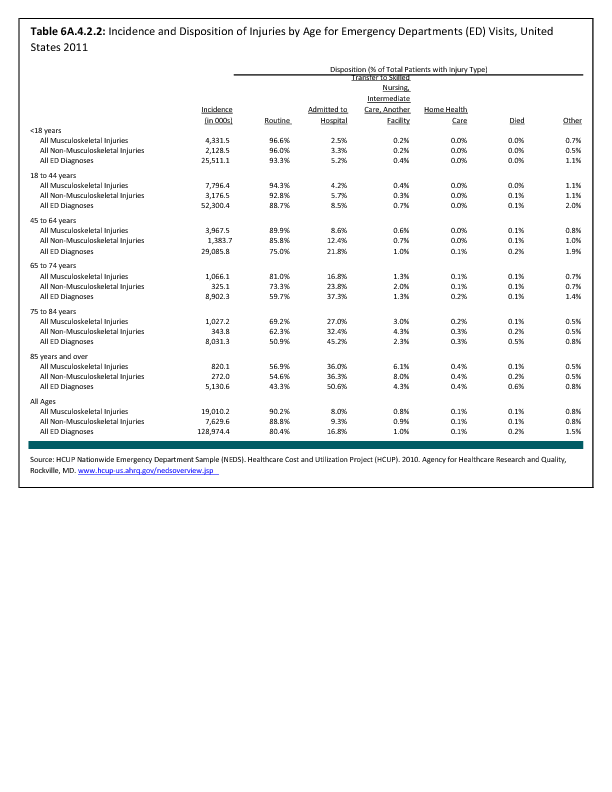
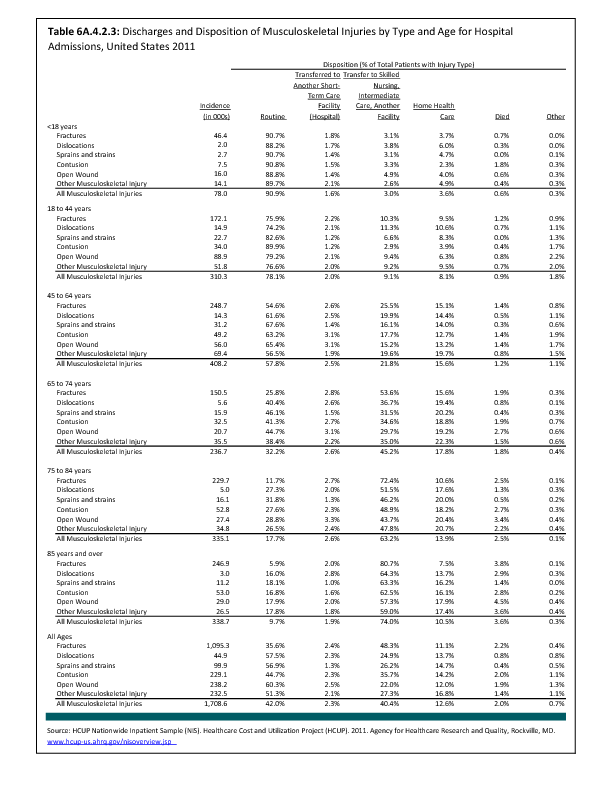
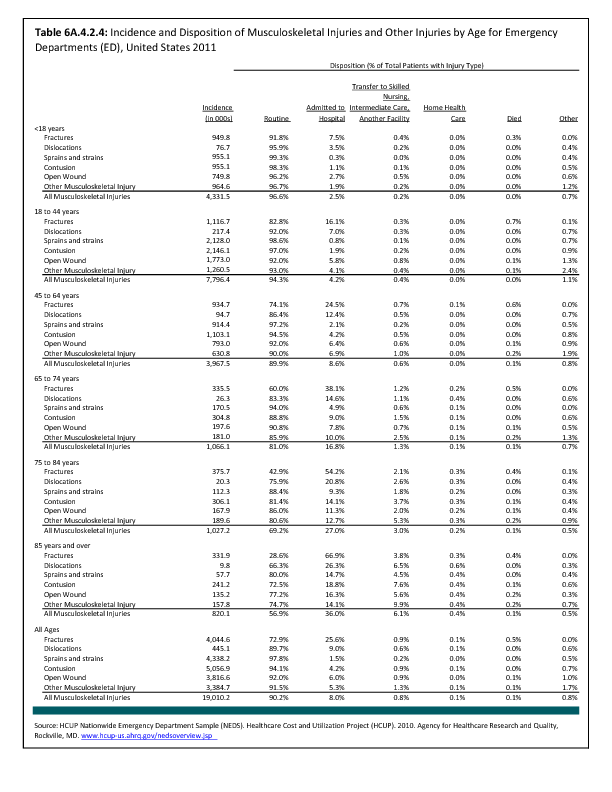
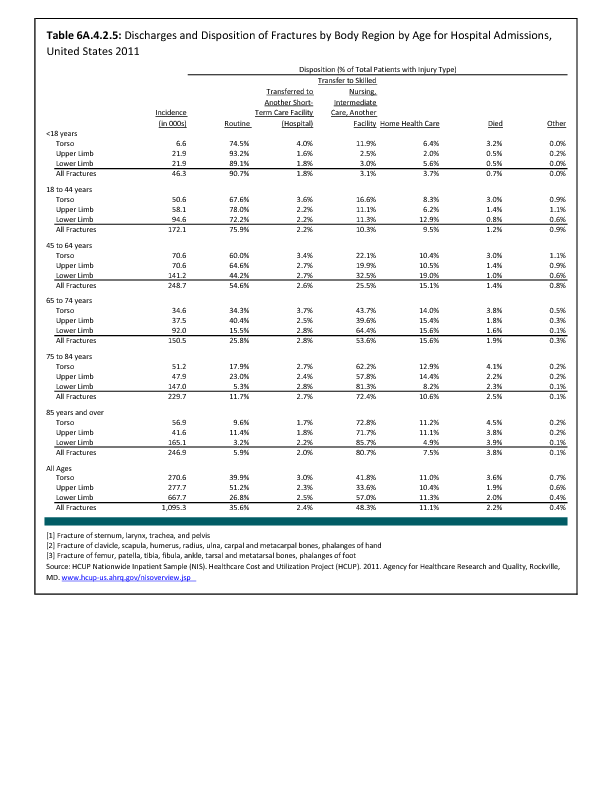
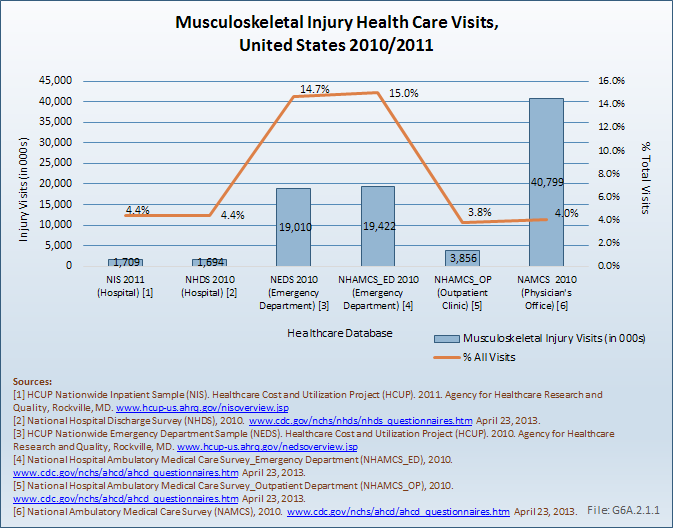
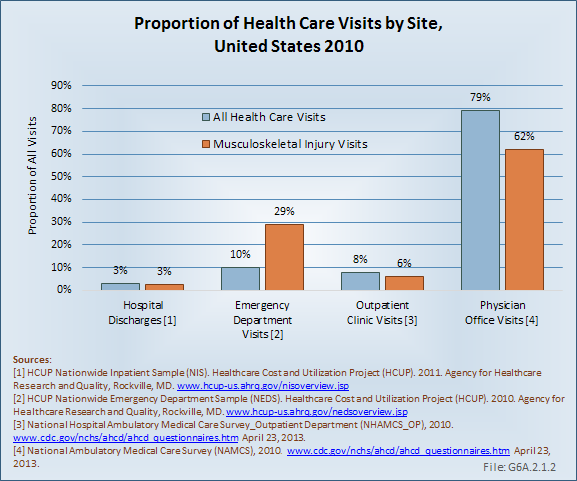
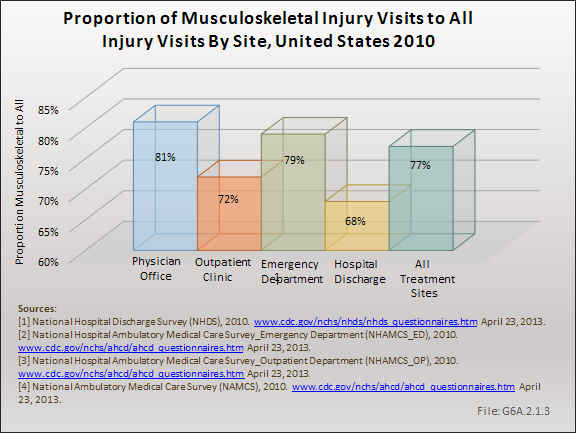
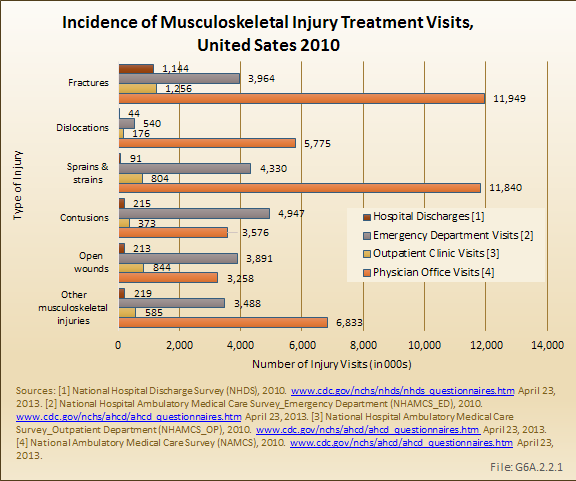
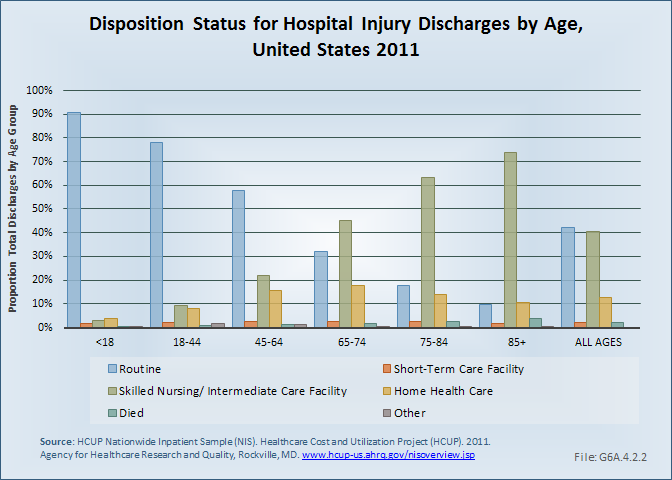
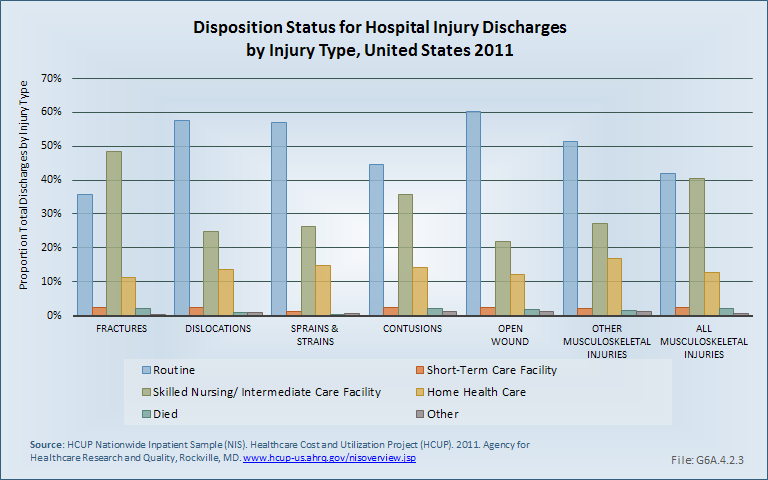
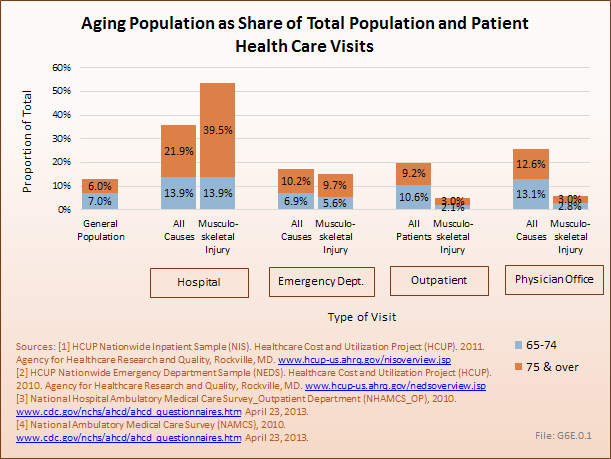
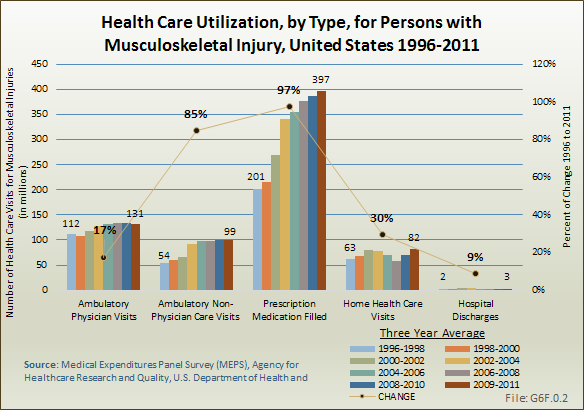
Health care treatments and visits contribute to the burden of musculoskeletal injuries. Ambulatory health care visits for musculoskeletal injuries rose by 85% between the years 1996-1998 and 2009-2011, from 54 million to 99 million visits. However, physician office visits continue to account for the largest share of treatment visits. Hospital discharges for musculoskeletal injuries remain a very small proportion of overall treatment visits, indicating that most musculoskeletal injuries are not serious enough to require hospitalization.
Prescription medications for musculoskeletal injuries nearly doubled over the time frame, jumping from 201 million prescriptions to 397 million between 1996-1998 and 2009-2011, an increase of 97%. (Reference Table 10.2 PDF CSV) 
Edition:
- 2014


 Download as CSV