The economic burden of bone cancers can be great. The more advanced the disease, the worse the prognosis and, accordingly, the more expensive the treatments. It is likely that early detection, and, certainly, prevention if possible, could drastically reduce costs. A number of expensive treatments are required to address these tumors. In the 2007 report by Damron, Ward, and Stewart,1 it was noted that the most frequent initial treatments varied widely based on the type of sarcoma. Although not reported, these treatments vary widely based on the stage of the disease as well.
Collectively, they reported that surgery alone was the most common initial treatment for chondrosarcomas (69%), whereas for Ewing sarcoma, treatments were divided between surgery and chemotherapy (24% of cases), radiation and chemotherapy (23%), and chemotherapy alone in 18%. With osteosarcoma, when initial treatment was known, the largest group received surgery and chemotherapy (46%). Surgery was reported as part of the initial treatment in 71% of osteosarcoma patients, 83% of chondrosarcoma patients, and 47% of Ewing sarcoma patients. The most frequent operations performed were limb-sparing radical resections and excisions. When the type of surgery was defined and known, limb-preservation surgery was performed in 69% of osteosarcomas, 79% of chondrosarcomas, and 81% of Ewing sarcomas.1
Radiation therapy was employed in 10% of osteosarcomas, 14% of chondrosarcomas, and 46% of Ewing sarcoma cases. In Dr. Ward’s personal series of more than 100 osteosarcomas, amputation has been required in only 17% of patient, but almost all patients have had surgical resection, limb reconstruction, and chemotherapy.1
Multiple therapies may be needed later in the course of the patient’s disease, especially in the more advanced cases. In later stages of the disease for those not cured with surgery alone, significant costs will accumulate as the patients develop pulmonary disease and, ultimately, die. Hormone therapy, immunotherapy, and bone marrow transplant/endocrine treatments each accounted for 1% or less of initial treatments. However, in severely affected individuals in whom standard treatments fail, these alternative treatments may be tried more frequently. Currently, the authors are not aware of any data source that reports the rate of utilization of such late treatments.
All of these treatments are costly to administer. Per-patient cost will vary widely depending on the treatments utilized, and the number and intensity of treatments. Over all, treatment for bone and joint cancers can easily exceed $100,000 for a single patient. This is particularly true if that patient receives surgery, chemotherapy, and radiation therapy. If one includes the cost of bone-replacing endoprostheses or the costs of artificial limbs used in those cases that required amputations, the cost will be much higher. In addition to the direct medical cost, there are extensive indirect and social costs from lost work time and disability. For some patients, healthcare costs associated with their bone and joint cancers will be ongoing.
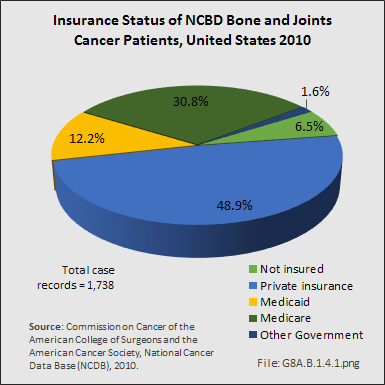
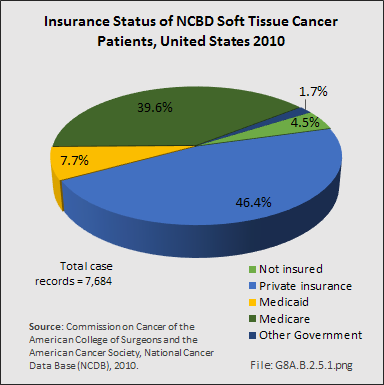
The burden of paying the cost of treatment for bone and joint cancers is shifting. In the study cited above, from 1998 to 2010, managed care provided insurance coverage for the largest portion of patients (37%), following by Medicare with supplement (16%). Medicare and Medicaid were roughly equal at 8% and 8%, respectively. However, analysis of the NCDB insurance data available for 1,738 (95.7%) of 1,816 bone and joint cancer cases reported for 2010 show Medicare and Medicaid covering a much larger share.

Edition:
- 2014
 Download as CSV