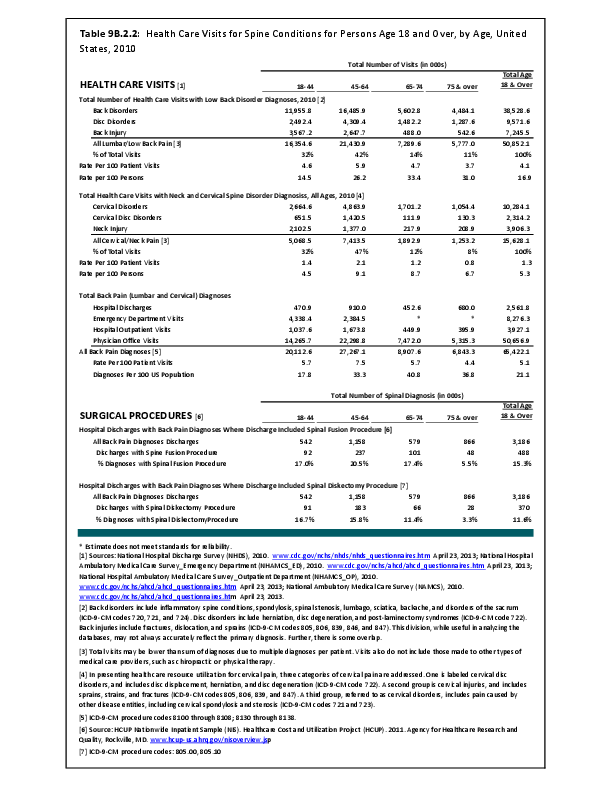
People aged 65 to 74 years had the highest rate of healthcare visits for back and neck pain (40.8 per 100 persons), but accounted for only 14% of the 65.4 million total healthcare visits made by adults for back or neck pain in 2010, due to their smaller share of the total population. The rate of healthcare visits was similar for people aged 75 years and older (36.8 per 100) and those aged 45 to 64 years (33.3 per 100). While only 17.8 in 100 people ages 18 to 44 years had a healthcare visit in 2010 for back and neck pain, this age group comprised 31% of all visits. Total healthcare visits included hospital discharges, emergency department (ED) and outpatient clinic visits, and physician office visits.

Those aged 45 to 64 years had the highest rate of spinal fusion procedures performed for back or neck pain. One in five, or 20.5%, of hospital discharges in this age group with a back or neck pain diagnosis had a spinal fusion procedure performed. People aged 75 years and older have a low rate of spinal fusion procedures (5.5%). (Reference Table 9B.2.2 PDF CSV)

Edition:
- 2014
 Download as CSV