Lumbar/low back pain and cervical/neck pain are among the most common medical conditions requiring medical care and affecting an individual’s ability to work and manage the daily activities of life. Back pain is the most common physical condition for which patients visit their doctor. In any given year, between 12% and 14.0% of the United States’ adult population (above 18 years of age) will visit their physician with complaints of back pain. In addition, an unknown, but very high number will visit a chiropractor or physical therapist for these complaints. The number of physician visits has increased steadily over the years. In 2012, more than 52.3 million patients visited a physician with a complaint of back pain, compared to 44.6 million in 2004.1
A large annual health care survey is conducted in the United States by the National Center for Health Statistics for the purpose of identifying the incidence and prevalence of select health conditions. Pain from any muscle, joint, or bone (musculoskeletal pain) was reported by 52.1% of persons aged 18 years and older in 2012. Low back pain was the most common, affecting 28.6%; neck pain was the third most common at 15.2%. (Knee pain was second at 18.1%.) The prevalence of back pain has remained stable since 2005, and is measured in response to the question of whether the individual “had low back pain or neck pain during the past three months.” Females report musculoskeletal pain more frequently than males (54.6% vs. 49.5%). The prevalence of low back pain and neck pain is highest for persons age 45 to 64 years, while overall, joint paint is highest among persons age 65 years and older, where 7 in 10 report joint pain. (Reference Table 2.1 PDF [1] CSV [2])

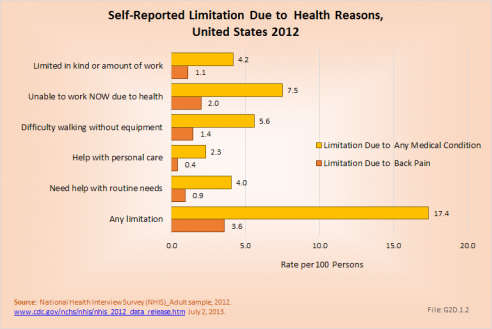
About 1 in 13 persons (7.5%) in the population age 18 or older report they have a physical, mental, or emotional problem or illness that precludes work. Among these persons, 27%, or nearly 4 of the 13, are unable to work due to chronic back or neck problems. Another 1 out of 25 persons is limited in the type and duration of work they can do because of back and neck pain. Three in four persons with pain in multiple areas of the back and neck report work limitations. (Reference Table 2.10.1 PDF [3] CSV [4])
The estimated annual direct medical cost for all back related conditions was $253 billion in 2012. This is further discussed under the Economic Burden [5] topic in this Spine section, and in the Economic Cost [6]topic at this site. As discussed elsewhere, this is not the true cost because chiropractic care, physical therapy, massage therapy, and other types of alternative care are not included in the analysis. Also, outpatient treatment cost from outpatient clinics is currently not collected; hence, this data is missing or incomplete.
Back pain often originates from sources that are not readily identifiable. Many causes of back pain are likely related to degeneration, but the actual underlying cause of a given back pain episode is often uncertain. In reviewing administrative data for prevalence, it is important to realize that the diagnostic categories may be inaccurate because they reflect differing interpretations about the source of the back problem rather than an absolute diagnosis. This will be discussed further in later sections.
For purposes of further analysis, we decided to divide the diagnostic codes defining the burden of spine problems into three groups: back disorders, disc disorders, and back injuries. This approach allows comparison to earlier editions of the text. We are aware there may be substantial overlap, and that some of the back disorders may be related to degenerative disc changes and some of the disc disorders may have another origin. The role of disc degeneration in the causation of back pain remains uncertain. Intervertebral disc degeneration and associated facet joint osteoarthritis seem to be a natural process of aging, but can alter the biomechanics and function of the spine. Studies have identified a strong genetic predisposition, but there are modifying influences including age, obesity, activity level, and smoking.
In the tables and text, we define back disorders by diagnostic ICD-9-CM Codes 720, 721, and 724. These codes include inflammatory spine conditions, spondylosis, spinal stenosis, lumbago, sciatica, backache, and disorders of the sacrum. Disc disorders include herniations, disc degeneration, and post-laminectomy syndromes (ICD-9-CM Code 722). Back injuries include fractures, dislocations, and sprains (ICD-9-CM Codes 805, 806, 839, 846, and 847). The same classifications are used for both lumbar/low back pain and cervical/neck pain.
Unfortunately, the databases do not permit diagnostic verification. Sometimes diagnoses are provided primarily for reimbursement purposes, with little emphasis on accuracy. Further, there is considerable overlap. For example, a patient with back pain of unknown origin could be given the diagnosis of lumbago, placing him or her in the back disorder category. He or she may also have disc degeneration with a diagnosis of degenerative disc disease and, therefore be placed in the disc disorder category. Or, if his or her problem developed after a lift or twist, it could be diagnosed as a back strain, falling into the back injury category.
In the tables and graphs, total health care visits include hospital discharges obtained from the National Hospital Discharge Survey (NHDS) in 2010, emergency department visits obtained from the National Hospital Ambulatory Medical Care Survey Emergency Departments (NHAMCS-ED) in 2010, hospital outpatient visits obtained from the National Hospital Ambulatory Medical Care Survey Outpatients (NHAMCS-OP) 2010, and physician office visits obtained from the National Ambulatory Medical Care Survey (NAMCS) in 2010, all part of the National Health Care Surveys (NHCS) compiled annually by the Centers for Disease Control and Prevention (CDC) .
For comparative purposes, data are also analyzed for the Health Care Cost and Utilization Project (HCUP) Nationwide Inpatient Sample (NIS) and the Nationwide Emergency Department Sample (NEDS), created annually by the Agency for Health Care Research and Quality (AHRQ). These databases are much larger than the NHCS databases, but do not include outpatient and physician office visits. When the weighted analysis is compared, the two sets of databases produce very similar results. The advantage of the HCUP databases is the reliability of data for conditions that are rare, and often have a very small number of records.
Using the diagnostic code grouping discussed above, back disorders accounted for 76% of low back pain health care resource utilization in 2010. Back disorders accounted for 7 in 10 or more visits to all health care sites. (Reference Table 2.2.1 PDF [7] CSV [8]).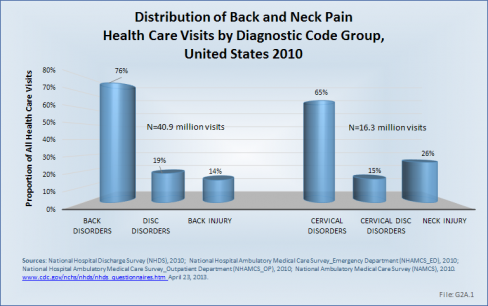
Disc disorders accounted for 19% of low back pain resource visits, and approximately 27% of hospitalizations. Emergency department visits for disc disorders were rare, comprising only 2% of all visits to the ED.
Back injuries, which include fractures, sprains, and strains, are often reported as caused by overexertion or overuse. They accounted for the remaining 14% of 2010 low back pain resource visits. Back injuries were most commonly seen in the emergency room (35%), but constituted only 9% of hospitalizations, indicating that most were manageable in an outpatient setting, and were most likely soft tissue injuries.
Comparative data for the HCUP databases can be found in the data tables. (Reference Table 2.7.1 PDF [9] CSV [10])
In 2012, nearly 29% of the US population age 18 years and older self-reported having had low back pain during the past three months. Among persons reporting low back pain, one in three (36%) suffered from back pain radiating into the leg. This is a greater percentage of pain than is reported for the upper limbs (shoulder, arm, elbow, wrist, and hands) and the lower limbs (hip, knees, ankles, and feet). Approximately one-third of persons reporting low back pain also experience neck pain. Among person reporting neck pain, the proportion experiencing back pain is as high as 71%. Both lower back and neck pain are reported in higher rates by females (30.5%; 17.6%) than males (26.6%; 12.6%). The highest rates for back and neck pain reported for both genders occur in the 45- to 64-year age group; there is a slight decrease in back and neck pain complaints in subsequent years (65 years and older), unlike that which occurs with pain reported in other joints. (Reference Table 2.1 PDF [1] CSV [2])

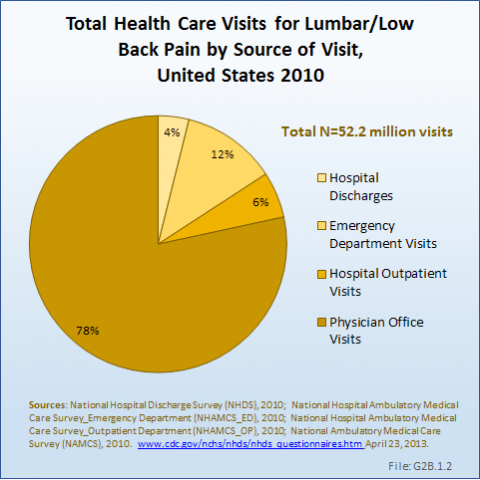
As discussed previously, the health care utilization by people with low back pain is only in part understood because of lack of information about visits to chiropractors, physical therapists, and others involved in the care of back pain. Even so, the reported numbers in the databases are very high. Data from the NCHS reports more than 52 million visits to hospitals, emergency departments, outpatient clinics, and physician offices with a diagnosis of low back pain. Four of five visits were to physician offices, but more than 2 million patients were hospitalized. (Reference Table 2.2.1 PDF [7] CSV [8], and Table 2.4.1 PDF [11] CSV [12])
The prevalence of low back pain health care visits is greatest in the 45- to 64-year age group, which comprises 26% of the US population; it is followed by the 18- to 44-year age group, comprising 37% of the population. Together, the 18- to 64-year group represents 63% of the population, but is responsible for 72% of all low back pain health care visits. However, when adjusting for the 2010 US census population estimates, the frequency of health care visits for low back pain per 100 US populations is highest in the 65- to 74-year age group, where it is 33.4%. In reviewing the three diagnostic categories, back disorders dominate in all age groups. Disc disorders are uncommon in the below-18-years age group, but increase in frequency as the population ages. Back injuries are more common under the age of 44 years (22%), and declines to only 7% to 9% in those 65 years and older. (Reference Table 2.2.2 PDF [13] CSV [14] and Table 2.4.2 PDF [15] CSV [16]) 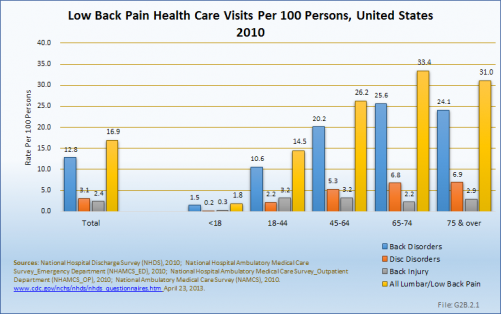
The average age of persons hospitalized in 2010 for low back pain was 61.1 years. This compares to an average age of 42.7 years for persons visiting an emergency department, 50.9 years for visits to outpatient departments, and 52.6 years for visits to a physician. These numbers are essentially unchanged since 2004. (Reference Table 2.2.2 PDF [13] CSV [14])
Low back pain is found more frequently among females than males, with females representing 55% of health care resource visits. Back disorders, in particular, are more frequent in females, while disc disorders are slightly more common in males. Nearly 8 in 10 (78%) female health care visits in 2010 for low back pain were classified as back disorders, compared to 73% for males. This is probably a reflection of the prevalence of spinal stenosis and degenerative spondylolisthesis in both sexes. (Reference Table 2.2.1 PDF [7] CSV [8])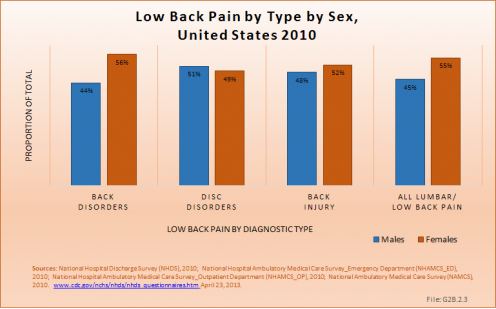
Persons hospitalized for lumbar/low back pain in 2010 spent on average nearly 5 days in the hospital. Persons hospitalized for lumbar/low back injuries were hospitalized for the longest period of time, on average 7.6 days. When comparing the total days of hospitalization for all causes to those for lumbar/low back pain, back pain constitutes 5% to 7% of the discharges and of total hospital days, indicating hospital stays are, on average, similar to those for other causes. The length of hospital stays has remained relatively stable since 2004. (Reference Table 2.9.1 PDF [17] CSV [18])
Although females are likely to have slightly shorter hospital stays for all causes of back pain, it is only for lumbar back injuries that there is a real difference between the sexes in length of stay.
Age is an important factor influencing length of stay. Although they constitute a small proportion of back pain hospitalizations, young persons under the age of 18 years have longer stays for back pain, in particular when compared to the average length of stay for persons in this age group; here the average length of stay is 1.5 to 2 times as long as for other diagnoses. After the age of 18 years, hospital stays for back pain tend to increase as the population ages. (Reference Table 2.9.2 PDF [19] CSV [20])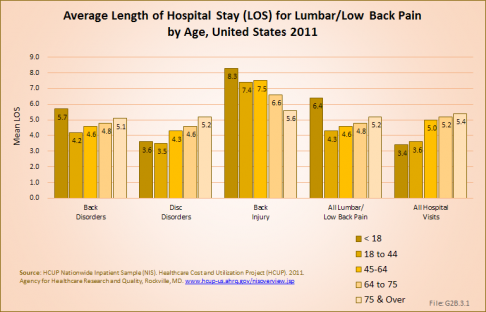
Average hospital charges are provided along with length of stay in the HCUP NIS database. On average, hospital charges for a lumbar/low back pain inpatient visit were 131% that of the average inpatient visit for any cause. In 2011, an estimated $117 million in charges were assessed against the 2.53 million inpatient stays for lumbar/low back pain, 9% of the estimated total $1.37 billion in hospital charges for that year. Mean charges of $70,300 were highest for lumbar injuries and, at $41,800, lowest for lumbar back disorders. (Reference Table 2.9.2 PDF [19] CSV [20])
Cervical/neck pain is another common reason for visiting a doctor. In 2010, 16.3 million patient visits, or 1.3% of all health care visits to hospitals and physician offices, were for neck pain. Three out of four (76%) of these were physician visits, while only a very small number (3%) of patients with cervical/neck pain were hospitalized. (Reference Table 2.4.1 PDF [11] CSV [12])
Cervical disorders accounted for the majority (65%) of health care visits for upper back pain in 2010. Neck disorders are primarily treated in outpatient clinics or physician offices, but are also responsible for the highest percentage of hospital discharges (60%) for upper back pain.
Cervical disc disorders accounted for only 15% of all neck pain health care visits in 2010, but were responsible for one-third of hospitalizations (33%).
Neck injuries accounted for 26% of all neck pain health care visits. This is a much higher percentage than that reported for low back injuries. Patients with neck injuries were primarily treated in an outpatient setting and, not surprisingly, represented 68% of all emergency department visits for neck pain. (Reference Table 2.3.1 PDF [21] CSV [22])
The data on cervical neck pain shows that hospital discharges are rare in people below age 18 years. When adjusted for the US 2010 census population, estimates for hospital discharges are highest in the 75 years and older age group. The average age for persons hospitalized for neck problems was 58.7 years. Emergency Department visits occurred more frequently in those below 44 years with an average age of 37.9 years. Hospital outpatient and physician office patients were on average 50.2 years and 51.0 years old, respectively. (Reference Table 2.3.2 PDF [23] CSV [24])
Almost four of five neck pain diagnoses (76.5%) in 2010 occurred in persons between ages of 18 and 64 years, the age group representing 63% of the US population. Almost one in five patients (19%) were older than 65 years, and only 4.2% were younger than 18 years of age although this group represents 24% of the US population. Cervical disorders dominated among total health care visits for neck and cervical spine disorders in all age groups, representing from 53% in the 18- to 44-year age group to 90% of all visits in the 65- to 74-year age group. A proportionately larger number of neck injuries (42%) occurred in the below-18-year age group. Adjusted for the population distribution, persons between 45 and 64 years had the highest rate of cervical/neck pain, followed closely by those age 75 years and older. (Reference Table 2.3.2 PDF [23] CSV [24])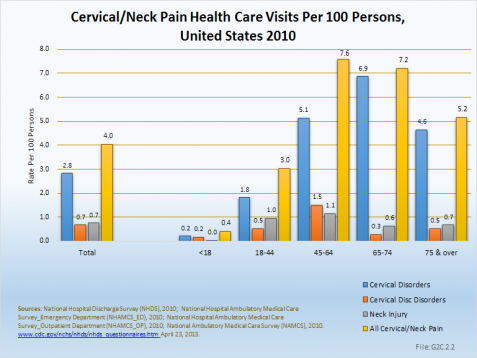
Females accounted for 55% of the health care visits for neck pain in 2010, primarily because 57% of the 315,100 visits for cervical disorders were for females. Males accounted for a greater proportion of visits for the less frequent cervical disc disorder and neck injury visits. (Reference Table 2.3.1 PDF [21] CSV [22])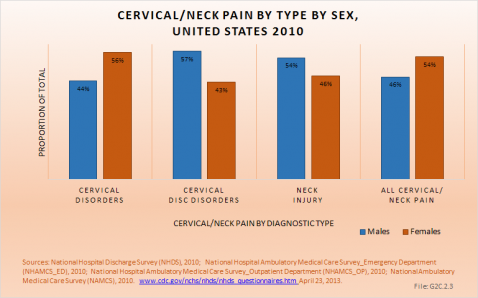
Persons hospitalized for cervical/neck pain in 2010 and 2011 spent an average of 4.5 days in the hospital. Those hospitalized for cervical/neck injuries were hospitalized for the longest period of time, on average 8 to 9 days. When comparing total days of hospitalization for all causes to those for cervical/neck pain, cervical/neck pain constitutes 1% to 2% of the discharges and of total hospital days, indicating hospital stays are, on average, similar to those for all causes. The length of hospital stays has remained relatively stable since 2004. (Reference Table 2.9.1 PDF [17] CSV [18])
Although females are likely to have slightly shorter hospital stays for all cause of cervical/neck pain, it is only for neck injuries that a real difference is seen in length of stay.
Age is a greater factor in length of stay than gender. Although young persons under the age of 18 years constitute a small proportion of back pain hospitalizations, they have longer stays for cervical/neck pain, in particular when compared to the average length of stay for any reason. While the average length of stay for cervical/neck pain is very similar to that for any health care reason among adults, the average length of stay among the young group under age 18 years is 1.5 to 2 times as long. After the age of 18 years, hospital stays for cervical/neck pain tends to increase as the population ages. (Reference Table 2.9.2 PDF [19] CSV [20] and Table 2.9.3 PDF [25] CSV [26])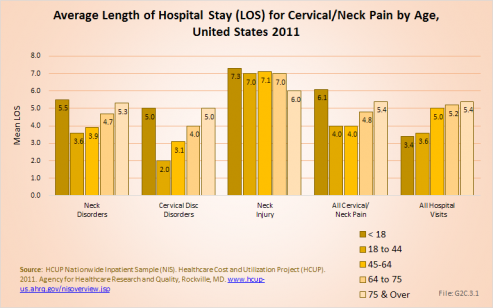
Average hospital charges are provided along with length of stay in the HCUP NIS database. On average, hospital charges for a cervical/neck pain inpatient visit were 147% that of the average inpatient visit for any cause. In 2011, an estimated $34.3 million in charges were assessed against the 660,000 inpatient stays for cervical/neck pain, 3% of the estimated total $1.37 billion in hospital charges for that year. Mean charges of $83,300 were highest for neck injuries and, at $47,800, lowest for cervical/neck disorders. (Reference Table 2.9.2 PDF [19] CSV [20])
As mentioned, back pain was the most common reason for health care visits among musculoskeletal disorders in 2010. When combining low back and neck pain, they accounted for 5.1% of health care visits in 2010, or 1 in 20. The majority of visits (more than 77%) were physician office visits. The number of physician office visits for back pain continues to increase. In 1998 there were 32 million visits, in 2004 nearly 45 million, and in 2010 more than 50 million. Physician office visits for back pain not only show a rapid increase, but also continue to include a larger share of the population. In 1998, 11.8 in 100 persons visited a physician because of back pain. In 2004, this had increased to 15.1 persons in 100. Although a slight decrease was seen through 2008, by 2010 the ratio had increased to 16.4 in 100. (Reference Table 2.8 PDF [27] CSV [28])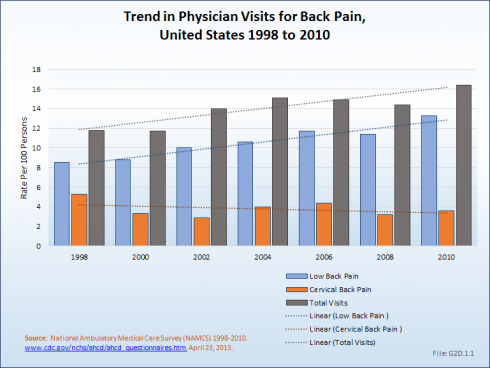
Overall, lumbar pain accounted for 1 in 25 (4.1%) health care resource visits in 2010. The staggering impact of low back pain on both the health care resources in the United States and the disability inflicted on these individuals is disconcerting and has risen slightly since 2004.
About 8% of the working age population, persons age 18 years and older, reported they are unable to work because of a medical condition. Among this group, 27% (2% of total working-age population) reported they are unable to work due to back or neck problems. Another 4% reported they are limited in the amount or type of work they can perform, with one in four of this group also reporting the cause to be back or neck pain (1% of total work-age population). All together, 1 person among every 30 of working age in the United States is limited or unable to work because of back or neck health care problems.
Similar ratios of limitations related to daily living are also found. About 1 in every 18 persons of working age has difficulty walking without equipment due to a medical condition; 26% report that condition to be back or neck pain. Overall, one in six working-age persons report at least one limitation with activities of daily living, which include eating, preparing food, bathing, rising from a chair, walking up steps, etc. For one in five of these persons, the cause of their limitation is back or neck pain. (Reference Table 2.10.1 PDF [3] CSV [4])
Work limitations due to back pain during 2012 were reported slightly more frequently among women than men. The presence of back pain in more than one site, for example, low back and neck pain or low back and buttocks pain, is more likely to be the cause of work limitations than back pain in one single area of the spine. Although women are represented in the workforce less than men, they represent a larger share of lost work days than do men because they are more likely to report lost work days due to back pain than are men (18.6% vs. 13.8%). However, women, on average, lose one less day of work than do men (11.0 to 11.9, respectively). (Reference Table 2.11.1 PDF [29] CSV [30]) 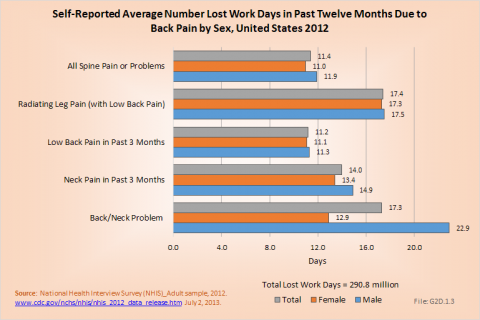
Back pain severe enough to keep people from working in any occupation is most likely in the 18- to 64-year age group. This is, of course, not surprising since those are the most common years in which people work. Only 8% of the population age 75 years and older is listed as being in the workforce, and those persons of this age that do work are probably not doing work that stresses them physically. Further, the healthy worker effect in that age group is significant. Within the work force population, 16% of the workers age 18 to 44 years and 17.1% of workers between 45 and 64 years of age were off work during 2012 with a diagnosis of neck or low back pain. The average number of workdays lost was 9.5 and 14 days for the two age groups, respectively. The oldest group of workers report more than 14 days off work due to back pain, but they constitute such a small group their impact is less than that of the younger workers. (Reference Table 2.11.2 PDF [31] CSV [32])
The National Health Care Interview Survey also provides information about the incidence of bed days, days in which a person was in bed for a half day or more due to injury or illness, during 2012. Here the percent of people reporting bed days is highest in the 18- to 44-year and 45- to 64-year age groups (14.2% and 14.6%, respectively). The greatest number of average bed days per worker was 12.7 in the 75-year and older age group, but a smaller proportion (6.3%) of this already small workforce reported having bed days from back or neck pain. In total, workers in the United States spent more than 170,000 million days in bed in 2012 because of back pain, and during the same time period, almost 291 million workdays were lost. The corresponding number of workdays lost in 2004 was 187 million workdays. (Reference Table 2.11.2 PDF [31] CSV [32] and Table 2.11.3 PDF [33] CSV [34])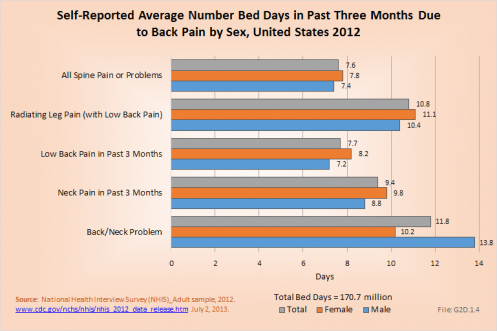
The most severe pain resulting in the highest average number of bed days and lost workdays was reported by people with low back pain radiating into one or both legs. This group spent an average of 10.8 days in bed and lost 17.4 workdays. Females were more commonly off work, but spent approximately the same number of days in bed as males. (Reference Table 2.11.1 PDF [29] CSV [30])
While nonsurgical treatment for back pain is the treatment of choice, spine surgery becomes an option when neck and low back pain is disabling and not responding to nonoperative treatment alternatives. Further, in some cases such as certain fractures, infections, tumors, and severe neurologic deficits, surgery is the first treatment choice. As mentioned in earlier sections, the information we have with respect to surgical procedures is limited to that obtained from hospitals using the Nationwide Inpatient Sample and the National Hospital Discharge Survey. Because of the larger sample size, most data in this analysis uses the NIS. Unfortunately, the information is procedure-related and only indirectly patient-related. On average, two of the eight most common procedures were performed on most patients because the sum of the percentage of patients receiving a procedure is nearly twice that of procedures. (Reference Table 2.12 PDF [35] CSV [36])
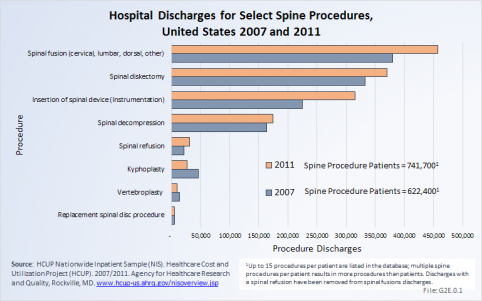
In 2007, just under 1.187 million procedures for the eight most common spine procedures were performed on 662,400 patients. In 2011, the number of patients had increased to 741,700, but total procedures for the same eight common procedures jumped even more to 1.391 million. This is an increase in the number of procedures by 17%, but only a 12% increase in the number of patients.
In 2007, there were 332,500 diskectomies performed compared to 369,900 in 2011. Because of the increase in spinal fusion and other procedures, as subsequently discussed, hospital diskectomies constitute 28% and 25% of all spine procedures in the two years, respectively. Although an absolute larger number of procedures in 2011, diskectomies represent a decreasing share of all procedures in 2011. To what degree this reflects a transfer of procedures to surgicenters is unknown because there is currently no national database. Spinal fusion procedures were listed as the main hospital procedure, being performed on 380,000 patients in 2007 and 457,500 patients in 2011. The majority of insertions of spinal devices, the third most common procedure group, likely occurred in patients with spinal fusions. If we assume that all patients in whom spinal devices were inserted also were fused, only 142,000 patients who were fused did not get a spinal device (18%). Spinal decompression, which may or may not be performed in conjunction with a spinal fusion or in conjunction with a diskectomy, accounted for 14% of all procedures in 2007 and 12.5% in 2011, an decrease of only 7% in the number of procedures. The number of spinal decompression procedures performed, along with other procedures for which inpatient hospitalization is not always required, may not be reflected accurately because an increasing number of these patients are operated on in outpatient surgicenters and facilities,.
The rate of spinal fusion procedures has risen rapidly over the past several decades. Spinal fusion is performed either alone or in conjunction with decompression and/or reduction of a spinal deformity. Fusions are performed on all regions of the spine. Between the years 1998 and 2011, the number of spinal fusion procedures has more than doubled, from 204,000 in 1998 to 457,000 in 2011. This is a 14-year increase of 113%. Apart from the period from 2002 to 2004, the increase on a biyearly basis is in the double digits. Relating the number of patients operated on to the estimated population age 18 years and older, the rate has gone from 110 per 100,000 persons in 1998 to 199 per 100,000 in 2011. During the same time period, refusion rates increased by 171%, from 6 to 14 persons per 100,000. Between 1998 and 2011, the average age of patients operated on with a fusion procedure has increased from 49 years to just under 56 years. (Reference Table 2.13 PDF [37] CSV [38])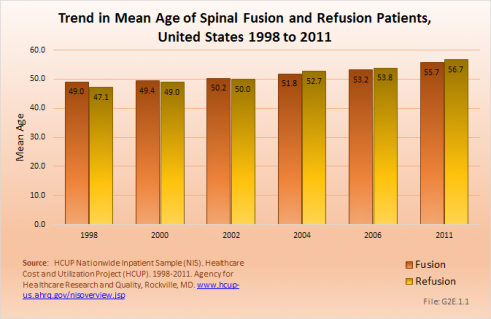
Although the mean length of stay for spinal fusion has decreased from 4.7 days in 1998 to 3.8 in 2011, the hospital charges for these patients have increased significantly. The mean hospitalization charge in 1998 was $26,000 ($36,000 in 2011 dollars); while in 2011 the charge was $102,000. An increased use of instrumentation and biologicals (mainly bone substitutions) contribute to the higher cost. The total increase in hospitalization charges rose from $5.4 billion ($7.4 billion in 2011 dollars) to $46.4 billion over this 14-year period, an increase of more than 750%. Spinal refusions are even more expensive, with an average charge of $123,000 in 2011. However, because spinal refusions are a small proportion of all fusion procedures, they account for only 7.5% of total 2011 charges. This, of course, does not mean that cost or reimbursement was even close to these dollar numbers. These charges are based on what hospitals set as their charges, and do not reflect the contractual agreements they have with the payor community.
Likely explanations for the increase in spinal fusions are advances in technology, including the development of new diagnostic techniques and new implant devices that allow for better surgical management. In addition, there has been increased training in spinal surgery and the population has aged, bringing with it the inherent medical problems that aging incurs. Further, quality of life expectations have increased, making patients less accepting of an ongoing back problem and more likely to look for a surgical solution.
Lumbar fusion rates and cervical fusion rates are both increasing rapidly, while thoracic fusions continue to be less frequent. Lumbar fusions remain the most common, constituting 52% of all spine fusion procedures in 2011. Spinal refusions occur most often to the lumbar region, accounting for 65% of both refusion procedures and refusion patients. (Reference Table 2.14 PDF [39] CSV [40])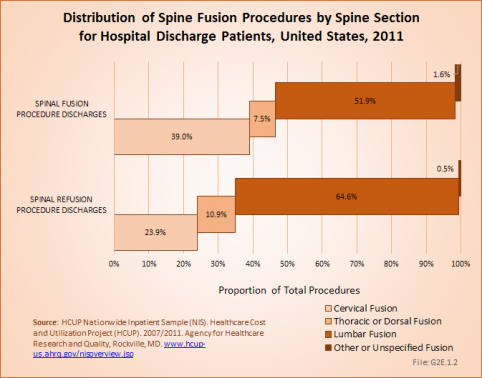
Using the Nationwide Inpatient Sample in 2011, a broad estimate can be made of fusion procedures as it relates to admissions. In 2011, 10.4% of patients with low back diagnosis were operated on with a fusion. For cervical neck pain diagnoses, the proportion is much higher (28.8%). Males and females are almost equally likely to have a fusion. The total number of males being fused for either neck or low back pain is 16.5% versus 14.4% among females. Patients in the 45- to 64-year age group were slightly more likely to have a fusion procedure than those younger or older. The length of stay was less if a fusion was performed than if no fusion was performed, but the mean charges were more than double when a fusion was performed. (Reference Table 2.15 PDF [41] CSV [42])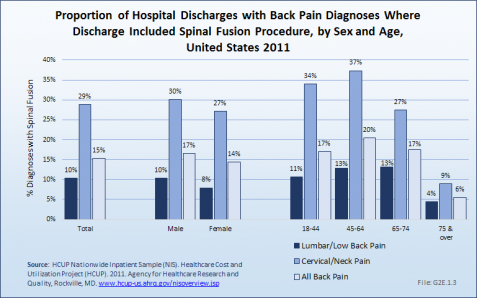

Spinal fusion is most frequently performed in patients with either a primary diagnosis of lumbar disc degeneration or cervical disc displacement, both accounting for 11.2% of fusion procedures. Spinal stenosis accounted for 10.6%. Much smaller numbers of patients had degenerative spondylolisthesis (7.5%), idiopathic spondylolisthesis (2.7%), or idiopathic scoliosis (2.4%). (Reference Table 2.16 PDF [43] CSV [44])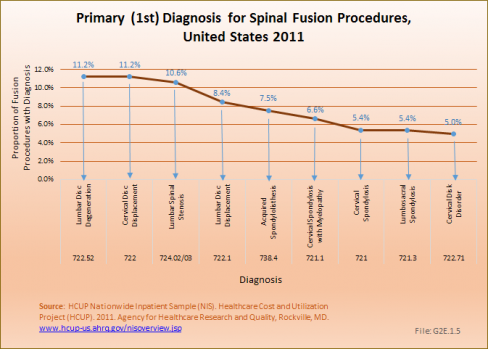
Diskectomies occurred in approximately 370,000 inpatients, with slightly more females than males undergoing the procedure. This number is likely misleading because many diskectomies now occur in an outpatient setting. Of those undergoing the procedures, 42% had a diagnosis of either lumbar or cervical disc displacement, with more than 12% having a diagnosis of disk degeneration. (Reference Table 2.18 PDF [45] CSV [46])
The largest number of patients with a diskectomy procedure (almost 50%) was in the 45- to 64-year age group. Patients spent on average 4.6 days in the hospital, although the median is between one and two days. Diskectomy procedures conducted in outpatient clinics are not included as there is no good source for this data at this time. The mean charges for diskectomy procedures were $35,000, for a total of $13 million. The majority of patients with a disc displacement diagnosis are not hospitalized. The most frequent encounters are physician office visits. (Reference Table 2.17 PDF [47] CSV [48]) 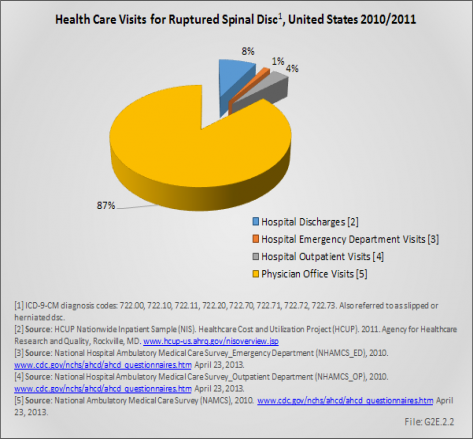
Table 2.19 (PDF [49] CSV [50]) shows the diskectomy procedure trend in the United States from 1996 to 2011. It may seem surprising that the number is fairly stable given the population increase and the change in aging of the population. This is a reflection of the fact that more and more of these procedures are done in the outpatient setting and therefore not captured by the inpatient National Hospital Discharge Survey.
The prevalence of back and joint pain increases as the population ages. Persons age 45 to 64 years self-report the presence of back and neck pain during a previous 3-month period in the highest numbers, while joint pain is self-reported by 7 of 10 persons age 65 and over. (Reference Table 2.1 PDF [1] CSV [2] and Table 2.2.2 PDF [13] CSV [14])
Health care visits for back disorders to doctors, emergency departments, outpatient clinics, and hospital discharges show a steady rise as the population ages up to 75 years. After that, it drops slightly. Older persons with back pain are more likely to be hospitalized that are younger persons, and to stay an average of 1 day longer than younger persons age 18 to 44 years. Average charges for hospital stays with a diagnosis of back pain also rise as age rises, again with a drop after age 75 years. Mean hospital charges are an average of 133% those for all health care hospitalizations in 2011. (Reference Table 2.9.2 PDF [19] CSV [20]) While the prevalence of neck disorders is significantly lower, aging again has a large impact on the number of health care visits for neck pain.
Back pain is listed as a cause of limitations in activities of daily living by 15% to 31% of those persons with limitations. The rate increases up to the age of 65 to 74 years, and again declines after age 75 years. (Reference Table 2.10.2 PDF [51] CSV [52])
Back pain is a major health concern to older people. As the population continues to age, back pain becomes an increasing larger burden on the health care system.
The human spine is an extremely complex biomechanical structure with multiple joints, bones, muscles, and nerves. Functional and structural disorders of the spine often produce symptoms affecting more than one region of the spine and these problems are not captured within the diagnostic groups previously discussed. They include patients with pelvic symptoms, headaches related to the cervical region, and fibromyalgia. While disabling too many patients, the true estimate of health care utilization in these patients is difficult to estimate.
Between the years 1996 to 1998 and 2009 to 2011, the number of persons in the population reporting a spine condition rose from 27.4 million to 31.0 million, but the proportion of total population with a spine condition (10.1%) remained the same in both time periods. However, the distribution of the population with a spine condition, by age group, showed a consistent shift upward as the population ages, reflecting the overall aging of the US population. (Reference Table 10.1 PDF [53] CSV [54])
Health care treatments and visits contribute to the burden of spine conditions. Ambulatory physician visits, home health care visits, and hospital discharges all rose by 17%, 9%, and 13%, respectively, between the years 1996 to 1998 and 2009 to 2011. While still accounting for a relatively small number of visits, ambulatory nonphysician care visits rose from 101 million in the earlier time frame to 183 million in the most recent years, an increase of 83%. However, prescription medications for spine conditions show the most dramatic rise, jumping from 353 million prescriptions to 680 million over the two time frames, an increase of 93%. (Reference Table 10.2 PDF [55] CSV [56]) 
Overall, ambulatory care visits accounted for the largest share of per-person direct cost for persons with a spine condition. At an average cost of $3,077 per-person between 2009 and 2011, an increase of 81% from 1996 to 1998, ambulatory care accounted for 38% of per person direct cost between 2009 and 2011. While the share of mean per-person cost for inpatient care dropped from 36% to 28% between 1996 and 1998 and 2009 to 2011, the mean cost rose from $1,755 to $2,267, an increase of 29%. At the same time, the average per-person cost for prescriptions rose from $650 to $1,736, in 2011 dollars, an increase of 167%. (Reference Table 10.4 PDF [57] CSV [58])
Total direct per-person health care costs for persons with a spine condition were $8,150, and increase of 69% since 1996 to 1998. Incremental direct per-person costs, those costs most likely attributable to a spine condition, rose from $934 to $1,496, in 2011 dollars, an increase of 60%. (Reference Table 10.6 PDF [59] CSV [60])
Total aggregate direct costs for persons with a spine condition were $253 billion in 2009 to 2011, a rise of 91% from the $132.4 billion in 1996 to 1998, in 2011 dollars. Incremental aggregate direct costs increased from $25.6 billion in 1996 to 1998 to $46.4 billion in 2009 to 2011, an increase of 82%.
Indirect costs associated with lost wages for persons ages 18 to 64 years are not calculated for persons with a spine condition However, back pain is often cited as the reason for bed days and lost work days by persons in the labor force. In 2012, 3.6 million persons in the prime working ages of 18 to 64 years reported they were unable to work at the time due to chronic back or neck problems, with another 1.7 million reporting they were limited in the kind or amount of work they can do as a result of chronic back or neck pain. (Reference Table 2.10.2 PDF [51] CSV [52])
Also, in 2012, 14.2% of the workforce age population reported an average of 7.6 bed days in the previous 12 months, for a total of 170.7 million bed days, due to chronic back or neck pain. In addition, 16.1% of this same population reported an average of 11.4 lost work days in the previous year due to chronic back or neck pain, or more than 290 million work days lost in 2011/2012 due to back pain. (Reference Table 2.11.1 PDF [29] CSV [30])
The financial cost associated with back pain is obviously enormous and, unfortunately, rising. Greater understanding of the causes of back pain and what leads to disability is needed to reduce this continually increasing trend. Understanding why disc degeneration causes pain in some yet not in others is needed to address the burden of pain and disability and the significant economic impact low back pain treatments create on health care resources each year.
DATA LIMITATIONS
The two main limitations in obtaining complete and reliable data are (1) the lack of data sources for all treatment locations and treatment providers and (2) the difficulty in verifying the correct diagnosis.
As discussed in the text we have no comprehensive databases covering outpatient procedures, particularly in surgi-centers and practice procedure rooms. With an increasing move toward outpatient procedures, this is a growing weakness in obtaining prevalence and incidence data. In addition, we have no data covering nonphysician treatments, such as treatment by physical therapists, chiropractors, naprapaths, acupuncturists, but we know they take care of large numbers of patients with neck and back disorders. We also have little information about the use of alternative treatment methods.
Verifying the primary diagnosis is seriously affected by our inability to make a diagnosis in patients with chronic back and neck pain, and by the fact that many patients have more than one spinal diagnosis and the primary diagnosis is often not the one listed first in the databases.
PATIENT CO-MORBIDITIES
The neck and back chapters do not cover co-morbidities. We know that obesity and smoking influences the intervertebral discs. Other co-morbidities, such as cardiovascular diseases and diabetes, have been linked to back pain, but conclusions related to their impact on back pain cannot be made based on current data sources.
PATIENT COMPLIANCE
Patient compliance with recommendations, such as weight loss and activity, is an important factor in reducing back pain. As with co-morbidities, this important aspect cannot be addressed using available data sources.
As noted in the discussion above (Indirect Costs [61]), back pain was the cause of more than 290 million lost work days in a 12 month period during 2011/2012. In addition, over 6%, or 1 in 16, persons in the prime working ages of 18 to 64 report they are either limited in the type or amount of work they can do or are unable to work at all due to back pain. It is clear that back pain has a substantial impact on he workforce, and that finding ways to reduce or repair causes of back pain is needed. (Reference Table 2.10.2 PDF [51] CSV [52] and Table 2.11.1 PDF [29] CSV [30])
RESEARCH FUNDING FOR CARE AND PREVENTION
To address the most common cause of chronic pain, back and neck pain, research in prevention, diagnoses, and treatment is essential. While a priority at the National Institutes of Health and identified as one of the most important health problems by the Institute of Medicine, funding is not sufficient to accelerate basic research, compare treatment alternatives, develop new treatments, and evaluate possible prevention approaches.
AVAILABILITY OF HEALTH CARE PROVIDERS
Many patients have difficulty connecting with health care providers who have the appropriate training in back and neck disorders. This leads to delayed appropriate treatment and often unnecessary use of diagnostic resources. Back and neck pain are frequent reasons for acute care in emergency facilities, with associated wait periods and increased cost.
ACCESS TO CARE
As discussed above, access to appropriate care is inadequate. This is true for both nonspecialists and specialists. Better training of primary care physicians and better coordination between physicians and other providers of primary back and neck care, such as physical therapists, chiropractors, and other alternative care givers, would be beneficial. Specialists, both in non-operative and surgical specialties, must become more accessible when required.
Back Pain (Lumbar and Low Back):
Back Disorders:
Ankylosing spondylitis and other inflammatory spondylopathies: 720*
Spondylosis and allied disorders: 721.2-721.9
Other and unspecified disorders of back: 724
Disk Disorders:
Displacement of intervetebral disc: 722.10, 722.11
Schmorl's nodes: 722.30-722.39
Degeneration of intervetebral disc: 722.51, 722.52, 722.60
Intervertebral disc disorder with myelopathy: 722.72, 722.73
Postlaminectomy syndrome: 722.80, 722.82, 722.83
Other and unspecified disc disorder: 722.90, 722.92, 722.93
Back Injury:
Closed fracture of vertebra without mention of spinal cord injury: 805.20-805.80
Closed fracture of vertebra with spinal cord injury: 806.20-806.90
Closed dislocation, vertebra: 839.20-839.49
Sprains and strains of sacroiliac region: 846
Other sprains and strains of back: 847.10-749.90
Cervical (Neck) Pain:
Neck Disorders:
Cervical spondylosis: 721.00, 721.11
Disorders of cervical region: 723.00-723.90
Disk Disorders:
Displacement of cervical intervertebral disc: 722.00
Degeneration of cervical intervertebral disc: 722.40
Intervertebral disc disorder, with myelopathy: 722.71
Postlaminectomy syndrome of cervical region: 722.81
Other and unspecified disc disorders of cervical region: 722.91
Neck Injury:
Closed fracture of cervical vertebra without mention of spinal cord injury: 805
Closed fracture of cervical vertebra with spinal cord injury: 806
Closed dislocation, cervical vertebra: 839
Neck sprain: 847.00
Spine Procedures (ICD-9-CM Procedures Code)
Cervical fusion: 81.02, 81.03
Thoracic fusion: 81.04, 81.05
Lumbar fusion: 81.06-81.08
Other fusion: 81.00, 81.01
Fusion/refusion multiple vertebrae: 81.62-81.64
Spine refusion: 81.30-81.39
Spinal decompression: 03.09
Spinal diskectomy: 80.50, 80.51
Links:
[1] https://www.boneandjointburden.org/docs/T2.1.pdf
[2] https://www.boneandjointburden.org/docs/T2.1.csv
[3] https://www.boneandjointburden.org/docs/T2.10.1.pdf
[4] https://www.boneandjointburden.org/docs/T2.10.1.csv
[5] https://www.boneandjointburden.org/2014-report/iih0/economic-burden-0
[6] https://www.boneandjointburden.org/2014-report/x0/economic-cost
[7] https://www.boneandjointburden.org/docs/T2.2.1.pdf
[8] https://www.boneandjointburden.org/docs/T2.2.1.csv
[9] https://www.boneandjointburden.org/docs/T2.7.1.pdf
[10] https://www.boneandjointburden.org/docs/T2.7.1.csv
[11] https://www.boneandjointburden.org/docs/T2.4.1.pdf
[12] https://www.boneandjointburden.org/docs/T2.4.1.csv
[13] https://www.boneandjointburden.org/docs/T2.2.2.pdf
[14] https://www.boneandjointburden.org/docs/T2.2.2.csv
[15] https://www.boneandjointburden.org/docs/T2.4.2.pdf
[16] https://www.boneandjointburden.org/docs/T2.4.2.csv
[17] https://www.boneandjointburden.org/docs/T2.9.1.pdf
[18] https://www.boneandjointburden.org/docs/T2.9.1.csv
[19] https://www.boneandjointburden.org/docs/T2.9.2.pdf
[20] https://www.boneandjointburden.org/docs/T2.9.2.csv
[21] https://www.boneandjointburden.org/docs/T2.3.1.pdf
[22] https://www.boneandjointburden.org/docs/T2.3.1.csv
[23] https://www.boneandjointburden.org/docs/T2.3.2.pdf
[24] https://www.boneandjointburden.org/docs/T2.3.2.csv
[25] https://www.boneandjointburden.org/docs/T2.9.3.pdf
[26] https://www.boneandjointburden.org/docs/T2.9.3.csv
[27] https://www.boneandjointburden.org/docs/T2.8.pdf
[28] https://www.boneandjointburden.org/docs/T2.8.csv
[29] https://www.boneandjointburden.org/docs/T2.11.1.pdf
[30] https://www.boneandjointburden.org/docs/T2.11.1.csv
[31] https://www.boneandjointburden.org/docs/T2.11.2.pdf
[32] https://www.boneandjointburden.org/docs/T2.11.2.csv
[33] https://www.boneandjointburden.org/docs/T2.11.3.pdf
[34] https://www.boneandjointburden.org/docs/T2.11.3.csv
[35] https://www.boneandjointburden.org/docs/T2.12.pdf
[36] https://www.boneandjointburden.org/docs/T2.12.csv
[37] https://www.boneandjointburden.org/docs/T2.13.pdf
[38] https://www.boneandjointburden.org/docs/T2.13.csv
[39] https://www.boneandjointburden.org/docs/T2.14.pdf
[40] https://www.boneandjointburden.org/docs/T2.14.csv
[41] https://www.boneandjointburden.org/docs/T2.15.pdf
[42] https://www.boneandjointburden.org/docs/T2.15.csv
[43] https://www.boneandjointburden.org/docs/T2.16.pdf
[44] https://www.boneandjointburden.org/docs/T2.16.csv
[45] https://www.boneandjointburden.org/docs/T2.18.pdf
[46] https://www.boneandjointburden.org/docs/T2.18.csv
[47] https://www.boneandjointburden.org/docs/T2.17.pdf
[48] https://www.boneandjointburden.org/docs/T2.17.csv
[49] https://www.boneandjointburden.org/docs/T2.19.pdf
[50] https://www.boneandjointburden.org/docs/T2.19.csv
[51] https://www.boneandjointburden.org/docs/T2.10.2.pdf
[52] https://www.boneandjointburden.org/docs/T2.10.2.csv
[53] https://www.boneandjointburden.org/docs/T10001.1.pdf
[54] https://www.boneandjointburden.org/docs/T10001.1.csv
[55] https://www.boneandjointburden.org/docs/T10003.2.pdf
[56] https://www.boneandjointburden.org/docs/T10003.2.csv
[57] https://www.boneandjointburden.org/docs/T10005.4.pdf
[58] https://www.boneandjointburden.org/docs/T10005.4.csv
[59] https://www.boneandjointburden.org/docs/T10007.6.pdf
[60] https://www.boneandjointburden.org/docs/T10007.6.csv
[61] https://www.boneandjointburden.org/2014-report/iih2/indirect-costs-societyemployers-0