Cervical/neck pain is another common reason for visiting a doctor. In 2010, 16.3 million patient visits, or 1.3% of all health care visits to hospitals and physician offices, were for neck pain. Three out of four (76%) of these were physician visits, while only a very small number (3%) of patients with cervical/neck pain were hospitalized. (Reference Table 2.4.1 PDF [1] CSV [2])
Cervical disorders accounted for the majority (65%) of health care visits for upper back pain in 2010. Neck disorders are primarily treated in outpatient clinics or physician offices, but are also responsible for the highest percentage of hospital discharges (60%) for upper back pain.
Cervical disc disorders accounted for only 15% of all neck pain health care visits in 2010, but were responsible for one-third of hospitalizations (33%).
Neck injuries accounted for 26% of all neck pain health care visits. This is a much higher percentage than that reported for low back injuries. Patients with neck injuries were primarily treated in an outpatient setting and, not surprisingly, represented 68% of all emergency department visits for neck pain. (Reference Table 2.3.1 PDF [3] CSV [4])
The data on cervical neck pain shows that hospital discharges are rare in people below age 18 years. When adjusted for the US 2010 census population, estimates for hospital discharges are highest in the 75 years and older age group. The average age for persons hospitalized for neck problems was 58.7 years. Emergency Department visits occurred more frequently in those below 44 years with an average age of 37.9 years. Hospital outpatient and physician office patients were on average 50.2 years and 51.0 years old, respectively. (Reference Table 2.3.2 PDF [5] CSV [6])
Almost four of five neck pain diagnoses (76.5%) in 2010 occurred in persons between ages of 18 and 64 years, the age group representing 63% of the US population. Almost one in five patients (19%) were older than 65 years, and only 4.2% were younger than 18 years of age although this group represents 24% of the US population. Cervical disorders dominated among total health care visits for neck and cervical spine disorders in all age groups, representing from 53% in the 18- to 44-year age group to 90% of all visits in the 65- to 74-year age group. A proportionately larger number of neck injuries (42%) occurred in the below-18-year age group. Adjusted for the population distribution, persons between 45 and 64 years had the highest rate of cervical/neck pain, followed closely by those age 75 years and older. (Reference Table 2.3.2 PDF [5] CSV [6])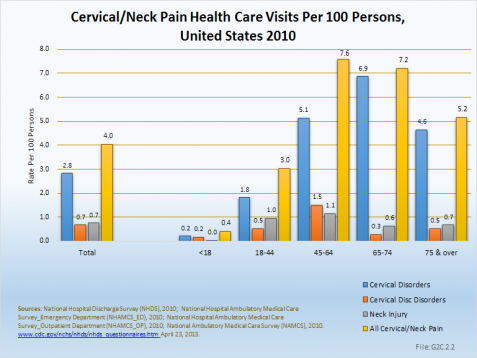
Females accounted for 55% of the health care visits for neck pain in 2010, primarily because 57% of the 315,100 visits for cervical disorders were for females. Males accounted for a greater proportion of visits for the less frequent cervical disc disorder and neck injury visits. (Reference Table 2.3.1 PDF [3] CSV [4])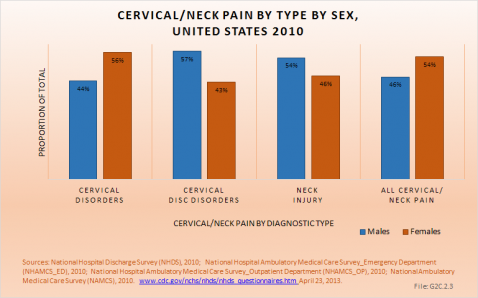
Persons hospitalized for cervical/neck pain in 2010 and 2011 spent an average of 4.5 days in the hospital. Those hospitalized for cervical/neck injuries were hospitalized for the longest period of time, on average 8 to 9 days. When comparing total days of hospitalization for all causes to those for cervical/neck pain, cervical/neck pain constitutes 1% to 2% of the discharges and of total hospital days, indicating hospital stays are, on average, similar to those for all causes. The length of hospital stays has remained relatively stable since 2004. (Reference Table 2.9.1 PDF [7] CSV [8])
Although females are likely to have slightly shorter hospital stays for all cause of cervical/neck pain, it is only for neck injuries that a real difference is seen in length of stay.
Age is a greater factor in length of stay than gender. Although young persons under the age of 18 years constitute a small proportion of back pain hospitalizations, they have longer stays for cervical/neck pain, in particular when compared to the average length of stay for any reason. While the average length of stay for cervical/neck pain is very similar to that for any health care reason among adults, the average length of stay among the young group under age 18 years is 1.5 to 2 times as long. After the age of 18 years, hospital stays for cervical/neck pain tends to increase as the population ages. (Reference Table 2.9.2 PDF [9] CSV [10] and Table 2.9.3 PDF [11] CSV [12])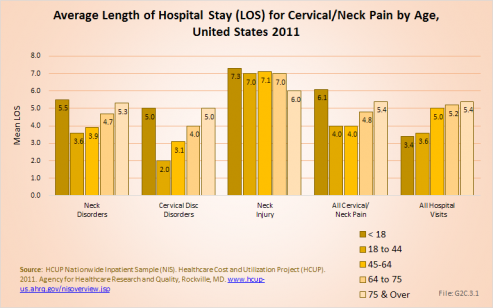
Average hospital charges are provided along with length of stay in the HCUP NIS database. On average, hospital charges for a cervical/neck pain inpatient visit were 147% that of the average inpatient visit for any cause. In 2011, an estimated $34.3 million in charges were assessed against the 660,000 inpatient stays for cervical/neck pain, 3% of the estimated total $1.37 billion in hospital charges for that year. Mean charges of $83,300 were highest for neck injuries and, at $47,800, lowest for cervical/neck disorders. (Reference Table 2.9.2 PDF [9] CSV [10])
Links:
[1] https://www.boneandjointburden.org/docs/T2.4.1.pdf
[2] https://www.boneandjointburden.org/docs/T2.4.1.csv
[3] https://www.boneandjointburden.org/docs/T2.3.1.pdf
[4] https://www.boneandjointburden.org/docs/T2.3.1.csv
[5] https://www.boneandjointburden.org/docs/T2.3.2.pdf
[6] https://www.boneandjointburden.org/docs/T2.3.2.csv
[7] https://www.boneandjointburden.org/docs/T2.9.1.pdf
[8] https://www.boneandjointburden.org/docs/T2.9.1.csv
[9] https://www.boneandjointburden.org/docs/T2.9.2.pdf
[10] https://www.boneandjointburden.org/docs/T2.9.2.csv
[11] https://www.boneandjointburden.org/docs/T2.9.3.pdf
[12] https://www.boneandjointburden.org/docs/T2.9.3.csv